Refer to Important disclosures in the last page of this report
Stock DataTarget price (Rp) Rp8,300
Prior TP (Rp) Rp9,500
Share price (Rp) Rp6,375
Upside/downside (%) +30.2
Shares outstanding (m) 46,667
Market cap. (US$ m) 20,600
Republic of Indonesia 60.0%
Estimate Change; Vs. Consensus
2018F 2019F PT Indo Premier Sekuritas stephan.hasjim@ipc.co.id +62 21 5793 1168
On more solid growth foundation
1H18 profit up 28% yoy off low-base; core profit grew 8% (in-line).
Top line growth was lacking due to slow asset growth, lower NIMs.
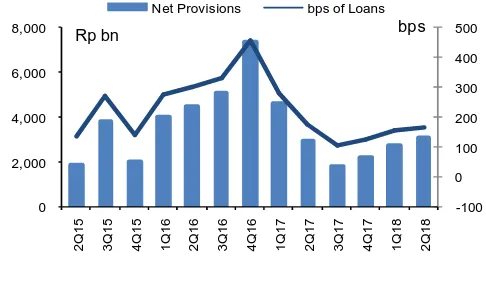
Credit cost has improved but new NPLs remain at elevated levels.
Reiterate BUY with lower TP (Rp8,300) due to higher cost of capital.
Results in-line.
BMRI reported net profit of Rp12.2tn in 1H18 (+28.7%), with its
2Q/1Q profits forming 25%/23% of our FY18F forecasts of Rp25.2tn (in-line),
albeit this was partly helped by one-off tax-case provisioning reversal of Rp1.08tn
in 2Q after the bank won a Supreme Court ruling in May on its long-standing tax
dispute with the tax authorities. However, BMRI’s strong profit growth was also
off a low-base in 1Q17 and mainly driven by its falling loan provisions (-15%)
while its core profit (PPOP) grew only modestly by 7.6% in 1H (or only 2% growth
if excluding the tax-case provision reversal). Despite lacking top-line growth, we
believe BMRI is now on a more solid foundation to grow earnings as NPL risks are
diminishing and its credit costs are normalising in the coming years.
Slow top-line growth
. BMRI’s weak top-line growth can be attributed to its slow
asset growth of 8.3% (loans: +12%; deposits: +5%) as it mitigated NIM pressure
by slowing deposit growth. In our calculation, NIMs narrowed to 5.57% (-17bps)
as the fall in its IDR loan yield to 9.9% in 2Q18 (-60bps yoy) was steeper than
that of its IDR cost of funds (at 2.9%; -40bps yoy) despite slower growth of
customer deposits vs. loan portfolio. As such, we lower our FY18F NIM assumption
by 12bps to 5.43% vs. revised guidance of 5.5%-5.7% (from 5.7%-5.8%).
Asset quality
. BMRI’s credit cost improved significantly to 2.1% in 1H18 (1H17:
2.9%; FY17: 2.3%) while its NPL ratio declined to 3.1% in 2Q vs. 3.3% in 1Q and
3.8% a year ago. However, the bank’s new NPLs formation of Rp8.2tn in 1H18
(2.6% of loans) remained at elevated levels albeit still in-line with guidance of
Rp15-16tn for FY18F. New NPLs came from commercial & SME loans, each at 6%
of loans vs. 4% for micro, 1.5% for consumer loans. The bank still maintained its
credit cost guidance of 2.0-2.2% for FY18F and expects credit cost to normalise to
a steady-state rate of 1.5% by 2020 as its loan portfolio shifts towards lower-risk
corporate & consumer loans, away from commercial & SME loans.
Valuation
. We keep our earnings forecasts largely unchanged but lower our TP to
Rp8,300 (from Rp9,500) due to our 50bps higher cost of capital assumption to
reflect rising 10-yr yields during the second quarter. Our TP is based on our
GGM-derived target FY18F P/B of 2x, assuming LT ROAE of 16.6%, growth of 8.5%,
and cost of equity of 12.5% (from 12%). We estimate BMRI’s LT ROAE based on
DuPont analysis, assuming LT ROAA of 2.08% and asset/equity leverage of 8x.
We maintain our BUY rating.
Bank Mandiri
(
BMRI IJ
)
20 July 2018
Results Note
BUY
(Unchanged)
Year To 31 Dec 2016A 2017A 2018F 2019F 2020F
Operating income (RpBn) 70,824 73,718 80,346 87,819 96,131
PPOP (RpBn) 39,556 38,704 43,188 47,766 52,952
Source: BMRI, IndoPremier Share Price Closing as of : 19-July-2018
2
Refer to Important disclosures in the last page of this report
Fig. 1: Net Interest Income (Rp bn) and NIMs (%) Fig. 2: Non-Interest Income (Rp bn; % of Gross Income)
Source: Company, IndoPremier Source: Company, IndoPremier
Fig. 3: Operating Expense (Rp bn) and Cost/Income Ratio (%)
Fig. 4: Pre-Provision Profit (Rp bn; % of Average Assets)
Source: Company, IndoPremier Source: Company, IndoPremier
Fig. 5: Net Loan Provisioning (Rp bn; bps of Average Loans) Fig. 6: Net Profit (Rp bn) and ROAA (%)
Source: Company, IndoPremier Source: Company, IndoPremier
3.0%
Net Interest Income Net Interest Margin
Rp bn
Other Income Other Income % of Total
Rp bn
Operating Expenses Cost-Income Ratio
Rp bn
Pre-Provision Profit Pre-Provision Profit ROAA
Rp bn
Net Provisions bps of Loans
bps
Net Profit Net Profit ROAA
3
Refer to Important disclosures in the last page of this report
1H 2018 Results
(Rp Bn) 1H18 1H17 % Y-Y 2Q18 1Q18 % Q-Q
Risk-Weighted Assets 830,913 739,131 12.4 830,913 795,076 4.5
Shareholders’ Funds 166,834 154,745 7.8 166,834 162,128 2.9
4
Refer to Important disclosures in the last page of this report
Year To 31 Dec (RpBn) 2016A 2017A 2018F 2019F 2020F
Income Statement
Interest income 76,710 79,502 81,919 91,870 103,646
Interest expense (24,885) (27,174) (26,295) (29,575) (35,052)
Net interest income 51,825 52,327 55,624 62,294 68,593
Fees and commissions 11,440 12,483 13,213 14,535 15,988
Trading income 3,027 3,950 4,685 4,928 5,185
Other operating income 4,532 4,958 6,824 6,062 6,365
Total operating income 70,824 73,718 80,346 87,819 96,131
Personnel expenses (13,619) (14,859) (16,047) (17,331) (18,718)
G&A expenses (13,958) (15,406) (16,176) (17,470) (18,868)
Other operating expenses (3,691) (4,750) (4,934) (5,252) (5,593)
Pre-provision operating profit 39,556 38,704 43,188 47,766 52,952
Provisions (24,645) (15,952) (15,441) (14,266) (13,122)
Loan recovery income 3,702 4,417 4,500 4,500 5,000
Operating profit 18,613 27,170 32,247 37,999 44,831
Non-operating profit (40) (13) 0 0 0
Exceptional items 0 0 0 0 0
Pre-tax profit 18,573 27,157 32,247 37,999 44,831
Income tax (3,923) (5,714) (6,449) (7,600) (8,966)
Minority interests (844) (803) (827) (869) (912)
Reported net profit 13,807 20,640 24,970 29,531 34,952
Balance Sheet
Cash 22,907 24,269 28,177 30,821 33,723
Current account with BI 52,485 50,188 60,991 66,434 72,403
Placements at BI & other banks 83,977 86,931 91,277 95,841 100,633
Short-term investments 61,606 62,161 57,354 53,027 49,133
Government bonds 98,933 103,411 103,411 103,411 103,411
Gross loans 662,013 729,548 814,896 917,207 1,032,455
Loan provisions (32,945) (34,116) (37,687) (41,953) (45,075)
Other assets 89,730 102,309 111,087 120,852 131,738
Total Assets 1,038,706 1,124,701 1,229,507 1,345,640 1,478,422
Customer deposits 762,501 815,807 890,353 972,087 1,061,736
Deposits from other banks 9,675 8,795 9,074 9,382 9,720
Securities and borrowings 48,477 56,332 59,068 62,078 65,389
Other liabilities 64,683 73,762 76,824 78,014 82,148
Total Liabilities 885,337 954,695 1,035,320 1,121,562 1,218,993
Share capital 28,983 28,983 28,983 28,983 28,983
Reserves and others 24,540 26,378 25,261 25,261 25,261
Retained earnings 96,931 111,358 136,327 165,858 200,810
Shareholders' equity 150,454 166,719 190,571 220,101 255,053
Minority interest 2,916 3,287 3,616 3,978 4,375
Total Liabilities & Equity 1,038,706 1,124,701 1,229,507 1,345,640 1,478,422
5
Refer to Important disclosures in the last page of this report
Year To 31 Dec 2016A 2017A 2018F 2019F 2020F
Growth Ratios (% yoy)
Gross loans 11.2 10.2 11.7 12.6 12.6
Total assets 14.1 8.3 9.3 9.4 9.9
Customer deposits 12.7 7.0 9.1 9.2 9.2
Net interest income 14.2 1.0 6.3 12.0 10.1
Non-interest income 3.6 12.6 15.6 3.2 7.9
Total operating income (29.3) 46.0 18.7 17.8 18.0
Operating expense 8.7 12.0 6.1 7.8 7.8
PPOP 13.2 (2.2) 11.6 10.6 10.9
Net profit (32.1) 49.5 21.0 18.3 18.4
Profitability Ratios
ROAA (%) 1.44 1.94 2.12 2.29 2.48
ROAE (%) 10.5 13.4 14.0 14.4 14.7
NIM (%) 6.28 5.71 5.43 5.57 5.59
Credit cost (bps) 349.4 172.3 141.7 112.8 83.3
Cost/income (%) 44.1 47.5 46.2 45.6 44.9
LDR (%) 86.8 89.4 91.5 94.4 97.2
CAR (%) 20.8 19.1 18.9 18.8 18.8
NPL ratio (%) 4.0 3.5 3.2 3.1 2.8
Provisions/NPL (%) 124.6 134.8 143.5 148.0 153.8
Head Office
PT INDO PREMIER SEKURITAS
Wisma GKBI 7/F Suite 718
Jl. Jend. Sudirman No.28
Jakarta 10210 - Indonesia
p +62.21.5793.1168
f +62.21.5793.1167
INVESTMENT RATINGS
BUY : Expected total return of 10% or more within a 12-month period HOLD : Expected total return between -10% and 10% within a 12-month period SELL : Expected total return of -10% or worse within a 12-month period
ANALYSTS CERTIFICATION.
The views expressed in this research report accurately reflect the analyst;s personal views about any and all of the subject securities or issuers; and no part of the research analyst's compensation was, is, or will be, directly or indirectly, related to the specific recommendations or views expressed in the report.
DISCLAIMERS