Application of Manure to Frozen Ground in Ohio
Lloyd Owens
1, James Bonta
1, Martin Shipitalo
1, Shane Rogers
2,and John Haines
3*1
USDA-Agricultural Research Service, North Appalachian Experimental Watershed (NAEW)
Coshocton, OH;
2Civil & Environmental Engineering, Clarkson University,
Potsdam, NY;
3USEPA, Cincinnati, OH
Introduction
Winter handling and storage of manure is a challenge for livestock producers that have animals confined all or part of the year. Manure storage facilities are expensive, and the longer period for which storage is required, the greater the expense. Management practices that will allow winter application of manure in an environmentally sound manner will reduce the costs of animal production.
Objective
Using recommended best management practices, measure nutrient concentrations in runoff from an area that has received surface application of manure while the ground was frozen. Both plots and small watersheds were used (USEPA collaborators assessed pathogens.)
Current Ohio NRCS Recommendations
Among the recommendations by Ohio NRCS for manure application to frozen ground:
- limit of 22.4 wet Mg/ha (10 T/Ac) for solid manure >50% moisture
- apply to land with >90% surface residue cover
- minimum setback of 61 m (200 ft) from grassed waterways, surface drainage ditches, streams, water bodies. - additional criteria apply when slopes exceed 6%
Materials and Methods
Plot Design:
Six plots: 61 x 12 m (average slope of approximately 10%) - 3 plots with a 61 m filter bed
- 3 plots with a 30 m filter bed
Four plots received 22 Mg/ha of a beef slurry (9% solids) on February 21, 2007 (surface was frozen, snow-covered - 2 with a 61 m filter bed
- 2 with a 30 m filter bed
Two control plots received no manure.
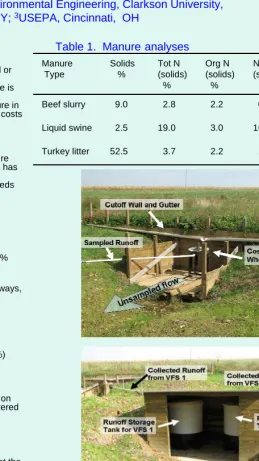
Runoff samples were collected with “dust pan” samplers at the edge of the application area and 11 m down slope as well as with Coshocton wheels below the filter beds.
Watershed Design
Six small, continuous no-till corn watersheds (WS), approximately 1 ha each
- 4 WS received manure targeted to supply 180 kg N/ha (N rate for 18 Mg/ha corn yield) with a 30 m setback from the bottom of the WS. Manure was applied to frozen, snow-covered ground on February 21 & 22, 2007. N fertilizer was applied at 180 kg N/ha in the setback area prior to planting. “Dust pan” samplers were installed at the application edge. Each WS had a Coshocton wheel sampler.
- 2 WS received liquid swine manure (2.5% solids); - 2 WS received turkey litter (52.5% solids).
- 2 control WS received 180 kg N fertilizer/ha prior to corn planting
Sample Analyses
Samples were analyzed for:
- Nutrients – NH4, NO3, Org N, & PO4(ARS)
- Pathogens – E. coli & enterococci (USEPA) _________
*John Haines unexpectedly passed away in September 2007.
Figure 1. Cutoff walls, Coshocton Wheel samplers (above), and runoff storage tanks for manure plots (below).
Figure 2. Manure plot after application of beef slurry with a 30 m filter bed below the application area.
Table 1. Manure analyses
Manure Type
Solids %
Tot N (solids)
%
Org N (solids)
%
NH4-N
(solids) %
Tot P (solids)
%
Beef slurry 9.0 2.8 2.2 0.6 0.44
Liquid swine 2.5 19.0 3.0 16.1 1.97
Figure 3. Watershed with liquid swine manure (above) and same watershed in late summer (below). The difference in the color of the crop between the fertilized and manured areas indicates that not all of the manure N was available.
Preliminary Results
Although the intent was not to apply manure to snow-covered ground, the 2006-07 winter was such that there was only a small window of application opportunity. Thus, manure was applied to snow with precipitation within a few days after application – a “worst case” scenario.
Most of the plot runoff samples collected within 10 days of manure application were with Coshocton Wheels (CW) at the base of the filter strips; after 10 days, most of the samples were collected in the dust pan samplers (DP) – very few at the base of the filter strips. There were only 2 dates when samples were collected at multiple points in the plots (March 2 and 15), Figure 4.
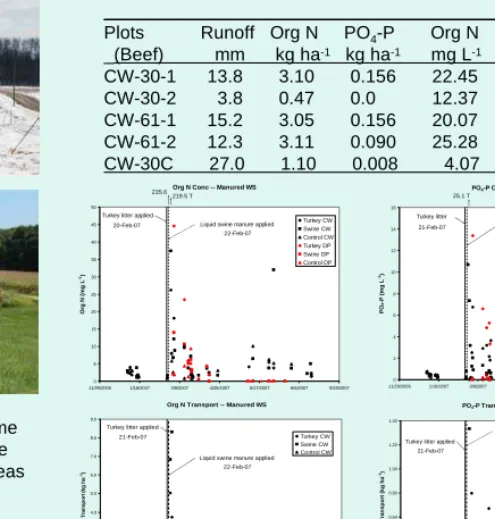
Figure 4. Organic N concentrations and transport (L, top &
bottom) and PO4-P concentrations and transport (R, top &
bottom) for runoff events from manure plots. CW = Coshocton wheel; DP = dust pan samplers.
Most of the N in the runoff was Org N (>70%); concentrations of
Org N and PO4-P were lower in plot runoff than watershed
runoff (Figure 5), especially for PO4-P; with less runoff
(Table 2), transport was considerably less from the plots.
Figure 5. Org N concentrations (top, L) and transport (bottom, L);
PO4-P concentrations (top, R) and transport (bottom, R) for
runoff events from the small watersheds – Jan - Aug 2007.
Table 3. Runoff, concentrations, and transport from the watersheds (Feb 21 – July 21, 2007)
Elevated nutrient concentrations did not necessarily produce elevated nutrient transport. Event runoff was often very low. Rain soon after application was a major detriment (a “worst
case” scenario), although data are not available to quantify the impact.
Even in this situation, there was some decrease in nutrient concentrations between the dust pan and Coshocton wheel samples.
The runoff and subsequent nutrient transport were much less with the grassed filter strip than with the corn stover on the watersheds. A winter cover crop in addition to the corn stover may be beneficial.
Manure application increased losses of all forms of N & P despite differences in runoff among watersheds.
Summary
Data are too limited to make firm recommendations. There needs to be data from weather conditions that fit application recommendations, i.e. not a “worst case” scenario. Nevertheless, early indications are that filter strips are beneficial and that heavy sod reduces runoff and nutrient transport more than corn stover.
Table 2. Runoff, concentrations and transport of Org N and
PO4-P from plots/filter strips (Feb 21 – July 21, 2007)
[CW = Coshocton wheel; 30 & 61 = length of filter strip (m); 1 & 2 = replicates; C= control]
_____________________________________________
11/29/2006 1/18/2007 3/9/2007 4/28/2007 6/17/2007 8/6/2007 9/25/2007
PO Liquid swine manure applied
22-Feb-07 Turkey litter
21-Feb-07
11/29/2006 1/18/2007 3/9/2007 4/28/2007 6/17/2007 8/6/2007 9/25/2007
Or Liquid swine manure applied
22-Feb-07 Turkey litter applied
20-Feb-07 235.6
219.5 T
Org N Transport -- Manured WS
0.0
11/29/2006 1/18/2007 3/9/2007 4/28/2007 6/17/2007 8/6/2007 9/25/2007
O Liquid swine manure applied
22-Feb-07 Turkey litter applied
21-Feb-07
PO4-P Transport -- Manured WS
0.00
11/29/2006 1/18/2007 3/9/2007 4/28/2007 6/17/2007 8/6/2007 9/25/2007
PO Liquid swine manure applied
22-Feb-07 Turkey litter applied
21-Feb-07
Org N Transport -- Manure Plots
0.0
1/8/2007 1/18/2007 1/28/2007 2/7/2007 2/17/2007 2/27/2007 3/9/2007 3/19/2007 3/29/2007 4/8/2007 4/18/2007 4/28/2007
O Beef slurry applied
20-Feb-07
Org N Conc -- Manure Plots
0
1/8/2007 1/18/2007 1/28/2007 2/7/2007 2/17/2007 2/27/2007 3/9/2007 3/19/2007 3/29/2007 4/8/2007 4/18/2007 4/28/2007
Or Beef slurry applied
20-Feb-1/8/20071/18/20071/28/20072/7/20072/17/20072/27/20073/9/20073/19/20073/29/20074/8/20074/18/20074/28/2007
PO Beef slurry applied
20-Feb-07
2-Mar-07
15-Mar-07
PO4-P Transport -- Manure Plots
0.00
1/8/2007 1/18/2007 1/28/2007 2/7/2007 2/17/2007 2/27/2007 3/9/2007 3/19/2007 3/29/2007 4/8/2007 4/18/2007 4/28/2007
PO Beef slurry applied