`Reducing Lead and
Brown Color from Heavy Metal’s Elimination’s
Filtrate
Indrajati Kohar1, Ratih2, Cynthia Lynawati3, M. Arbi Hadiyat4 Ni Nyoman Tri Puspaningsih5, Leon Janssen6, Kestrilia Rega7
1
Professor, Laboratory of PharmaceuticalChemistry, Faculty of Pharmacy, TheUniversity of Surabaya, Surabaya, Indonesia.
2
Junior Lecturer,Laboratory of PharmaceuticalChemistry, Faculty of Pharmacy, TheUniversity of Surabaya, Surabaya, Indonesia.
3
Student, Laboratory of PharmaceuticalChemistry, Faculty of Pharmacy,, Surabaya, Indonesia.
4
Lecturer, Dept. of Industrial Engineering, University of Surabaya, Surabaya, Indonesia.
5
Professor, Faculty of ScienceandTechnology, University of Airlangga, Surabaya, Indonesia.
6
Professor, Dept. of ChemicalEngineering, Faculty of Science, RijksUniversiteit of Groningen, TheNetherlands.
7Lecturer, Faculty of Science and Technology, Machung University, Malang, Indonesia.
ABSTRACT
Heavy metals contamination is a major concern in the world. Many studies showed that rice straw as agricultural waste could adsorb heavy metals from polluted water, and it is cheap. The drawback is that it produced brown water, which is unacceptable for household purposes. Enzyme L--arabino-furanosidase reduced the brown color considerably. In the previous study, enzyme-50: straw = 2 : 1, 1 hour incubation time, amount of washing: 5 x 5 ml, place of harvesting: low land, and ground straw showed the highest responds in terms of % Pb adsorbed. Either demineralised water or Pb solution could be used to wash the straw. To invest the feasibility for use in daily life, especially in remote and poor villages, a more thorough and in depth study was conducted to optimize the usage of the enzyme. The addition of enzyme : straw =4:1, and 1 hour incubation time contributed significantly toward the reduction of the brown color. However, the increase of enzyme and incubation time resulted in a decrease of the elimination of lead. This might be due to the elimination of lignin from the straw, whereas lignin also contributes to the elimination of the heavy metal. Maximum lead reduction (0.63 mg Pb(II)/g straw) was obtained at 0 gram enzyme and 22.3 minutes incubation time.
Key words: brown color of rice straw filtrate, heavy metals, L--arabino-furanosidase enzyme,adsorption
Introduction
Heavy metals contamination of ground and surface water is of growing concern in many parts of the world, particularly in developing countries in which large populations have to use these sources for drinking and cooking water.
Indonesia is facing substantial heavy metal pollution of ground- and surface water in industrialized areas. A study by Sutomo[1] found that there was Pb in drinking water in an area in Yogyakarta and its impact on children. Yuliandari et al. [2] reported that the blood samples of pregnant women, breast feeding mothers and children under five years old in Kenjeran area (in Surabaya) contained heavy metals such as Cd, Hg, and Pb. Kohar et al. [3] in their study on the hair of autistic and non autistic children and adults also found an interesting results, that the hair of the autistic children contained twice as much lead as the hair of non autistic adults, and the adults hair also contained twice as much lead as in the hair of non autistic children.
Many studies have been conducted to eliminate heavy metals from water resource such as flocculation, titration, using activated charcoal, and ion exchange, precipitation by chemicals, etc. However, because these methods are costly, the development of a more cost-effective and environmentally friendly remediation system is necessary. In order to find more cost-effective and environmentally friendly methods, several studies have been carried out since many years ago, by using living and dried plants, and agricultural wastes, such as soybean hulls, sugarcane bagasse, rice hulls, rice straw, barley straw, rice milling by product, etc., treated or untreated straw, studies on single or mixed metals solutions, or on industrial effluents [4], [5], [6], [7], [8], [9], [10], [11], [12], [13], [14].
the filtrate has brown color, and of course it cannot be used in everyday needs, not to say as drinking water. Some means and materials have been used to clean the filtrate from the brown color, such as bentonite, zeolite, sand, charcoal, and carbo adsorbent[15]. However, the results were inconclusive.
A preliminary study using --arabino-furanosidase enzyme has been conducted in eliminating the brown color (which is due to lignin) of the straw’s extract, and it showed a satisfactory result, which is extracting lignin from the straw and the end result is clear water with low concentration of heavy metal (Pb) [16]. To provide clear drinking and cooking water for the villagers in the villages with contaminated wells, the process is supposed to be simple; if possible: a) using whole straw; b) use as little as possible enzyme; c) preferably without washing. If not possible: then wash the straw with contaminated water.
So, it is imperative to continue the research using the enzyme. In this research the optimization of the process was carried out by varying on the amount of enzyme (ml), and time of incubation (h). The screening experiments showed that the variables which gave the highest respond in terms of mg Pb(II) adsorbed/g straw, were enzyme-50 : straw = 4 : 1 (4 g of enzyme for each 1 g of straw), 1 hour incubation time, amount of washing : 5 x 5 ml, place of plant: low land, and size of straw: ground. As for the type of washing liquid, both either demineralised water or Pb(II) solution were the same[17]
Materials and Method: 1. Materials:
Rice straw from lowland (Mojokerto area. East Jawa).Demineralised water (Faculty of Pharmacy Laboratory). -L-arabinofuranosidase enzyme (University of Airlangga). Lead acetate.3H2O p.a., and Standard stock Lead solution
(1000 ppm) (Merck).
2. Instrumentation:
Spectrophotometer (Cintra, Hewlett Packard, USA). Gram Balance. Analytical Balance (Sartorius. type BJ 210S), Inductively Coupled Plasma Spectrometeter - ICPS (Fisons, model 3410 ARL, USA), with argon as reactant gas.
3. Work Protocol
3.1. Preparation of the rice straw.
Rice straw from lowland was dried under the sun for 1 day, then was shredded/punched to break the skin. The length of the straw was around 30 cm. To simplify the preparation of the straw, it was shredded or punch, not ground.
3.2. Preparation of the enzyme
The ratio of the straw and the enzyme were 1:0 = did not use enzyme, just sprayed with demineralised water; 1:2 = 4 grams of straw : 8 g of enzyme, and 1:4 = 4 grams of straw : 16 grams of enzyme.
The enzyme which was used in this step
was produced in “application” medium, which
contains defined salts. The enzyme which was used in the precious step was produced in “Luria Bertani” medium which was more expensive. The changing of the type of the enzyme was carried out to make the process cheaper, so that it can be applied in the
community with minimum /less cost. The “applied”
enzyme was produced using Bacillus subtilistermophile, which was inoculated into a solid medium, and then was grown about 16 – 18 hours. Then the bacteria were moved to a liquid medium. 1% of the liquid medium was taken to be able to produce a bigger scale. Then it was harvested, and centrifuged, and then the supernatant liquid and pellets were obtained. Because the enzyme was an extracellular enzyme, the supernatant was taken.
3.3. Preparation of washing liquid (5 ppm Pb(II) solution).
Washing liquid was prepared by dissolving (CH3COO)2Pb.3H2O (9.15 mg) in demineralised
water to make 1000 ml solution (5 ppm of Pb(II)). Pb(II) solution was used to wash the straw, to make it easier to apply this method in the village, i.e. to wash the straw with contaminated well water. In the previous step it was proven that Pb solution as washing liquid did not affect the adsorbtion of Pb(II) by enzyme-pretreated straw.
3.4. Experiments on the Adsorption of Pb(II) by the filter Paper.
A working solution of 5 ppm Pb(II) was prepared from a standard solution of Pb(II) 1000 ppm. Six experiments were conducted. The first one was measuring the intensity of the Pb(II) solution without filtration by the ICP, then the second experiment up to the sixth were measuring the intensities of Pb(II) after filtration by filter paper Whatman 41. All measurements in this step were carried out at λ 283.306 nm.
Adsorption of Pb(II) by the filter paper =
3.5. Preparation of Pb(II) Working Standard Solution and of the Calibration Curve
Pb(II) solutions (0.5; 1; 2; 5 and 10 ppm) were prepared from 1000 ppm standard solution, each one of them were filtered by Whatman 41 filter paper, their intensities were measured by ICP at λ 283.306 nm. and a calibration curve was made by plotted the concentrations vs the intensities of Pb(II) solution.
3.6. Checking the Reliability of the Calibration Curve.
To make sure that the result of the ICP measurements were correct, the calibration curve need to be checked as follows:
5,0 ml Standard solution (1000 ppm Pb(II)) was pippeted to a 100,0 ml volumetric flask, then demineralised water was added to the mark (100,0 ml). From this solution was pippeted 2,0 and 5,0 ml into 50,0 ml volumetric flasks, demineralised water was added to the marks, then the solutions were filtered to make 2 ppm and 5 ppm Pb(II) solutions. 1. 2 ppm and 5 ppm solutions were measured and determined their concentrations using the present calibration curve.
2. Conclusion was made by :
a. If the results of ICP reading show a different not more than 5% of the 5 ppm standard Pb(II) solution, the calibration curve was still good and can be used in the experiment.
b. If the results of ICP reading show a different more than 5% of the 5 ppm standard Pb(II) the calibration curve cannot be used, and a new one must be made.
3.7. Blank experiments
To demineralised water was added 1 gram of pretreated straw, then water was added until 200 grams, then it was left for 1 hour, then was filtered by Whatman ≠ 41 filter paper. The straw was dried under the sun, and referred as enzyme-pretreated-straw, the filtrate was weighed and the intensity was measured by ICP, and the absorbance was measured by Spectrophotometer. The intensity of the water itself was also measured. These data are used to calculate the amount of Pb(II) adsorbed.
3.8. Sample preparation
Rice straw (punched, 30 cm length) was weighed (4 grams), then water or enzyme, α -L-arabinofuranosidase 50ºC (8 or 16 grams) was sprayed to the straw and incubated at ambient temperature at different incubation times. The incubation time was counted after the entire water or enzyme was sprayed to the straw, then after the certain incubation time, the straw was washed with
Pb solution (1 x 60 ml), and then was filtered with filter paper. The filtrate was discarded and the straw was dried under the sun. The enzyme pretreated-straw was soaked in 5 ppm Pb(II) solution, left for 1 hour, then was filtered. The color of the filtrate was measured by spectrophotometer at 473 nm and the Pb(II) content by ICPS. The incubation time was not too long, only up to 60 minutes, because in the previous experiment, the incubation time more than 60 mins did not show significant different in terms of the absorbance of the filtrate.
Calculation of Pb(II) adsorbed/g straw: [(Initial concentration (ppm)/1000) x the weight of solution (gram)]-[(final concentration (ppm)/1000) x weight of filtrate (gram)] / weight of straw (gram)
3.9.Response Surface Methodology
In this study,Response Surface Methodology was applied to find optimum independent variables setting which will obtain maximum response. This methode is used to develop, to enhance and to optimise the process[18].
Result and Discussion
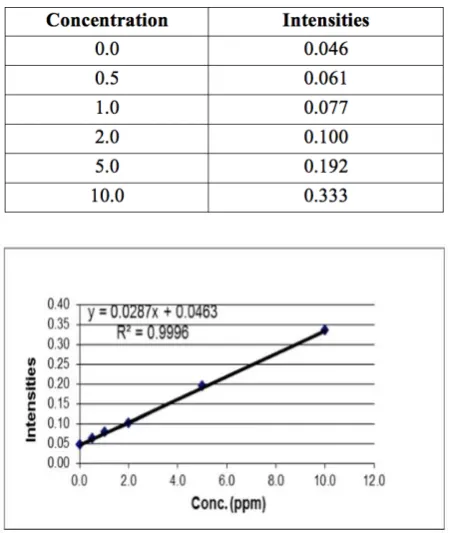
1. Calibration curve of Pb(II) solution
Table 1. Concentrations and Intensities of Pb(II) solution
Fig 1. Calibration curve of Concentration (ppm) vs Intensities of Pb(II) solutions
2. Adsorption of Pb(II) by the Filter Paper
solutions in the experiments are filtered prior measuring by the ICP.
3. Statistical Analyses of the Optimization
Condition of The Amount of Enzyme and of The Incubation Time vs mg Pb adsorbed/g straw
Screening experiment
From the previous experiment, it was known that there were 2 variables that has an effect towards the adsorption of Pb, i.e. the ratio of straw:enzyme and the incubation time.
Determination of starting (initial) point 1) The Results around the starting point.
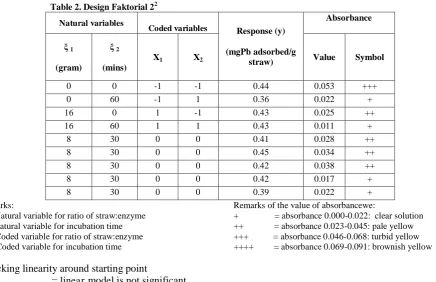
Table 2. Design Faktorial 22
Natural variables
Coded variables Response (y)
(mgPb adsorbed/g straw)
Absorbance
ξ 1
(gram)
ξ 2
(mins)
X1 X2 Value Symbol
0 0 -1 -1 0.44 0.053 +++
0 60 -1 1 0.36 0.022 +
16 0 1 -1 0.43 0.025 ++
16 60 1 1 0.43 0.011 +
8 30 0 0 0.41 0.028 ++
8 30 0 0 0.45 0.034 ++
8 30 0 0 0.42 0.038 ++
8 30 0 0 0.42 0.017 +
8 30 0 0 0.39 0.022 +
Remarks:
ξ1 : Natural variable for ratio of straw:enzyme
ξ2 : Natural variable for incubation time
X1 : Coded variable for ratio of straw:enzyme
X2 : Coded variable for incubation time
Remarks of the value of absorbancewe:
+ = absorbance 0.000-0.022: clear solution ++ = absorbance 0.023-0.045: pale yellow +++ = absorbance 0.046-0.068: turbid yellow ++++ = absorbance 0.069-0.091: brownish yellow
Checking linearity around starting point
H0 = linear model is not significant
H1 = linearmodel is significant
Conclusion = H0 is accepted because the test statistic value: P>0.05
Statistical Analyes using software Minitab 14 with Response Surface Method (Linear-Interaction Model) :
Response Surface Regression: mg Pb adsorbed vs Code amount , Code time i
The analysis was done using coded units.
Estimated Regression Coefficients for mg Pbterjerap/g jerami
Term Coef SE Coef T P
Constant 0.41667 0.006498 64.124 0.000 Code amount of enzyme 0.01500 0.009747 1.539 0.184 Code inc time - 0.02000 0.009747 -2.052 0.095 Code amount of enzyme* 0.02000 0.009747 2.052 0.095 Code inc time
S = 0.01949 R-Sq = 68.3% R-Sq(adj) = 49.3%Analysis of Variance for mg Pb adsorbed/g straw
Source DF Seq SS Adj SS Adj MS F P Regression 3 0.004100 0.004100 0.001367 3.60 0.101 Linear 2 0.002500 0.002500 0.001250 3.29 0.123** Interaction 1 0.001600 0.001600 0.001600 4.21 0.095 Residual Error 5 0.001900 0.001900 0.000380
Lack-of-Fit 1 0.000020 0.000020 0.000020 0.04 0.847 Pure Error 4 0.001880 0.001880 0.000470
Path of Steepest Accent was conducted after Factorial 22 step was carried out. However, in the previous step i.e. factorial 22 step, it was found that the linearity was not conformed, which was shown by the linear value = 0.123** (linearity was conformed if the value P < 0.05), for that, the steepest accent step (the adding of ∆ is continuously carried out until maximum/minimum point of the response is obtained) can be neglected and the experiment can be done straight to the next step, i.e.
1. Checking the curvature around the initial point by using CCD (Central Composite Design).
2. PSA (Path of Steepest Accent) was not conducted
3. Checking the initial point was not carried out, but checking the curvature around the initial point will be conducted straight away. 4. Experimental Design by CCD (Central
Composite Design)
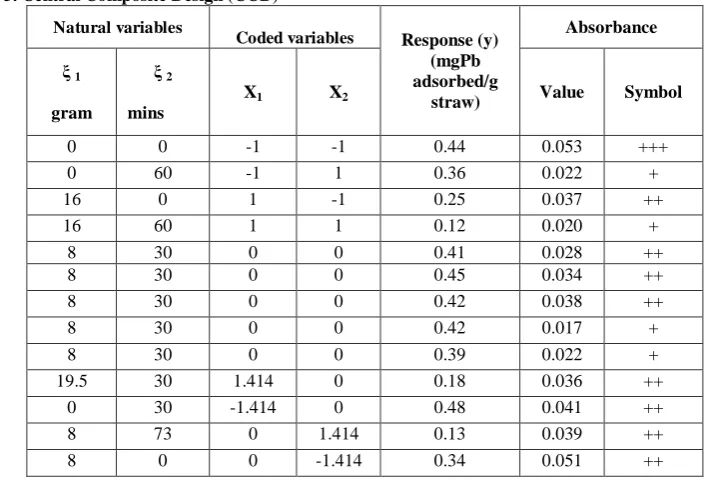
Table 3. Central Composite Design (CCD)
Natural variables
Coded variables Response (y) (mgPb adsorbed/g
straw)
Absorbance
ξ 1
gram
ξ 2
mins
X1 X2 Value Symbol
0 0 -1 -1 0.44 0.053 +++
0 60 -1 1 0.36 0.022 +
16 0 1 -1 0.25 0.037 ++
16 60 1 1 0.12 0.020 +
8 30 0 0 0.41 0.028 ++
8 30 0 0 0.45 0.034 ++
8 30 0 0 0.42 0.038 ++
8 30 0 0 0.42 0.017 +
8 30 0 0 0.39 0.022 +
19.5 30 1.414 0 0.18 0.036 ++
0 30 -1.414 0 0.48 0.041 ++
8 73 0 1.414 0.13 0.039 ++
8 0 0 -1.414 0.34 0.051 ++
Remarks on absorbance values :
+ = absorbance 0.000-0.022 clear solution ++ = absorbance 0.023-0.045 pale yellow +++ = absorbance 0.046-0.068 turbid yellow ++++ = absorbance 0.069-0.091 brownish yellow
Data analyses of CCD (Central Composite Design)
H0 = regression model Full Quadratic is not significant
H1 = regression model Full Quadratic is significant
Conclusion = H0 was rejected because test statistic value P<0.05
Statistical Analyses by software Minitab 14 with Response Surface Method (Full Quadratic Model) :
Response Surface Regression: mg Pb adsorbed versus Code amount, Code time i
The analysis was done using coded units.
Estimated Regression Coefficients for mg Pb adsorbed/g straw
Term Coef SE Coef T P
Constant 0.41800 0.009308 44.908 0.000
Code amount of enzyme -0.10679 0.007359 -14.512 0.000
Code incubation time -0.06338 0.007359 -8.612 0.000
Code amount enzym*Code amount enzyme -0.04150 0.007893 -5.258 0.001 Code incubation time*Code incubation time -0.08902 0.007893 -11.278 0.000 Code amount of enzyme*Code incubation time -0.01250 0.010406 -1.201 0.269
Analysis of Variance for mg Pb adsorbed/g straw
From the statistical analyses above, it was seen that Full Quadratic Model did fit for mg Pb adsorbed/g straw in step CCD (Central Composite Design), by linear value = 0.000** (P<0.05), square = 0.000** (P<0.05) and did not fit for 0.548** (P>0.05). This means that the above modeling did fit, so that it can be concluded the highest (top) point of the three dimensional model of ratio of straw:enzyme, incubation time and mg Pb(II) adsorbed/g straw has been found. The three dimensional mathematical equation is:
Remarks :
x1 = optimum amount of enzyme x2 = optimum incubation time
5. Determining optimum value
From the model above, the x1 and x2 value can be obtained, which will produce maximum y and it can be
calculated with the following equations:
Code of amount of enzyme to get optimum response:
Code of
incubation time to get optimum
response
:
Calculation for optimum value of the real amount of enzyme and incubation time:
For optimum amount of enzyme: -1.23096 = 0 gram, because the value is below – 1, whereas the code – 1 referred to 0 gram amount of enzyme
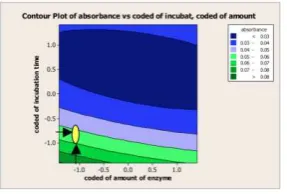
By statistical analyses using response surface method, it was found that 0 gram enzyme (code -1.23096) and 22.3 minutes incubation time (code -0.25712) yield 0.63 mg Pb adsorbed/g straw as maximum. To be able to see the condition of the filtrate in the position of maximum mg Pb
adsorbed/g straw, vertical and horizontal line can be drawn in the countour plot (Fig 2) below. The
values of the filtrate’s absorbance vs amount of
enzyme and incubation time can be observed as follows:
Fig 2. Countour plot of Optimum absorbance vs Amount of Enzyme and Incubation time
To confirm the results, another experiment was conducted:
Experimental Results of Anova Factorial Design
Table 4. Experimental Results
Natural variables
Coded variables Response (y)
(mgPb adsorbed/g
straw)
Absorbansi
ξ1
gram
ξ2
mins
X1 X2 Value Symbol
0 0 -1 -1 0.16 0.027 ++
0 0 -1 -1 0.18 0.046 +++
0 0 -1 -1 0.44 0.053 +++
0 30 -1.414 0 0.47 0.035 ++
0 30 -1.414 0 0.48 0.041 ++
0 30 -1.414 0 0.45 0.042 ++
0 60 -1 1 0.52 0.057 +++
0 60 -1 1 0.36 0.022 +
0 60 -1 1 0.51 0.057 +++
8 0 0 -1.414 0.34 0.051 +++
8 0 0 -1.414 0.47 0.048 +++
8 0 0 -1.414 0.50 0.051 +++
8 30 0 0 0.42 0.017 +
8 30 0 0 0.42 0.038 ++
8 30 0 0 0.41 0.028 ++
8 60 0 1 0.42 0.021 +
8 60 0 1 0.44 0.035 ++
8 60 0 1 0.42 0.035 ++
16 0 1 -1 0.25 0.037 ++
16 0 1 -1 0.35 0.054 +++
16 0 1 -1 0.43 0.025 ++
16 30 1 0 0.43 0.030 ++
16 30 1 0 0.46 0.044 ++
16 30 1 0 0.46 0.027 ++
16 60 1 1 0.09 0.019 +
16 60 1 1 0.12 0.020 +
16 60 1 1 0.43 0.011 +
From the yellow dot in Fig 2, it can be seen that even though the mg Pb adsorbed/g straw is maximum, the absorbance is not satisfactorily (absorbance around 0.05-0.06). The color was still yellowish (pale yellow - turbid yellow, see Table 3).
Remarks of table 4: += absorbance 0.000-0.022:
clear solution ++= absorbance 0.023-0.045:
pale yellow
+++= absorbance 0.046-0.068: turbid yellow
1) Anova
Anova factorial statistical analyses:
H0 = there is no significant different between the results of different treatments
H1 = at least there is one significant different between different treatments.
Conclusion = H0 is accepted
General Linear Model: Mg Pb adsorbed vs Amount of Enzyme, Incubation time Factor Type Levels Values
Amount of enzyme fixed 3 0, 8, 16 Incubation time fixed 3 0, 30, 60
Analysis of Variance for mg Pb adsorbed/g straw, using Adjusted SS for Tests
Source DF Seq SS Adj SS Adj MS F P Amount of Enzyme 2 0.038807 0.038807 0.019404 2.08 0.154 Incubation time 2 0.047652 0.047652 0.023826 2.55 0.106 Amount of Enzyme*Inc time 4 0.121304 0.121304 0.030326 3.25 0.036* Error 18 0.167867 0.167867 0.009326
Total 26 0.375630 S = 0.0965708 R-Sq = 55.31% R-Sq(adj) = 35.45%
From the results of the statistical analyses above, it was found that there was an interaction between the amount of enzyme and incubation time, which can be seen by the valueof P= 0.036* where there is an interaction when the value of P<0.05.
InteractionPlot (data means) of the Amount of Enzyme and Incubation Time vs Absorbance in the Release of Lignin Experiments and of mg Pb(II) adsorbed/g straw
Fig 3.InteractionPlot of the Amount of Enzyme and Incubation Time vs Absorbance in
the Release of Lignin Experiments
Fig. 4. Interaction Plot of the Amount of Enzyme and Incubation Time vs mg Pb adsorbed /g straw
incubation time
M
e
a
n
60 30
0 0.50
0.45
0.40
0.35
0.30
0.25
0.20
amount
16 of enzy me 0 8 Interaction Plot (data means) for mg Pb adsorbed/g straw
Incubation time
M
e
a
n
60 30
0 0,6
0,5
0,4
0,3
0,2
0,1
0,0
Amount
16 of enzyme 0 8
Interaction Plot (data means) for Absorbance
Fig 3 showed that the adding of enzyme
contribute significantly toward the absorbance of the filtrate. And also the incubation time as well, the longer the incubation time, the higher the absorbance of the filtrate.
Fig 4 showed the relations between the release of
Conclusion
It can be concluded that at zero enzyme and 1 hour incubation time, the mg Pb(II) adsorbed is optimum i.e. 0,63 mg/g straw, but the color of the filtrate is still pale yellow to turbid yellow.
Because of the limitation of the statistical analyses, the result is also cannot be 100% reliable. In this study, the mg of Pb adsorbed/g straw obtained in the repetition/replication were fluctuated, this might due to the possible in-homogenous of the straw, so that it could not be determined whether the lignin and cellulose content in all the straw sample was homogenous. It is advisable that in the future study to use more samples, and then to choose a lower coefficient of variance (CV), or to apply another program of statistical analyses which can compare the interaction of less homogenous inter variabl
e.
The activity and mechanism of lignin on the adsorption of heavy metals is also important to explore.Acknowledgement
The researchers would like to express their gratitude to The Research Institute and the Faculty of Pharmacy of The University of Surabaya for their financial and laboratory support, to the Faculty of Science and Technology, the University of Airlangga, for providing the enzyme and the sharing of expertise, also to the Faculty of Pharmacy (especially Prof. Dr. Rokus A. de Zeeuw) and Department of Engineering, the University of Groningen, Holland, for the contribution in initiating the research and the cooperation up till now; also to all the students who participated in these researches.
References
1) Sutomo. A. H.. Sarwono. R. D.. Helmi. A. F.. et al. (2001) Lead Environmental Impact to the Growth of Yogyakarta City Children in Year 2000. Mediagama. III(3), 12. (in Indonesian).
2) Yuliandari. E..Triwijati. E..Suhardono. E. (2000.) Hakiki. II(3), 54. (in Indonesian).
3) Kohar. I.. Robert. M..Churlaud. C.. and Kalombo. M.(2007 Heavy Metals: Cd. Pb and Hg in Autistic Children.
Proceeding of International Conference Improving The
Quality of Human Life: Multidisciplinary Approach on Strategic Relevance for Urban Issues. JW Marriott Hotel. Surabaya, 160 – 166.
4) Friedman. M.. and Waiss. A.C. Jr. (1972) Mercury Uptake by Selected Agricultural Products and By-Products. Environ. Scie. And Technol.. 6(5), 457.
5) Kumar. P.. and Dara. S.S. (1980) Removal of Toxic Heavy Metal Ions from Wastewater Using Modified Agricultural Waste Materials.Prog.Water Tech.. 13, 353.
6) Larsen. V.J. Schierup. H.H. (1981) The Use of Straw for Removal of Heavy Metals from Waste Water. .J. Environ. Qual. ,10(2), 188.
7) Suemitsu. R..Uenishi. R.. Akashi. I.. Nakano. M. (1986) The Use of Dyestuff-treated Rice Hulls for Removal of Heavy Metals from Waste Wate. J. Appl. Polymer Sci., 31, 75. 8) Marshall. W.E...Champagne. E.T . Evans. (1995) W.J.
Agricultural Byproducts as Adsorbents For Metal Ions in Laboratory Prepared Solutions and In Manufacturing Wastewater. J.Environ. Sci. Health, A30 (2), 241.
9) Gardea-Torresdey. J.L.. Hernandez. A ...Tiemann. K.J. Bibb. J. . Rodriguez. O. (1998)Adsorption of Toxic Metal Ions From Solution by Inactivated Cells of Lareatridentata
(Creosote Bush). J. of Hazardous Substance Research,. 1, 3.1.
10) Kohar. I..Soediman. S..Lystiawati. Yenny. (2002) Elimination of Cadmium and Lead Mixture in Solution By Pretreated Rice Straw and Husk.Unitas (University of Surabaya Research Centre Scientific Bulletin), 10.(2), 61 – 70.
11) Tarley, C.R.T. and Arruda, M.A.Z. (2004) Biosorption of heavy metals using rice milling by-products.Characterization and application for removal ofmetals from aqueous effluents. Chemosphere, 54, 987–995.
12) Kohar. I.,Fransiscus. Y., Lamano,L., Johan, S. (2007) Adsorption of Cd(II) and Pb(II) by Agricultural Waste.
Purifikasi.,.8(2), 103-108.
13) SoediatmokoSoediman, danIndrajatiKohar. (2011) Adsorption of Heavy Metals Pb, Cd, Hg, Ag, Fe, and Zn from Solution by Rice Straw, Purifikasi, 12(3) , 9 – 16. 14) Kohar, I, Janssen, L.P.B.M., de Zeeuw, R.A. and Tideman, J.
(2012) Particle Size Experiments On The Adsorption of Pb(II) From Polluted Water By Rice Straw, Artocarpus, 9 (1), 29 – 34.
(15) SuestiWidianingrum.(2007) Adsorption of Pb(II) in sample solution using rice straw (Oryza sativa L.) and the clearing of the filtrate’s color. Skripsi. FakultasFarmasi. Universitas Surabaya. 2007.
16) Kohar. I..Soediatmoko S.. Ni NyomanTripuspaningsih (2009) Trial on The Elimination of The Brown Colour of
Straw’s Extract. data unpublished.
17) Soediman, R., Mario, Debby Vinolia, Ni Nyoman Tri Puspaningsih, Anita Kurbiati, Leon Janssen, 2013. Screening variables in the Reducing the Brown Color from the filtrate of Heavy Metal’s Elimination, Artocarpus, (in press). 18) Montgomery, D.C., 2001, Design and Analysis of
Experiments, 5th Ed., Wiley & Son Inc., New York, 427-441. 19). Zhang S, Guo X, Shan X, 2008, Adsorption of Metal Ions on