Effect of NDF/undegradable crude protein ratio on in vivo
digestibility, particle passage rate in riverine buffaloes
compared with sheep
S. Bartocci *, S. Terramoccia
C.R.A.–Istituto Sperimentale per la Zootecnia, 00016 Monterotondo (Rome), Italy
Received 19 October 2005; received in revised form 28 February 2006; accepted 7 March 2006
Abstract
In vivo digestibility (eight animals) and solid particles passage rate measured by faecal Cr (four animals fistulated at the rumen) were determined on riverine buffalo bulls and Delle Langhe rams, given four diets at maintenance level (50 g/kg M0.75 per day of dry matter), according to a Latin square design, composed of a factorial combination of high and low NDF and of high and low protein undegradability. The diets were: L-30 = low NDF (530.0 g/kg DM), low undegradability of protein (29.6%, CP= 138.0 g/kg DM); L-40 = low NDF (537.0 g/kg DM), high undegradability of protein (41.0%, CP= 139.0 g/kg DM); H-30 = high NDF (583.0 g/kg DM), low undegradability of protein (28.3%, CP= 128.0 g/kg DM); H-40 = high NDF (NDF = 580.0 g/kg DM), high undegradability of protein (40.0%, CP= 128.0 g/kg DM). The digestibility of organic matter (66.68% vs. 64.32%,Pb0.05) and of the other analytical fractions (NSC, NDF, cellulose and hemicelluloses) was significantly higher in buffaloes with the exception of that of crude protein which was similar for the two species. Considering the diets within the species, the increased undegradable protein in the small intestine produces different effects: in the buffalo, it does not positively influence the digestibility of NSC but does increase that of cellulose, on the other hand in sheep it influences the digestibility of NSC. The post-ruminal digestibility of the undegraded protein, both in buffalo and sheep, is higher than that from protein of microbial origin. The passage rate of the marker of the solid particles, through the first compartment,k1(2.86% h1
and 2.54% h1for the buffalo and the sheep) and through the entire intestinal tract, MRT (57.50 and 58.88 h for the buffalo and
the sheep) does not show significant differences in the two species. The passage rate of the marker of the solid particles in buffalo rumen, at variance with the structural carbohydrates of the diet, is more variable compared with that of the sheep.
D2006 Elsevier B.V. All rights reserved.
Keywords:Buffalo; Sheep; NDF/UDP ratio; Digestibility; Particle passage rate
1. Introduction
The efficiency of synthesis of microbial proteins and the percentage of protein digested at the intestinal
1871-1413/$ - see front matterD2006 Elsevier B.V. All rights reserved. doi:10.1016/j.livsci.2006.03.002
* Corresponding author. Tel.: +39 6 900901; fax: +39 6 9061541. E-mail address:settimio.bartocci@isz.it(S. Bartocci).
level are fundamental to the efficacy of the nitrogen in the diet and are the determining factors in recent protein evaluation systems (NRC, 1985; INRA, 1988; AFRC, 1993; Tamminga et al., 1994; Kirchgessner, 1997). However, progress in the development of these systems has had a continued focus on the species of major zootechnical interest, bovines. Indeed in the buffalo species not only is the role played by microbial proteins not sufficiently recognized (Di
Lella, 1998) but the optimal protein level to be
employed in the diet of lactating buffaloes has still to be defined (Verna et al., 1994; Campanile, 1998;
Bartocci et al., 2006). References can be found in
literature to disparities between buffaloes and cattle in urea–N metabolism (Dhiman and Arora, 1987;
Ken-nedy et al., 1992b; Liang and Young, 1995). The
buffalo retains ingesta longer in the rumen and for a shorter time in the gut than cattle (Bartocci et al., 1997) and in this way has an enhanced capacity to degrade both the crude protein and the protein-free dry matter (Terramoccia et al., 2000). A higher level of ammonia was found in the rumen of the buffalo by
Sangwan et al. (1990), Kennedy et al. (1992a) and
Bittante et al. (1994). Puppo et al. (2002) found a
higher capacity for microbial synthesis in the rumen with a greater ability to recycle urea from the blood to the rumen in buffalo with respect to cows, it was found that cows had a better potential for digestion in the post-ruminal tract. These characteristics result in the fact, as already asserted byDi Lella et al. (1995)
that the percentage of crude protein of foodstuff origin (21 different feeds), in buffalo compared with sheep, at maintenance level, that escapes fermentation in the rumen and becomes absorbed at the intestinal level, is limited.
Taniguchi et al. (1993) have shown that in sheep
the digestibility of starch increases with the increment of protein digested in the small intestine; Bruckental
et al. (2002)sustain the opinion that more protein in
the small intestine enables a higher secretion from the pancreas of the enzymes responsible for the digestion of starch.
One factor that can modify the digestion of the nutrients is the residence time of the food in the gastrointestinal tract and among the factors that modify the passage rate of foodstuffs are the animal species (Milne et al., 1978; Colucci et al., 1990;
Bartocci et al., 1997).
The aim of this present study was to establish in the buffalo species, in comparison with sheep, the effect of four diets composed of a combination of two levels of NDF with two levels of undegradable crude protein: 1) on the digestibility in vivo of the nutrients, particularly non-structural carbohydrates, 2) on the passage rate of solid particles.
2. Materials and methods
2.1. Animals and diets
The experiment was carried out on eight riverine buffalo (Bubalus bubalis L.) bulls, 2 years of age (101.6F5.8 kg M0.75) and eight adult Delle Langhe rams (23.6F1.6 kg M0.75). Four animals of each species were fitted with soft silicone ruminal cannulas (10 cm internal diameter for buffalo, 4 cm internal diameter for rams; Bar Diamond, Parma, ID, USA). This experiment was performed in conformity with the Italian laws and regulations on experimental animals. Adequate procedures to minimize pain and discomfort were adopted during the operative and post-operative periods and an interval of 2 months intervened between surgery and the start of the trial.
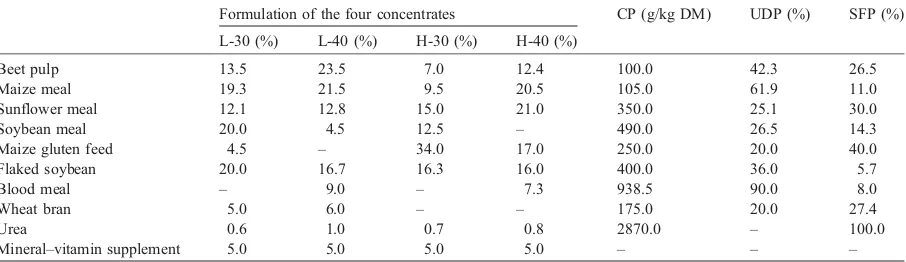
concentrates were: beet pulp, maize meal, sunflower meal, soybean meal, maize gluten feed, flaked soybean, blood meal, wheat bran, urea, mineral– vitamin supplements. In Table 1, in addition to the formulation of the four concentrates, the crude protein and the undegradable and soluble fraction of protein of each simple feedstuff utilized are reported. The data related to the protein undegradability and solubility of the foods utilized have been provided by the Istituto di Zootecnica, Faculty of Agriculture of the Catholic University of Piacenza (Italy).
2.2. In vivo digestibility
All the animals were housed indoors in individual pens (1.42.2 m2for buffaloes, 0.71.2 m2for rams). The foodstuffs were administered twice a day at 08:00 and 16:00 h in quantities of 50 g DM per day per kg M0.75. The animals remained in the individual pens for four periods of 21 days. Each period was divided into two subperiods: a first phase of 14 days where the animals adapted to the diet and a subsequent phase of 7 days for complete faeces collection.
2.3. Marker administration and sample collection
After the adaptation period, rumen-cannulated animals received the marker in single doses, through the rumen cannula. At the end of the morning meal of the first day of each period when faeces were collected
(Pond et al., 1988; Leonard et al., 1989), buffaloes and
rams received 300 and 75 g, respectively, of wheat straw mordanted with Na2Cr2O7according toUde´n et
al. (1980). Grab samples of faeces were collected from
the rectum at 0, 4, 6, 8, 10, 12, 14, 16, 18, 20, 22, 24, 26, 28, 34, 40, 44, 48, 54, 60, 68, 80, 92, 104, 116, 128, 140 and 152 h post dosing.
2.4. Passage rate of solids (Cr faecal excretion)
The faecal excretion curves of the marker were defined using a multicompartmental model (Dhanoa et al., 1985) for solid particles (Cr); the criteria for the selection and choice of the model adopted in this paper has been described in a previous paper (Amici et al., 1997).
2.5. Chemical analysis
Food samples were submitted to the following chemical analyses: dry matter (DM), crude protein (CP), crude fibre (CF), ether extract (EE), ash, neutral-detergent fibre (NDF), acid-neutral-detergent fibre (ADF), acid-detergent lignin (ADL). These constituents for the four diets were calculated proportionally from the respective composition of the component foodstuffs. Faeces samples were submitted to DM, CP, EE, ash, NDF, ADF and ADL analyses. All the analyses were performed according to the methods of the Associa-tion of Official Analytical Chemists (AOAC, 1995),
Goering and Van Soest (1970) for cell wall
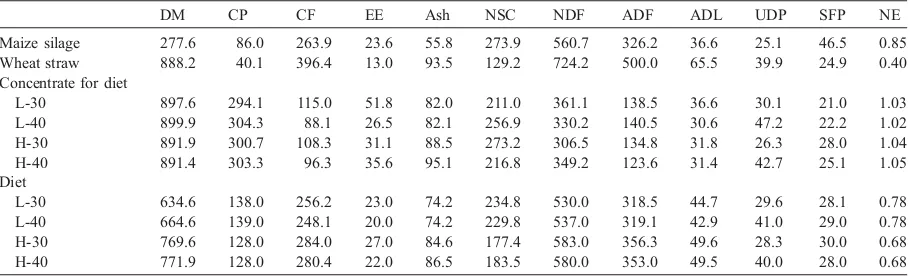
constit-uents and Van Soest et al. (1991) for non-structural carbohydrates. Table 2 illustrates the chemical com-position, the share of degradable and soluble protein, and the nutritive value of the foods and of the four diets utilized; using the chemical composition and
Table 1
Formulation of the four concentrates, crude protein, undegradable dietary protein and soluble fraction of protein of the feedstuffs used
Formulation of the four concentrates CP (g/kg DM) UDP (%) SFP (%)
L-30 (%) L-40 (%) H-30 (%) H-40 (%)
Beet pulp 13.5 23.5 7.0 12.4 100.0 42.3 26.5
Maize meal 19.3 21.5 9.5 20.5 105.0 61.9 11.0
Sunflower meal 12.1 12.8 15.0 21.0 350.0 25.1 30.0
Soybean meal 20.0 4.5 12.5 – 490.0 26.5 14.3
Maize gluten feed 4.5 – 34.0 17.0 250.0 20.0 40.0
Flaked soybean 20.0 16.7 16.3 16.0 400.0 36.0 5.7
Blood meal – 9.0 – 7.3 938.5 90.0 8.0
Wheat bran 5.0 6.0 – – 175.0 20.0 27.4
Urea 0.6 1.0 0.7 0.8 2870.0 – 100.0
Mineral–vitamin supplement 5.0 5.0 5.0 5.0 – – –
organic matter digestibility, the net energy was calculated as Milk FU (INRA, 1988).
Grab samples of faeces were dried and, after mineralization at 450 8C, were solubilized and analysed for Cr by Atomic Absorption according to
Williams et al. (1962).
2.6. Statistical analysis
The data were analysed by the General Linear Model procedure (SAS, 1993) according to a split-plot arrangement which included species, diet, repli-cation, interaction replicationspecies and spe-ciesdiet, using the following model:
Yijkl¼lþqiþajþcjiþbkþðabÞjkþeijkl
where:l= general mean;qi= replication (i= 1, . . ., 4);
aj= species (j= 1, 2); cji= interaction replication species; bk= diet (k= 1, . . ., 4); (ab)jk= interaction speciesdiet; eijkl= error of model. The REG/SAS procedure has been utilized to obtain the linear regression equations between apparent digestibility of the organic matter and the coefficients k1,k2 and
the MRT of the multicompartmental model.
3. Results and discussion
3.1. Apparent digestibility in relation to the NDF/ undegradable protein level
Table 3 illustrates the apparent digestibility
coef-ficients of the nutrients of the four diets by the two species. The digestibility of the analysed constituents
Table 3
Apparent digestibility coefficients (%) of organic matter (OM), crude protein (CP), non-structural carbohydrates (NSC), neutral detergent fibre (NDF), cellulose and hemicelluloses in buffaloes and sheep given four different diets
Buffalo Sheep Buffalo Sheep Effects RMSE
L-30 L-40 H-30 H-40 L-30 L-40 H-30 H-40 Species Diet Species Diet
OM a66.68 b64.32 a68.48a a68.78a 64.65b 64.80b b65.96a b65.68a 62.59b 63.06b * * NS 2.2511 CP 69.05 68.70 70.26a,b 70.75a 67.10c 68.08b,c 70.13a,b 70.38a 66.56c 67.76b,c NS * NS 2.4574 NSC a87.95 b85.18 a90.59a 89.46a 85.95b 85.81b b86.16a,b 87.62a 83.16b 83.77b * * NS 3.0939 NDF a57.11 b53.79 57.32 a58.32 56.28 a56.53 54.04 b54.58 53.39 b53.13 * NS NS 3.3009 Cellulose a53.99 b51.46 55.24a,b 56.08a 51.86b 52.80a,b 52.48 52.70 51.20 49.48 * NS NS 3.9225 Hemicellulloses a76.06 b68.08 a75.07 a76.20 a77.00 a76.00 b68.53 b68.72 b67.11 b67.98 * NS NS 4.0449
a, b, c,
*Pb0.05; NS: not significant.
Means in the same row preceded by different superscripts are significantly different between species or for interaction speciesdiet. Table 2
Chemical composition, undegradable dietary protein, soluble fraction of protein, net energyaof the foodstuffs and of the four experimental diets
DM CP CF EE Ash NSC NDF ADF ADL UDP SFP NE
Maize silage 277.6 86.0 263.9 23.6 55.8 273.9 560.7 326.2 36.6 25.1 46.5 0.85 Wheat straw 888.2 40.1 396.4 13.0 93.5 129.2 724.2 500.0 65.5 39.9 24.9 0.40 Concentrate for diet
L-30 897.6 294.1 115.0 51.8 82.0 211.0 361.1 138.5 36.6 30.1 21.0 1.03 L-40 899.9 304.3 88.1 26.5 82.1 256.9 330.2 140.5 30.6 47.2 22.2 1.02 H-30 891.9 300.7 108.3 31.1 88.5 273.2 306.5 134.8 31.8 26.3 28.0 1.04 H-40 891.4 303.3 96.3 35.6 95.1 216.8 349.2 123.6 31.4 42.7 25.1 1.05 Diet
L-30 634.6 138.0 256.2 23.0 74.2 234.8 530.0 318.5 44.7 29.6 28.1 0.78 L-40 664.6 139.0 248.1 20.0 74.2 229.8 537.0 319.1 42.9 41.0 29.0 0.78 H-30 769.6 128.0 284.0 27.0 84.6 177.4 583.0 356.3 49.6 28.3 30.0 0.68 H-40 771.9 128.0 280.4 22.0 86.5 183.5 580.0 353.0 49.5 40.0 28.0 0.68
aDry matter (DM) content, concentration (g/kg DM) of crude protein (CP), crude fibre (CF), ether extract (EE), ash, non-structural
under study was significantly higher in buffaloes with the exception of that of crude protein which was similar for the two species. Another point to be highlighted is the superior ability of the buffalo in the digestibility of non-structural carbohydrates (87.95% vs. 85.18%, Pb0.05) and of NDF (57.11% vs. 53.79%, Pb0.05) as already ascertained, for NDF,
byBartocci and Di Lella (1994)and byDi Francia et
al. (2000). These results derive from a better
digestibility both of cellulose (53.99% vs. 51.46%, Pb0.05) and hemicelluloses (76.06% vs. 68.08%, Pb0.05).
Considering the diets within the species, one notes a significant difference in the digestibility of the organic matter between the two diets with high and low energy levels (68.48%, 68.78% vs. 64.65%, 64.80%, Pb0.05 for buffaloes; 65.96%, 65.68% vs. 62.59%, 63.06%,Pb0.05 for sheep). With regard to the crude protein digestibility both the buffalo and the sheep show the same trend with a significant difference between the diet L-40 and the diets H-40 and H-30 (70.75% vs. 68.08%, 67.10% and 70.38% vs. 67.76%, 66.56%, Pb0.05, respectively, for buffalo and sheep). The increase in the apparent digestibility of CP in the diets L-40 and H-40 as compared to diets L-30 and H-30, in both species, could result from the higher level of undegraded protein used in these diets. These figures indicate that the post-ruminal digestibility of the undegraded protein, both in buffalo and sheep, is higher than that from protein of microbial origin as had already been indicated by Bruckental et al. (2002) for the dairy cow; however these latter Authors, with a different species and under different physiological condition, obtained a digestibility of the microbial protein inferior to ours. Moving on to examine the nitrogen balance, for the buffalo species the difference in digestible protein between the average of the diets H-40 + L-H-40 vs. H-30 + L-30 is 5.00 g/day, equal to a saving of 50.14 g/head/day of dry matter; while for the sheep, using the same procedure, one obtains a difference of 1.65 g/day of digestible protein, equal to a saving of 12.50 g/head/day of dry matter. The digestibility of non-structural carbohydrates, in the buffalo, presents a significant difference between the two diets at the high and low energy level (90.59%, 89.46% vs. 85.95%, 85.81%,Pb0.05) whilst in sheep there is a significant difference only between diet L-40
and the diets H-30 and H-40 (87.62% vs. 83.16%, 83.77%,Pb0.05). For sheep there is a 1.46% increase in the digestibility of the NSC between the diets L-40 and L-30; Bruckental et al. (2002) in lactating cow using diets with 41% and 46% UDP found, with respect to the diet with 36% UDP, an increase in digestibility of the total non-structural carbohydrates (TNC) of 2.0% and 2.4%. Therefore while the presence in the diet of the buffalo of 30% or 40% of UDP does not appear to alter the digestibility of non-structural carbohydrates, on the contrary in sheep there is a positive effect with the diet L-40 with 41% of UDP, and also to a more limited degree with the diet H-40 (+ 0.61%). This result could support what has been asserted byTaniguchi et al. (1993) that the digestibility of starch in the small intestine of sheep can increase with a rise in the quantity of UDP. In addition, Shabi et al. (1999)detected in dairy cows a correlation between the increase of post-ruminal TNC digestibility and the post-ruminal flow of UDP. According to Huntington (1997) and Bruckental et
al. (2002), this phenomenon could result from an
intensified secretion from the pancreas of all the digestive enzymes, including those responsible for the intestinal digestion of starch. In the sheep, the apparent digestibility of crude protein and of non-structural carbohydrates, as found also in lactating cows by Bruckental et al. (2002), is enhanced by the increased availability of undegradable protein while in the buffalo the positive effect is limited to the protein digestibility. No diet effect is noticeable in either species on the digestibility of NDF, of the hemi-celluloses and, only for sheep, of the cellulose; in buffaloes, cellulose digestibility varies significantly between the diets L-40 and H-30 (56.08% vs. 51.86%, Pb0.05) with intermediate values from the other two diets. Consequently, in the buffalo, compared to sheep, there appears to be a positive effect of 41% of UDP in the digestibility of cellulose. From the results of this study one could surmise that the increase of undegradable protein in the small intestine produces different effects: in the buffalo it does not positively influence the digestibility of NSC but that of cellulose, on the other hand in sheep it influences the digestibility of NSC.
higher energy content. In addition, the digestibility of NDF is also higher for the buffalo but significantly so only with the diets with the highest UDP content (58.32%, 56.63% vs. 54.58%, 53.13%,Pb0.05). No difference was observed in the digestibility either of protein or of cellulose; on the other hand, the digestibility of hemicelluloses is statistically always higher for the buffalo. The digestibility of the NSC, tended to be higher in buffalo for all diets, but reached a significant level only with the diet L-30 (90.59% vs. 86.16%,Pb0.05).
3.2. Passage rate of solid particles in relation to the NDF/undegradable protein level
The passage rate of the marker of the solid particles,k1, through the first compartment (Table 4)
does not show significant differences in the two species (2.86% h1 and 2.54% h1 for the buffalo and the sheep). AlsoBartocci et al. (1997)did not find significant differences between the k1 of the buffalo
and the sheep (2.46% h1and 2.84% h1) whileDi Francia et al. (1997), utilizing a different feeding level and mathematical model with a ratio forage/concen-trate of 80 : 20, found a significantly lower value in the buffalo (2.28% h1 vs. 3.31% h1, Pb0.01). Our values ofk1in sheep correspond with those obtained
at the maintenance level, with similar diets, by
Colucci et al. (1990), Ramanzin et al. (1990) and
Carro et al. (2000). Considering the passage rate of the
marker of solid particles,k2, in the second
compart-ment (10.59% h1 and 11.56% h1 for the buffalo
and the sheep), the time delay, s (9.30 and 10.36 h) and the mean retention time, MRT (57.50 and 58.88 h) no significant difference was detected between the two species. These results are confirmed by the work
ofBartocci et al. (1997)except fors(6.98 vs. 12.79 h,
Pb0.05, buffalo vs. sheep); however, the order of magnitude of the parameter for the two species is similar in the two studies. The MRT value for the sheep is similar to that reported by Ramanzin et al.
(1990)andCarro et al. (2000), that for the buffalo by
Kennedy et al. (1992a). From the results obtained it
can be concluded that the passage rate, which is similar in the two species, does not influence the differences encountered in the apparent digestibility but that other factors are involved. Bittante et al.
(1994), in a study on cows, buffaloes and sheep, with
diets similar to those used by us with regard to NDF and protein level, discovered, in the buffalo rumen compared with that of sheep, an ammoniacal nitrogen and total free fatty acids level significantly lower and a pH significantly higher. As a result of this, the rumen of sheep has a lower buffer capacity which can lead to a considerable accumulation of ammoniacal nitrogen. With regard to the percentage of free fatty acids the buffalo displays an intermediate perfor-mance between that of the cow (more acetic acid) and that of the sheep.
Taking into account the diets within the species, the buffalo displays a greater range ofk1with respect
to the sheep. In buffalo there is a significant difference between thek1in the diet L-30 and that of the diets
H-30 and H-40 (2.10% h1vs. 3.21% h1, 3.44% h1,
Table 4
Effect of animal species and speciesdiet on excretion patterns of solid marker (Cr) in faeces (multicompartmental model)
Buffalo Sheep Buffalo Sheep Effects RMSE
L-30 L-40 H-30 H-40 L-30 L-40 H-30 H-40 Species Diet Species Diet
k1 2.86 2.54 2.10
b
2.70a,b 3.21a 3.44a 2.62 2.48 2.50 2.55 NS NS NS 0.6862 k2 10.59 11.56 11.42 10.92
b
9.59 10.43 10.74a,b 10.18b a13.66a 11.65a,b NS NS NS 2.2128
s 9.30 10.36 6.08 8.53 10.94 11.66 11.82 10.04 10.15 9.43 NS NS NS 4.3353 MRT 57.50 58.88 62.63a 58.90a,b 55.23a,b 53.25b 59.83 60.39 57.88 57.43 NS NS NS 5.3626
a, b
Pb0.05; NS: not significant. k1(% h
1
) = passage rate of marker from the 1st compartment (reticulo-rumen). k2(% h1) = passage rate of marker from the 2nd compartment (caecum-proximal colon). s(h) = time delay between marker administration and its first appearance in the faeces. MRT = mean retention time (h) in the gastrointestinal tract.
Means in the same row followed by different superscripts are significantly different within each species.
Pb0.05) also in this instance, as already found by
Bartocci et al. (1997), with an increase of fibre in the
diet, there is a corresponding increase in the level of k1; in sheep, on the contrary, a similar trend was not
evident. These results could indicate a different ability to ruminate the particles but require further confirma-tion through other experiments. Regarding s, no significant differences between diets were noted in the buffalo or in sheep. However fork2, only in sheep,
there was a significant difference between diets H-30 and L-40 (13.66% h1vs. 10.18% h1,Pb0.05) but the difference of 2.5 h had a limited effect on the MRT. The mean retention time in the buffalo revealed a significant difference between diets L-30 and H-40 (62.63 vs. 53.25 h,Pb0.05) while the MRT in diet
H-30 was different (P= 0.07) from that of diet L-30. Therefore it can be asserted that for MRT there is a trend similar to that of 1/k1, a parameter that has a
considerable influence on the calculation of the MRT. In sheep, there is a similar progression for the MRT, with no significant difference, with a less marked range between 60.39 and 57.43 h.Carro et al. (2000)
with diets with a forage/concentrate ratio of 80 : 20 and 60 : 40, at maintenance level, in sheep obtained values of MRT equal to 62.4 and 53.1 h. The results of the present study confirm, in both species, that an inverse relationship exists between the NDF of the diet and mean retention time (r=0.93,P= 0.07 for buffalo; r=0.95, Pb0.05 for sheep) as already
observed byLeaver et al. (1969)and byRamanzin et
al. (1990) for sheep and by Bartocci et al.
(unpub-lished data) both in buffalo (r=0.96,Pb0.05) and sheep (r=0.98, Pb0.05). In addition, from the
regression equations reported in Table 5, the best assessment of the digestibility of organic matter, in both the species, is in relation to the MRT but significantly only in sheep (r= 0.95,P= 0.05).
Comparing the two species within the diet (Table 4), there is no evidence of any significant difference for any of the parameters under examination, with the exception ofk2of diet H-30.
4. Conclusions
The buffalo demonstrated a better and significant digestibility of the organic matter, structural and non-structural carbohydrates while that of crude protein is similar in the two species. The presence of 40% of UDP appears to determine a positive effect in sheep with regard to the apparent digestibility of non-structural carbohydrates while in buffalo there appears to be a positive effect on the apparent digestibility of cellulose. The post-ruminal digestibility of the unde-graded protein, both in buffalo and sheep, is higher than that for protein of microbial origin. The buffalo retains the solid particles in the rumen and the entire intestinal tract for the same amount of time as the sheep, but when there is a variation of the structural carbohydrates in the diet, the retention time of solid particles in the rumen of the buffalo is more variable than that of sheep.
References
AFRC, 1993. Energy and protein requirements of ruminants. Advisory Manual Proposed By the AFRC Technical Committee On Responses to Nutrients. CAB International, Wellingford, p. 159. Amici, A., Bartocci, S., Terramoccia, S., Martillotti, F., 1997. Passage rate of solids and fluids in the digestive tract of buffaloes, cattle and sheep: selection of non-linear model. Anim. Sci. 64, 63 – 69.
AOAC, 1995. Official Methods of Analysis, 16th ed. Association of Official Analytical Chemists, Washington, DC.
Bartocci, S., Di Lella, T., 1994. Capacita` di utilizzazione digestiva degli alimenti. Agric. Ric. 153, 49 – 56.
Bartocci, S., Amici, A., Verna, M., Terramoccia, S., Martillotti, F., 1997. Solid and fluid passage rate in buffalo, cattle and sheep fed diets with different forage to concentrate ratios. Livest. Prod. Sci. 52, 201 – 208.
Bartocci, S., Terramoccia, S., Tripaldi, C., 2006. The utilisation of a high level energy/protein diet for lactating Mediterranean buffaloes: intake capacity and the effects on quanti-qualitative parameters. Livest. Prod. Sci. 99, 211 – 219.
Table 5
Linear regression equations between apparent digestibility of the organic matter (Y) and the coefficients k1, k2 and MRT of the
multicompartmental model (X)
Bittante, G., Ramanzin, M., Bailoni, L., Simonetto, A., Bartocci, S., 1994. Confronto fra alcuni parametri ruminali di bufalini, bovini e ovini alimentati con diete diverse. Agric. Ric. 153, 135 – 142. Bruckental, J., Abramson, S., Zumwell, S., Adin, G., Arieli, A., 2002. Effects of dietary undegradable crude protein level on total non-structural carbohydrate (TNC) digestibility, and milk yield and composition of dairy cows. Livest. Prod. Sci. 76, 71 – 79.
Campanile, G., 1998. Relationship between nutrition and reproduc-tion in buffalo. Bubalus Bubalis 1/98, 217 – 235 (Suppl.). Carro, M.D., Valde´s, C., Ranilla, M.J., Gonza´lez, J.S., 2000. Effect
of forage to concentrate ratio in the diet on ruminal fermentation and digesta flow kinetics in sheep offered food at a fixed and restricted level of intake. Anim. Sci. 70, 127 – 134.
Colucci, P.E., McLeod, G.K., Grovum, W.L., McMillan, I., Barney, D.J., 1990. Digesta kinetics in sheep and cattle fed diets with different forage to concentrate ratios at low and high intake. J. Dairy Sci. 73, 2143 – 2156.
Dhanoa, M.S., Siddons, R.C., France, J., Gale, D.L., 1985. A multicompartmental model to describe marker excretion patterns in ruminant faeces. Br. J. Nutr. 53, 663 – 671.
Dhiman, T.R., Arora, S.P., 1987. Kinetics of urea nitrogen in cattle and buffaloes fed optimum and suboptimum nitrogen containing diets. J. Nucl. Agric. Biol. 16, 86 – 91.
Di Francia, A., Masucci, F., Proto, V., 1997. Digeribilita` in vivo, transito dei solidi e degradabilita` in situ in ovini e bufali. Atti 128Congresso Nazionale ASPA, Pisa, Italy, pp. 43 – 44. Di Francia, A., Masucci, F., Infascelli, F., Gioffre`, F., Proto, V.,
2000. Digeribilita` in vivo e valore energetico in bufali e ovini: 6. Diete a base di paglia di frumento trattata e non con ammoniaca. Zootec. Nutr. Anim. 26, 211 – 217.
Di Lella, T., 1998. Buffalo nutrition. Bubalus Bubalis 1/98, 207 – 216 (Suppl.)
Di Lella, T., Infascelli, F., Cutrignelli, M.I., 1995. Rumen degradability and proteic value of feed utilized by buffaloes. Bubalus Bubalis 1/95, 38 – 48.
Goering, H.K., Van Soest, P.J., 1970. Forage and fibre analysis. USDA Agric. Handbook, vol. 379. USDA, Washington, DC, USA.
Huntington, G.B., 1997. Starch utilization by ruminants: from basics to the bunk. J. Anim. Sci. 75, 852 – 867.
INRA, 1988. In: Jarrige, R. (Ed.), Alimentation des Bovins, Ovins et Caprins. Institut National de la Recherche Agronomique, Paris.
Kennedy, P.M., Boniface, A.N., Liang, Z.J., Muller, D., Murray, R.M., 1992. Intake and digestion in swamp buffaloes and cattle: 2. The comparative response to urea supplements in animals fed tropical grasses. J. Agric. Sci., Camb. 119, 243 – 254. Kennedy, P.M., McSweeney, C.S., Ffoulkes, D., John, A., Schlink,
A.C., LeFeuvre, R.P., Kerr, J.D., 1992. Intake and digestion in swamp buffaloes and cattle: 1. The digestion of rice straw (Oryza sativa). J. Agric. Sci., Camb. 119, 227 – 242.
Kirchgessner, M., 1997. Tiererna¨hrung: Leitfaden fu¨r Studium. Beratung und Praxis. BLV-Verl.-Ges, Mu¨nchen, p. 582. Leaver, J.D., Campling, R.C., Holmes, W., 1969. The effect of level
of feeding on the digestibility of diets for sheep and cattle. Anim. Prod. 11, 11 – 18.
Leonard, E.S., Pond, K.R., Harvey, R.W., Crickenberger, R.G., 1989. Effect of corn grinding and time of corn feeding on growth, starch utilisation and digesta passage characteristics of growing steers fed hay-based diets. J. Anim. Sci. 67, 1603 – 1611.
Liang, J.B., Young, B.A., 1995. Comparative energetic efficiencies of male Malaysian cattle and buffalo. Livest. Prod. Sci. 41, 19 – 27.
Milne, I.A., McRae, J.C., Spence, A.M., Wilson, S., 1978. A comparison of the voluntary intake and digestion of a range of forages at different times of the year by the sheep and the red deer (Cervus clophus). Br. J. Nutr. 40, 347 – 357.
NRC, 1985. Ruminant Nitrogen Usage. National Academy of Science, Washington, DC.
Pond, K.R., Ellis, W.C., Matis, J.H., Ferreiro, H.M., Sutton, J.D., 1988. Compartment models for estimating attributes of digesta flow in cattle. Br. J. Nutr. 60, 571 – 595.
Puppo, S., Bartocci, S., Terramoccia, S., Grandoni, F., Amici, A., 2002. Rumen microbial counts and in vivo digestibility in buffaloes and cattle given different diets. Anim. Sci. 75, 323 – 329.
Ramanzin, M., Bailoni, L., Bittante, G., 1990. Effetto del rapporto foraggi : concentrati e del trattamento della paglia con ammo-niaca sulla cinetica di transito dei solidi e dei liquidi in ovini. Zootec. Nutr. Anim. 16, 245 – 254.
Sangwan, D.C., Pradhan, K., Bhatia, S.K., Sagar, V., Sadhana, S., 1990. Associative effect of wheat straw or oat hay with protein supplements on rumen metabolites and nutrient digestibility in cattle and buffalo. Indian J. Anim. Sci. 60, 472 – 479. SAS, 1993. SAS User’s Guide, Statistical Analysis Systems
Institute Inc., Cary, NC.
Shabi, Z., Bruckental, I., Zamwell, S., Tagari, H., Arieli, A., 1999. Effect of extrusion of grain and feeding frequency on rumen fermentation, nutrient digestibility and milk yield and compo-sition in dairy cows. J. Dairy Sci. 82, 1252 – 1260.
Tamminga, S., Van Straalem, W.M., Subnel, A.P.J., Meijer, R.G.M., Steg, A., Wever, C.J.G., Blok, M.C., 1994. The Dutch protein evaluation system: the DVE/OEB system. Livest. Prod. Sci. 40, 139 – 155.
Taniguchi, K., Sunada, Y., Obistu, T., 1993. Starch digestion in the small intestine of sheep sustained by intragastric infusion without protein supply. Anim. Sci. Technol. Jpn. 64, 892 – 902. Terramoccia, S., Bartocci, S., Amici, A., Martillotti, F., 2000. Protein and protein-free dry matter rumen degradability in buffalo, cattle and sheep fed diets with different forage to concentrate ratios. Livest. Prod. Sci. 65, 185 – 195.
Ude´n, P., Colucci, P.E., Van Soest, P.J., 1980. Investigation of chromium, cerium and cobalt as markers in digesta. Rate of passage studies. J. Sci. Food Agric. 31, 625 – 632.
Van Soest, P.J., Robertson, J.B., Lewis, B.A., 1991. Methods for dietary fiber, neutral detergent fiber and nonstarch polysacchar-ides in relation to animal nutrition. J. Dairy Sci. 74, 3583 – 3597. Verna, M., Bartocci, S., Amici, A., Agostini, M., 1994. Effect of different diets on productive performance of lactating buffaloes. Agric. Ric. 153, 73 – 78.