CHAPTER III METHODS
Chapter three of this study discusses the
population and sample involved in this study, the
measurement used in this study, data collections,
and the analysis technique.
A. Population and Sample Selection
The population of this study were all investors
in Danareksa Salatiga, PT. Trimegah Asset
Management. Due to the rules of both companies, the
convenient sampling was employed in this study to
obtain the data required, since it was difficult to meet
the investors directly. In fact, the data obtained from
those companies were only 25 respondents. Thus,
some investors from a group of individual investors
were asked to answer the questionnaires. Then, the
snowball samples were employed in this study. Some
individual investors already participating in this
study have acquaintances and they were asked the
acquaintances to answer the questionnaires. In
addition, the study had been done from July 15th
2013 until September 29th 2013. The total number of
were 76 and all questionnaires could be analyzed.
From those data, it could be presented the following
data about the respondents’ characteristics and the
[image:2.516.62.464.152.613.2]respondents’ information of stock investment.
Table 3.1
Respondents’ Characteristics
Characteristics Categories Number Percentage
Gender Male 58 76.3%
Female 18 23.7%
Age
20-29 years old 32 42.1%
30-39 years old 25 32.9%
40-49 years old 14 18.4%
>50 years old 5 6.6%
Marital Status Married 42 55.3%
Not Married 34 44.7%
Education
High School 15 19.7%
Diploma 8 10.5%
Undergraduate 39 51.3%
Postgraduate 14 18.4%
Employment
Civil Servants 11 14.5%
Private Employees 41 53.9%
Entrepreneurs 17 22.4%
Students 6 7.9%
Retirement 1 1.3%
Salary/year (Rp)
< 25 million 23 30.3%
> 25-50 million 7 9.2% >50-100 million 21 27.6% > 100-150 million 10 13.2% > 150- 250 million 11 14.5%
> 250 million 4 5.3%
The finding from the questionnaires showed
that mostly investors, 76.3% of all investors were
male. However, it did not mean that female were
interesting on stock investing because there were
23.7% of investors were female. In addition, it was
found that 6.6% of the investors were above 50 years
old, it meant that investment were not only for them
who were in the productive age. Interestingly, most of
the investors earned the salary less than or the same
as 25 million a years. It meant that stock investing
probably did not help them too much on increasing
their wealth. In addition, there were also some
additional information related to the investors, which
[image:3.516.63.487.98.629.2]was explained in the following table.
Table 3.2
Respondents’ Related Information of Stock Investment Respondents’
Information Categories Number Percentage
Year of starting
the Stock
Investment
≤ 2008 31 40.8%
≥ 2009 45 59.2%
Source of Stock
Investment
Information
Colleagues 49 64.5%
Investment Seminars'
Speaker 12 15.8%
Newspapers/magazine 6 7.9%
Respondents’
Information Categories Number Percentage
Daily Trading Yes 14 18.4%
No 62 81.6%
The Stock
Investment
Purpose
Short-Term Investment 18 23.7%
Long-Term Investment 47 61.8%
Both 11 14.5%
Source: Primary Data, 2013
The information was related to the source of
stock investment information, the frequency of
trading in this case doing daily trading, and the stock
investment’s purposes provided in the following table.
Most of the investors gained their first information
about stock investment were from their colleagues.
There were 64.5% of the investors. Interestingly, only
11.8% investors gained the information from the
internet. It meant that in stock investing, internet
might provide complete information but might not
provide ‘an interesting invitation’ for the new
investors. Furthermore, 81.6% investors did not do
daily trading. It was happened because probably the
investors’ investment purpose was for long-term
investment, which was supported by the result of the
questionnaire. 61.8% of investors invested on stock
B. Measurement
The study looked into the influence of
demographic features and psychological
characteristics towards stock preference by
constructing a questionnaire. The questionnaire was
divided into two sections. The first section (see the
appendix) was a questionnaire related to
demographic features and the big-five personality
questionnaire adopted from Mayfield, Perdue, and
Wooten (2008). It consisted of twelve questions
related to demographic features and eight questions
related to the big five personality model. The second
section was questionnaire on the stock preference
(see the appendix 1). This questionnaire was
developed based on the characteristics of value
stocks and growth stock explained in previous
chapter. There was eight questions related to stock
preference.
The Likert Scale was employed to the big five
personality questionnaire. The scale was divided into
five: disagree strongly with 1 point, disagree a little
with 2 point, neither agree nor disagree with 3 point,
agree a little with 4 point, and agree strongly with 5
point. The respondents are asked to give check () in
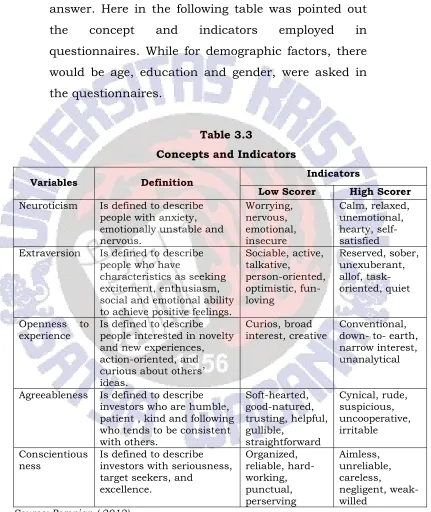
answer. Here in the following table was pointed out
the concept and indicators employed in
questionnaires. While for demographic factors, there
would be age, education and gender, were asked in
[image:6.516.64.495.112.624.2]the questionnaires.
Table 3.3
Concepts and Indicators
Variables Definition Indicators
Low Scorer High Scorer
Neuroticism Is defined to describe people with anxiety, emotionally unstable and nervous. Worrying, nervous, emotional, insecure Calm, relaxed, unemotional, hearty, self- satisfied Extraversion Is defined to describe
people who have
characteristics as seeking excitement, enthusiasm, social and emotional ability to achieve positive feelings.
Sociable, active, talkative, person-oriented, optimistic, fun-loving Reserved, sober, unexuberant, allof, task-oriented, quiet Openness to experience
Is defined to describe people interested in novelty and new experiences, action-oriented, and curious about others’ ideas.
Curios, broad interest, creative
Conventional, down- to- earth, narrow interest, unanalytical
Agreeableness Is defined to describe investors who are humble, patient , kind and following who tends to be consistent with others. Soft-hearted, good-natured, trusting, helpful, gullible, straightforward Cynical, rude, suspicious, uncooperative, irritable Conscientious ness
Is defined to describe investors with seriousness, target seekers, and
excellence. Organized, reliable, hard-working, punctual, perserving Aimless, unreliable, careless, negligent, weak-willed
After getting back the questionnaires, the
validity and reliability of the instruments were
measured. The result were shown in the following
tables:
Table 3.4
The Validity of the Instruments
Variables Indicators Counted r *
Big Five Personality
Neuroticism
X1 0.334
X2 0.350
X3 0.218
Extraversion
X4 0.290
X5 0.206
X6 0.309
Openness to Experience
X7 0.512
X8 0.240
X9 0.344
Agreeableness
X10 0.201
X11 0.503
X12 0.366
Conscientiousness
X13 0.297
X14 0.187*
X15 0.291
Stock Preference
Value Stock
Y1 0.679
Y2 0.597
Y4 0.437
Growth Stock
Y5 0.420
Y7 0.591
Y8 0.547
Source: Primary Data, 2013
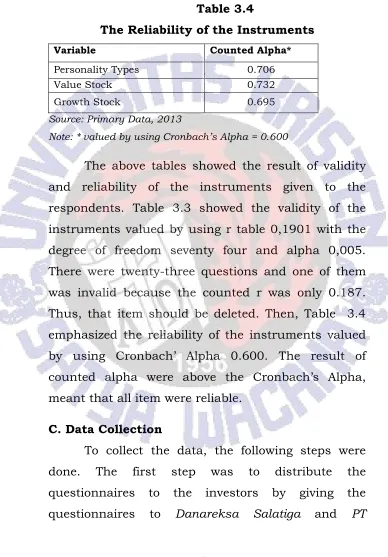
Table 3.4
The Reliability of the Instruments
Variable Counted Alpha*
Personality Types 0.706
Value Stock 0.732
Growth Stock 0.695
Source: Primary Data, 2013
Note: * valued by using Cronbach’s Alpha = 0.600
The above tables showed the result of validity
and reliability of the instruments given to the
respondents. Table 3.3 showed the validity of the
instruments valued by using r table 0,1901 with the
degree of freedom seventy four and alpha 0,005.
There were twenty-three questions and one of them
was invalid because the counted r was only 0.187.
Thus, that item should be deleted. Then, Table 3.4
emphasized the reliability of the instruments valued
by using Cronbach’ Alpha 0.600. The result of
counted alpha were above the Cronbach’s Alpha,
meant that all item were reliable.
C. Data Collection
To collect the data, the following steps were
done. The first step was to distribute the
questionnaires to the investors by giving the
Trimegah Asset Management. The Danareksa’s
manager distributed the questionnaires by e-mail.
The time given to answer the questionnaires is about
two weeks. While for PT Trimegah Asset Management,
the questionnaires were given the hard copy. The
time given were about two weeks.
The second step is to collect the distributed
questionnaires. The Danareksa’s manager will give
back the questionnaires via e-mail. While Trimegah
Asset Management sent back the answered hard copy
of the questionnaires. The data gathered from both
company were not fulfilling the minimum
requirements. Then the snowball samples were
employed in this study. The total numbers of the
questionnaires that have been answered were seventy
six (76).
D. Analysis Technique
The data obtained from the questionnaires
would be analyzed by using Statistic Package for the
Social Science (SPSS) 20. To analyze and test the
hypotheses, regression was employed in this study.
regression determines the impact of multiple
independent variables presented simultaneously to
2007). The independent variables were the
demographic features (age, gender, education) and
the big five personality model (openness,
conscientiousness, extraverts, and neuroticisms).
While dependent variable was the investors’ stock