Full Terms & Conditions of access and use can be found at
http://www.tandfonline.com/action/journalInformation?journalCode=vjeb20
Journal of Education for Business
ISSN: 0883-2323 (Print) 1940-3356 (Online) Journal homepage: http://www.tandfonline.com/loi/vjeb20
A Collaborative Project to Increase the
Participation of Women and Minorities in Higher
Level Mathematics Courses
Kristin Kennedy & Phyllis Schumacher
To cite this article: Kristin Kennedy & Phyllis Schumacher (2005) A Collaborative Project to Increase the Participation of Women and Minorities in Higher Level Mathematics Courses, Journal of Education for Business, 80:4, 189-193, DOI: 10.3200/JOEB.80.4.189-193
To link to this article: http://dx.doi.org/10.3200/JOEB.80.4.189-193
Published online: 07 Aug 2010.
Submit your article to this journal
Article views: 16
View related articles
or years, there has been a growing concern about the scarcity of women and individuals from ethnic minority groups in scientific and technical fields. This problem is of concern to academics and business personnel alike. According to a recent National Science Foundation report (NSF, 2003), in 1997 only 22.8% of the scientists and engineers in the labor force were women, and most of these women were in the social and related sci-ences. Women represented only 27.3% of the computer and mathematical scien-tists, 21.9% of the physical scienscien-tists, and only 9.1% of the engineers. The report also indicated that 82.8% of scientists and engineers in the U.S. labor force in 1997 were White, 10.4% were Asian/Pacific Islanders, 3.4% were Black, 3.1% were Hispanic, and 0.3% were American Indian/ Alaskan/Other.
The statistics on recent graduates indicate that the situation is not likely to change. The number of bachelor’s degrees conferred by degree-granting institutions in the United States is pro-vided by the National Center for Educa-tion Statistics (NCES). These statistics for 2001 graduates indicate that there has not been much improvement in quantitative fields, particularly in com-puter science and engineering. The NCES figures indicate that 72% of the degrees in Computer and Information Science were awarded to men, with only
28% to women, 9.7% to Blacks, and 5.1% to Hispanics. For engineering, 79.6% of the degrees went to men and only 5.4% to Blacks and 5.45% to His-panics (NCES, 2001).
Statistical data obtained from the Col-lege Board reports concerning the perfor-mance of women and minorities in high school mathematics and intended college majors show that these disparities start to appear in high school. The College Board (2002) site noted that there is no signifi-cant difference between the performance of women and men in high school math-ematics. The reported national average grade point average (GPA) for college-bound students in 2002 was 3.08 for
women and 3.09 for men (College Board). Not only do women perform as well as men in mathematics classes but also, according to the National Assess-ment of Educational Progress (NAEP), “In general, female students are as likely as males to take advanced math/science courses in high school with the exception of physics” (“Girls’ math/science educa-tion,” 1998, p. 44).
Despite the fact that women perform as well as men in mathematics courses and that they take as many advanced math courses as their male counterparts, they do not score as well on the math SAT and AP exams. According to the SAT College Board, in 2002 the average math SAT score for men was 534, whereas the average score for women was 500. The differences between men’s and women’s scores have nar-rowed slightly since 1997. There are even greater disparities with reference to ethnic SAT data.
Except for Asian Americans, of whom approximately 64% took physics and 42% took calculus, the other ethnic minorities lag somewhat behind Whites, particularly with respect to having taken calculus (College Board, 2002). Where-as 26% of the White students reported having taken calculus, only 14% of the African Americans and between 14% and 19% of students from other ethnic minority groups reported having taken
A Collaborative Project to Increase
the Participation of Women and
Minorities in Higher Level
Mathematics Courses
KRISTIN KENNEDY PHYLLIS SCHUMACHER
Bryant University Smithfield, Rhode Island
F
ABSTRACT. In this article, the authors describe a program developed to encourage women and minorities to continue their study of mathematics in high schools until graduation. The 3-year program was a collaborative effort by professors and students from Bryant University, local businesses, and local high schools. During the 3 years, the program evolved from the development and presentation of reality-based math-ematical modules taught in the high school classrooms to an interdiscipli-nary enrichment activity at Bryant Uni-versity. The university students acted as mentors or tutors to the high school stu-dents. Throughout the program, the business representatives, university personnel, and high school teachers collaborated to bring mathematics alive to the students through real-world applications.
calculus. The College Board organiza-tion also provides the average math SAT scores for the various ethnic groups. In 2002, average scores for students of Asian descent, White Americans, African Americans, and other Hispanic minorities were, respectively, 569, 533, 427, and 464 (College Board).
Intended college major is also an important statistic to consider in deter-mining the number of students entering technical and scientific fields. Only 18% of students nationwide expressing an interest in both computer science and in engineering as majors were female. Of those expressing an interest in math-ematics, 56% were male and 44% were female. The only major in a scientific field in which a greater percentage of women expressed interest was biology, in which 66% of the intended majors were women (College Board, 2002). The NAEP findings noted that this dif-ference begins as early as eighth grade (“Girls’ math/science education,” 1998). Furthermore, Oswald and Harvey (2001) noted very low percentages of women obtaining degrees in math, physical science, and engineering. In fact, they indicated that 2.5 times more women leave the field than men do. They further stated that math is a “criti-cal filter” for future careers in techno-logical fields.
Several authors have studied the influence of high school course selec-tion on a later choice of science and mathematics majors in college. Trusty (2002) reported that this correlation was greater for women than for men. Trusty also reported that Adelman found that the completion of a college degree was related to the level of mathematics com-pleted in high school. He found that this relation held for all racial and ethnic groups and was stronger for African Americans and Hispanic students than for White students (Adelman, 1999). These researchers’ data suggest that intervention efforts should be targeted at middle or high school students.
Statistics underscoring this issue have been lingering for many years. The con-cern is shared by business and technical colleges, which have experienced a declining enrollment of women students and a minimally growing number of other minority students. In this article,
we describe a project, the Math Accel-erating Professionals (MAP) Program, which was developed as part of a grant that involved the collaboration of uni-versity math professors, business pro-fessionals, and high school math teach-ers. General Electric funded the MAP project, to be administered at Bryant University over 3 years, and area high schools were selected for participation on the basis of the number of enrolled minority students.
The students who participated from each school were the ninth graders enrolled in advanced mathematics classes. Because high school math is a “critical filter” for those entering tech-nological fields, we targeted early math classes for this research. Although women and minorities were the stu-dents of concern, the project was planned for the entire population in the classes of the schools participating in the program.
Year 1
The 1st year of the program had sev-eral objectives: (a) to pair each high school with a local company in its town, (b) to design a preliminary math-ematical teaching module associated with a business topic, (c) to initiate a college-student mentoring program with the local high schools, and (d) to provide opportunities for social interac-tion of all involved parties.
The grant administrator at the uni-versity hired two former high school teachers to act as liaisons between the university, business, and high school personnel by identifying local compa-nies, in the respective towns of the par-ticipating high schools, that would assign company representatives to work in the program. The professors were charged with developing a classroom teaching module illustrating the impor-tance of mathematics in the daily work-ings of the business world.
One of the challenges was to simplify the business applications enough so that they would be at an appropriate level for a typical ninth-grade algebra class. Because the MAP program is a 3-year program, it was important that the cho-sen topic would grow as the students’ math ability improved. The project
required a simple model representing an interesting problem that easily could be enhanced in level of difficulty and to which a computer application could be added. We chose the application of lin-ear programming (LP). LP uses mathe-matical modeling, a process of changing a word problem into algebraic expres-sions. The modeling process is an essential skill for high school students. Furthermore, there are several computer packages available that solve LP with both a graphical and a computer algo-rithmic approach. The discussion of LP with the help of computer packages could be enhanced to include sensitivity analysis, which examines the effect of perturbance of the parameters of the problem or the solution.
One of the businesses coupled with a high school happened to be using LP for top-level managerial decisions. The stu-dents were impressed to see that actual data from the company could be used in the LP model that they were studying. Initially, we had them use the graphical solution method with the original data from the manufacturing company. The students understood the concept of graphing inequalities; however, graph-ing a set of inequalities and creatgraph-ing a convex region as a solution space was an expansion of the topic as it is traditional-ly presented at this level. We simplified the original data set to two variables and three constraints. However, the entire data set from the company was included as an appendix and could be used by the teacher as an optional application to be solved with a computer package.
The third facet of the grant involved the employment of university students, whose role was to act as both mentors and tutors to the high school students. During the semester, the university stu-dents visited the high school, met with the students, and tutored them in their classroom.
Early in the program, there was a for-mal dinner at which all the participants met socially, and at the end of the acade-mic year the high school students and teachers came to the university for a “Meet the Professionals Day” (MPD). The MPD was a day devoted to high-lighting the value of studying mathemat-ics. Guest speakers from several busi-nesses participated, and the students
were broken into groups to attend semi-nars on different aspects of the impor-tance of math to business.
Year 2
In the 2nd year, the relationships among the grant participants became significantly more relaxed and comfort-able. The high school teachers and the professors worked together to clarify and enhance the mathematical modules, which were again taught in the class-rooms. A significant addition to the pro-gram was visits by the professors to high schools, where they addressed the students. They talked about math at the college level and about mathematics careers. Their objective was to encour-age the high school students to continue their pursuit of mathematics.
The university-student mentors now worked easily with the high school stu-dents and derived a great deal of satisfac-tion from not only tutoring but also shar-ing their success in pursushar-ing college-level mathematics. All of the student mentors, with one exception, were women who were excellent in mathematics and had chosen technical fields. The only difficult part in establishing the mentoring pro-gram was pairing all of the respective schedules.
In the early fall, a second formal din-ner was held with the professors, the high school teachers, the mentor-tutors, and the business professionals. One of the highlights of the evening took place when the student mentors spoke briefly about how they chose math as a career path.
At the end of the year, there was a sec-ond and very successful “Meet the Pro-fessionals Day” similar to the first MPD. The two keynote speakers were women with outstanding résumés and experi-ence in the business and research worlds. A sophomore class of 25 women from one of the attending high schools was very positively affected by this day of seminars. The camaraderie that devel-oped over the 2 years was no less impor-tant to the success of the program than any other aspect of the program.
Year 3
The 3rd year was comprised of several of the same components involved in the
first 2 years. There was a formal kick-off dinner, the mentor-tutor program was continued, and the year culminated with a third MPD. This year’s program included two significant enhancements: (a) a pro-fessional development day for the high school faculty members and (b) a day-long enrichment program for the stu-dents. It was offered at the university in place of the classroom modules.
The MAP program sponsored a 4-hour professional development work-shop for the mathematics teachers from all of the schools involved with the pro-gram. This workshop highlighted the computer software developed by Vernier Software and Technology in conjunction with Tufts University. The teachers worked on selected mathemat-ics activities from the Real-World Math With Computers workbook (Gastineau, Braningsen, Bower, Antinone, & Kern-er, 2003).
Of the 25 teachers who took part in the workshop, 24 completed an evalua-tion. Twenty-three gave the day an over-all rating of excellent, and 1 rated it as good. When asked if they would recom-mend the activity to others, 23 stated that they definitely would and 1 stated that he or she probably would. When asked if they found the activity useful in applying information in the classroom, 14 found it very useful, 7 found it use-ful, and 3 found it somewhat useful.
At this junction, the classroom mod-ules had been developed to their full potential. A fresh and more interactive mathematical activity for the final year seemed appropriate. Each of the high schools was invited to Bryant University for a day. Because Bryant has a new Financial Market Center and state-of-the-art technology classrooms, the enrichment day was planned around using these facilities to highlight the use of mathematics in financial applications.
The students who attended the Enrich-ment Day were now juniors or seniors in high school. At the beginning of the day, they gathered in an electronic classroom. Four women professors from the Mathe-matics and Finance Departments pre-sented the activity for the day. The activ-ity was designed to illustrate how some basic and familiar statistical topics gen-erally covered in high school could be used to interpret risk and return in the
financial world. The presentation opened with a review of the mean, variance, and coefficient of variation of a data set. Probability distributions were introduced with a quick coin-tossing example. As a class, the students created probability tables that empirically approached the theoretical distribution. The graph of this simple discrete example was an introduc-tion to the bell-shaped curve of a normal distribution, with which the students were familiar.
The discussion then shifted to how this familiar information could be used to relate risk and return in the financial world, a topic with which the high school students were perhaps less com-fortable. First, we gave an explanation of stochastic dominance, and bell-shaped curves were compared with regard to their relation to stock prices, particularly relating mean to return and standard deviation to risk. Market tim-ing and industry returns were discussed. Then the students were given some real financial data (average company returns for 2002) to analyze. Each student had his or her own data for one particular company and used Excel to calculate his or her own mean and standard devia-tion. Then we grouped the students according to industry, and, collectively, they calculated the mean and standard deviations of their respective industries. A lively discussion followed concerning the performance of companies and industries in general.
The last section of the presentation developed linear regression and its application to a market model with mar-ket risk and company-specific risk. The discussion focused on how the value of beta measures the sensitivity of a com-pany to market risk. At the end of the classroom hands-on presentation, the students visited the Financial Market Center at Bryant, where they were shown how their data were retrieved. After their tour, a representative of Fidelity Investments spoke to them about the importance of mathematics in understanding financial markets.
The Assessment Information
An important part of the grant involved the collection of data that would illustrate the success of the
gram to the funding institution— namely, tracking which students would continue with higher level math classes. Each high school had some historical data on the dropout rate, which drove yearly changes in the class enrollment. It was challenging to establish data that clearly reflected the success of all the efforts made in the MAP program. Many factors affect high school stu-dents’ decisions regarding whether to continue their mathematical studies. Notably, the MAP program had no con-trol group within the participating schools. We provide a review of yearly changes in the enrollment numbers at the high schools.
In Table 1, we highlight the percent-ages of female and minority students at the schools. High Schools A and B were
two schools within the same city, gener-ally considered a blue-collar city with a population of about 70,000. High School A’s population consisted of fam-ilies with lower incomes, and the data in Table 1 indicate that the majority of minority students from the city attended High School A. The two schools were rather evenly split between men and women, but High School A had a signif-icantly higher percentage of women in the MAP program than did High School B. Interestingly, High School B, which had a lower cultural diversity, a popula-tion with a higher income, and fewer minority students, had a much lower percentage of female students in the MAP program.
High School C served a population of 18,000 lower and middle-class families
of a manufacturing town. Sixty percent of the town’s residents are from minority groups, and many are immigrants or first-generation Americans. Therefore, we had a very high percentage (79%) of minority students in the program. High School D serviced a city of 43,000 lower and middle-class families as well. The city is very stable, and the population is largely White; however, the education and income levels of the people are sig-nificantly below statewide levels. Both of these struggling high schools posted high percentages of women in the MAP pro-gram, compared with the overall percent-age of women in the schools. However, the minority percentage of students from High School D in the MAP program was troublingly low.
In an effort to capture information regarding whether the MAP program was improving the overall retention rate in mathematics classes, we determined a baseline enrollment figure and a target enrollment figure. The baseline enroll-ment was projected by the respective high school administrations, who examined the historical data on their class sizes for the previous 5 years. The baseline was then established as the number of stu-dents expected to continue into the advanced class the following year. At some schools, this meant that the students could continue only with teacher approval.
We then established a target enroll-ment that would meet the goals of the original grant with General Electric. The original goal for the 1st and 2nd years was simply to ensure that the tar-TABLE 1. Demographics of Program Participants
Demographic category Schoolwide (%) MAP group, year 3 (%)
High School A
Minorities 70 60
Women 51 70
High School B
Minorities 32 10
Women 53 47
High School C
Minorities 72 79
Women 49 55
High School D
Minorities 28 16
Women 50 63
Note. MAP stands for the Math Accelerating Professionals Program.
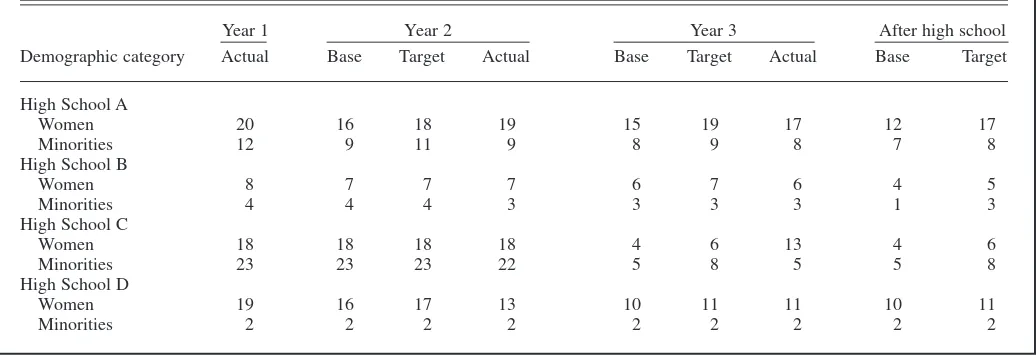
TABLE 2. Enrollment by Gender and Ethnicity
Year 1 Year 2 Year 3 After high school
Demographic category Actual Base Target Actual Base Target Actual Base Target
High School A
Women 20 16 18 19 15 19 17 12 17
Minorities 12 9 11 9 8 9 8 7 8
High School B
Women 8 7 7 7 6 7 6 4 5
Minorities 4 4 4 3 3 3 3 1 3
High School C
Women 18 18 18 18 4 6 13 4 6
Minorities 23 23 23 22 5 8 5 5 8
High School D
Women 19 16 17 13 10 11 11 10 11
Minorities 2 2 2 2 2 2 2 2 2
get enrollment would be greater than or equal to the baseline enrollment. As the program developed from year 2 to year 3, the goals became more quantitative. From year 2 to year 3, the grant speci-fied that the target enrollment should be greater than or equal to 105% of the baseline. After year 3, the target enroll-ment was to be greater than or equal to 110% of the baseline enrollment. The original grant also established the goal of trying to increase the number of stu-dents taking calculus before graduat-ing. However, because not all of the schools offered calculus, this goal was modified to stipulate that the students should be on track to take either pre-calculus or pre-calculus by year 3, their junior or senior year. We present this information in Table 2.
In examining the data for year 2, we can see that the actual numbers corre-spond closely to the target numbers. High School D posted the lowest actual enrollment with respect to the target enrollment. A few women dropped out of the program, even though High School D had the strongest tutoring pro-gram of all. In fact, the afternoon tutor-ing program was usually attended com-pletely by women. High School C posted very encouraging numbers, given that this high school represented the lowest income level and the lowest educational level of all four schools. For this school, the target enrollment involved simply maintaining the base-line enrollment. The numbers for the actual enrollment fell short by only one, but this is a school with much transience and problems such as high school
preg-nancy. To have one or two students choose to go to college and study quan-titative programs would be a success story from High School C.
In year 3, all of the baseline numbers dropped, so the target numbers appear low as well. The great success story was High School C. The actual enrollment was significantly higher than the target number. To motivate students to even consider taking precalculus in their senior year is a difficult task. High School D was also successful in main-taining the target number, which was higher than the baseline. Although High Schools A and B achieved numbers slightly lower than the target numbers, the program did not incur a high dropout rate.
For the postgraduation year, as set by the original grant, the goal of the target number was to be at least 110% of the baseline number. The data, if collected next year, will be based on the students’ reporting of their choices for majors and concentrations of study as college freshmen.
Conclusion
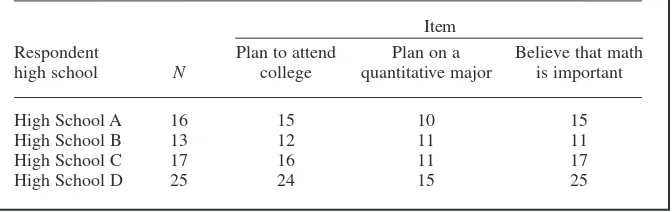
The MAP program concluded with a third MPD. We asked all attending stu-dents to complete a questionnaire that included items concerning their likeli-hood of attending college and their intended major. We present these results in Table 3. As can be seen from these numbers, most students were planning on attending college. At all schools, more than 60% of the students planned on pursuing a quantitative field of study.
At High School B, the percentage jumped to over 90%.
In an attempt to measure the success of the program in highlighting the importance of mathematics, we asked the students to rate the extent of their agreement with the following statement: “Mathematics is important to everyone’s life” (see Table 3). Astonishingly, almost 100% of the students either agreed or strongly agreed with the statement.
Overall, the numbers were encourag-ing. The high school students particular-ly liked the mentoring program and the activity days at Bryant College. For three of the four high schools, in year 3 the actual numbers of students still studying math were higher than the baseline numbers, with significant suc-cess demonstrated in High School C. The original grant with General Electric maintained that a decision to study a higher level of mathematics by only one or two more women or minority stu-dents from these four high schools would be considered a success. The goal was achieved.
REFERENCES
Adelman, C. (1999). Answers in the toolbox: Aca-demic intensity, attendance patterns, and bach-elor’s degree attainment. (Monograph) College Board. (2002). College bound seniors.
Col-lege bound report.Retrieved September 25, 2002, from http://www.collegeboard.com/about/news info/cbsenior/yr2002/html/2002reports.html Gastineau, J., Braningsen, C., Bower, B.,
Anti-none, L., & Kerner, E. (2003). Real world math with computers.Beaverlin, OR: Vernier Soft-ware and Technology.
Girls’ math/science education. (1998). Education Digest, 63(5), 42–49.
National Center for Education Statistics (NCES). (2001). Digest of education statistics, Table 269. Retrieved April 29, 2003, from http://nces. ed.gov/pubs2002/digest2001/tables/dt269.asp National Science Foundation (NSF), Division of
Science Resources Studies. (2003). Women, minorities, and persons with disabilities in sci-ence and engineering: 2000. NSF 00–327. Arlington, VA. Retrieved May 4, 2003 from http://www.nsf.gov/sbe/ses/nsf00327/access/ch 5/ch5.html
Oswald, D., & Harvey, R. (2001). Hostile envi-ronments, stereotype threat, and math perfor-mance among undergraduate women. Current Psychology, 19(4), 338–356.
Trusty, J. (2002). Effects of high school course taking and other variables on choice of science and mathematics college majors. Journal of Counseling and Development, 80(4), 464–475.
TABLE 3. “Meet the Professionals Day” (MPD) Survey
Item
Respondent Plan to attend Plan on a Believe that math high school N college quantitative major is important
High School A 16 15 10 15
High School B 13 12 11 11
High School C 17 16 11 17
High School D 25 24 15 25