INTRASEASONAL VARIATIONS OF NEAR-SURFACE ZONAL
CURRENT OBSERVED IN THE SOUTH-EASTERN
EQUATORIAL INDIAN OCEAN
Iskhaq Iskandar
Department of Physics, Faculty of Mathematic and Natutal Science, Sriwijaya University Jl. Palembang-Prabumulih Km. 32, Inderalaya, Ogan Ilir, Sumatra Selatan – 30662, Indonesia
Received : February, 14, 2011 ; Accepted : August, 22, 2011
ABSTRACT
Dynamics of intraseasonal variability in the near-surface zonal currents in the southeastern equatorial Indian Ocean is examined through the analysis of the observed currents at 1.5S, 90E and sea surface height (SSH) as well as wind fields along the equator for the period of 23 October 2001 to 3 July 2007. The result demonstrates that the zonal current has energetic intraseasonal variations within the period band of 30–70 days. These oceanic intraseasonal variations are forced by the atmospheric intrasea-sonal disturbances from the west to the central Indian Ocean basin west of the mooring location. The coherence analysis indicates that these intraseasonal zonal currents are coherent with the intraseasonal SSH along the equatorial Indian Ocean. The coherence and lag-correlation analyses agree that these intraseasonal zonal currents are associated with eastward propagating waves with a phase speed falls in the first two vertical modes of baroclinic waves observed in the equatorial Indian Ocean.
Keywords: Equatorial Indian ocean; Kelvin wave; Wyrtki jet; zonal current
Correspondence : Phone: 0711 – 580743, Fax: 0711 – 580268, E-mail: iskhaq.iskandar@gmail.com
I
NTRODUCTION
The oceanic circulations in the equatorial Indian Ocean are strongly influenced by the reversing monsoonal winds. During the inter-monsoon in April-May and October-November, sustained westerly wind
bursts generate eastward equatorial jet along the equator, so-called the Wyrtki jet (Wyrtki, 1973). It is has been suggested that the jet is confined to the equator within a narrow band of a few degrees, with a typical amplitude of surface zonal currents of about 80 cm s-1 or more (Nagura and McPhaden, 2010).
Short after the seminal work of Wyrtki, a modeling study using a two-layer model demonstrated the existence of this semiannual jet along the equatorial Indian Ocean (O’Brien et al., 1974). The study indicates that the jet developed in response to semiannual westerly winds over the
equatorial region. Dynamics of equatorial jet has been extensively studied in several previous works using numerical model (Han
et al., 2001; Han, 2005; Sengupta et al., 2007; Nagura and McPhaden, 2010).
several different time-scales, including intraseasonal, semiannual, annual and interannual variations (Reppin et al. 1999; Masumoto et al., 2005; Iskandar et al., 2009; Iskandar and McPhaden, 2011).
This study examines the intraseasonal dynamics of the observed near-surface zonal currents in the southeastern equatorial Indian Ocean using available observation at 1.5S, 90E. A brief description of the data and method used in this study is presented in the next section. This is then followed by description of the characteristics of temporal variability of the zonal currents at this location. The following section discusses the dynamics of these observed currents based on the equatorial wave dynamics. The last sec-tion is for summary.
M
ATERIALS
A
ND
M
ETHODS
Materials
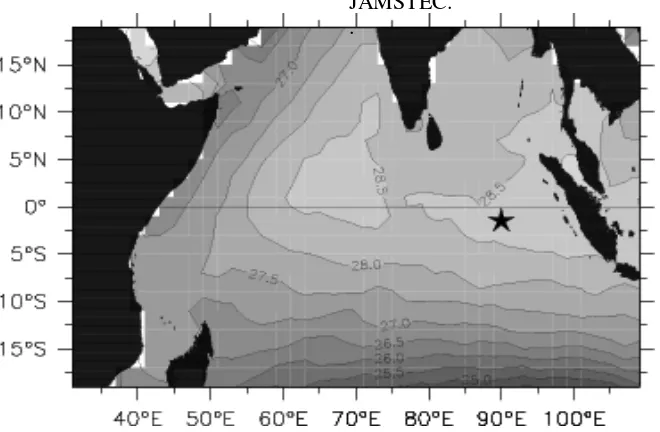
The dynamical variability of the zonal current in the eastern equatorial Indian Ocean was investigated through the analysis of the observed currents recorded by the TRITON (TRIangle Trans-Ocean buoy Network) buoy moored at 1.5S, 90E (Fig. 1). The time series extends from 23 October 2001 through 3 July 2007 encompassing period of strong Indian Ocean Dipole events in 2006 (Horii et al., 2008). Note that short gaps in the time series exist at both sites because of the time
between mooring recoveries and redeployments. We have linearly interpolated
across these gaps and other gaps shorter than 10 days resulting from instrument failure or other problems. The data is provided by JAMSTEC.
.
Fig. 1. Location of the TRITON buoy in the eastern Indian Ocean (marked with STAR) superimposed on the mean sea surface temperature from World Ocean Atlas 2001.
The dynamics of these near-surface zonal currents is evaluated using satellite product of sea surface height (SSH) along the equator. Merged SSH data with horizontal resolution of 1/3° 1/3° and temporal resolution of 7 days is obtained from the AVISO website.
that both gridded SSH and surface winds are analyzed for the same period as the currents data from 23 October 2001 to 3 July 2007.
Method of analysis
In order to examine the temporal characteristics of the datasets, the Fourier
analysis was used in this study. A brief description of the Fourier analysis is given in the following (Emery and Thomson, 2004).
Consider a time-series data, y(t), which Note that all frequencies are confined to the Nyquist interval,
f
N
f
k
f
N, (2) in which f N = 1/(2t) is the Nyquist fre-quency. The energy spectral density is then defined as,
S
E(
f
k)
Y
k2,
k
0,...,
N
1
. (3) In order to evaluate the dynamics of the intraseasonal zonal current, the coherence analysis is performed. First, we applied the coherence analysis between the observed zonal currents and the zonal winds over the equatorial region to define the forcing mechanism.Then, the possible relation between the temporal variability of the zonal currents and equatorial waves is examined by applying coherency analysis between the zonal currents at 1.5S, 90E and the SSH at each longitude along the equator.The cross-spectral power density
while the phase-lag between the two time-series is calculated using the southeastern equatorial Indian Ocean is shown in (Fig. 2.) Apparently, we can see that the currents indicate clear intraseasonal variations. In addition, the currents are strong during the transition period between two monsoons of April – May of 2001, 2003 and 2005, as well as during September – November of 2005 and November – December of 2006. This typical current is well known as the Wyrtki jet (Wyrtki, 1973). On the other hand, the currents are relatively weak and occasionally flowing westward during most of 2006. These anomalous easternly wind anomalies along the equator and south eastern winds alongshore of Sumatra and Java. One dynamical response of the ocean to these wind anomalies is the termination or reverse direction of the eastward surface currents along the equator.
Fig. 2. Time-series of the daily zonal currents observed at 1.5ºS, 90ºE at 10 m depth.
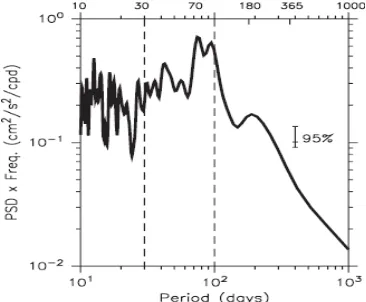
The spectrum given in Fig. 3 shows a broad range of significant intraseasonal variability. The spectrum also indicates dominant spectral peak of intraseasonal variations at period of 70-day. Since the spectrum of observed zonal current does not appear to have a fixed frequency band, thus we selected the band of most energetic
frequencies to define the intraseasonal variations in this study. The resulting band includes periods between 30 and 70 days. Thus, we apply 30–70-day band-pass filter to all quantities. Unless otherwise specified, all intraseasonal variabilities discussed in later sections are obtained in this manner.
Fig. 3. Variance-preserving spectra of the observed zonal current shown in Fig. 2. at 1.5ºS, 90ºE for daily data.
Forcing mechanism
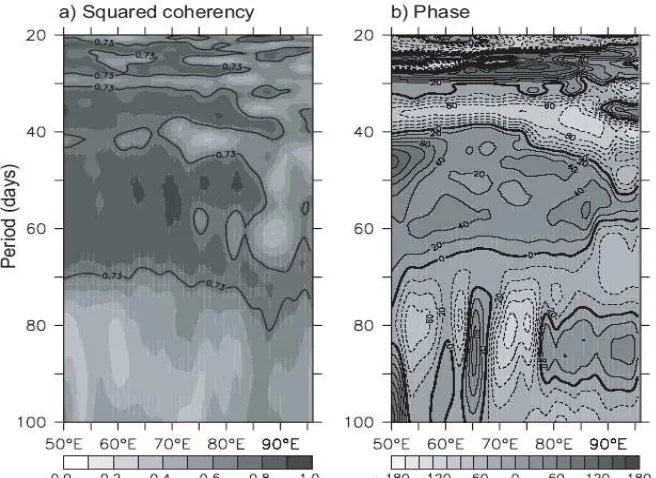
In order to determine the forcing of these intraseasonal zonal currents, we have calculated coherency between the zonal wind variability along the equator and the observed zonal currents (Fig. 4). Coherence significant at the 95% level is seen in the intraseasonal band at periods between 30 and 70 days, from longitude 50ºE to 85ºE (Fig. 4).
The intraseasonal coherence between the zonal winds and the zonal currents is not surprising, but it is important because it demonstrates the atmospheric forced nature
of the eastern equatorial Indian oceanic signals.
correspond exactly to theoretical phase speed of one particular baroclinic mode, the lower limit of the estimated phase falls in between the first two vertical modes of baroclinic
waves observed in the equatorial Indian Ocean (e.g. c1 = 2.5 m s-1, c2 = 1.55 m s-1;
Nagura and McPhaden, 2010).
Fig. 4. Longitude-period plots of correlation between the equatorial zonal winds and the observed zonal current using the cross-spectral analysis. The left and the right panels indicate the squared co-heency and the phase difference, respectively. The 95% confidence limit (0.73) is shown by thick contour in the left panel.
This result is also in a good agreement with the previous study which demonstrates that the intraseasonal variations of upper ocean currents obtained from an acoustic Doppler current profiler (ADCP) observation at 0S, 90E are forced by the atmospheric intraseasonal disturbances over the equatorial Indian Ocean (Masumoto et al., 2005).
Dynamics of the intraseasonal varitions
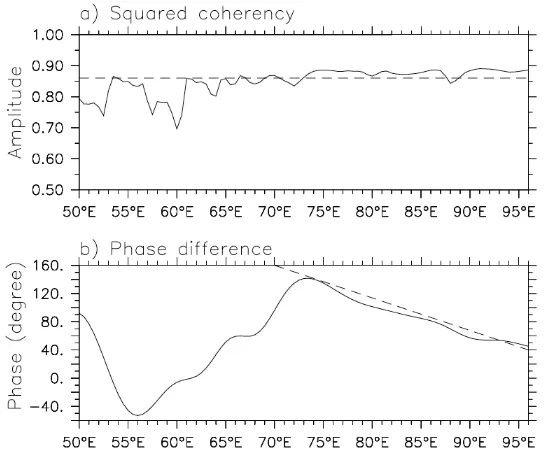
To further explore if the dynamics of the intraseasonal zonal currents is indeed associated with the equatorial waves, squared coherency is calculated between the zonal currents and the SSH at each longitude along the equator. The squared-coherency amplitude and phase difference averaged over periods of 30–70 days are plotted in Fig. 5.
The coherence is significant above the 95% confidence level along the equator east of about 70ºE (Fig. 5), where the phase
variations are nearly linear with a slope indicating an eastward propagation (Fig. 5). The average propagation speed of the eastward-propagating intraseasonal-signals is computed based on an amplitude-weigthed linear least squares analysis. The 95% confidence limits are obtained by procedure described by Emery and Thomson (2004) for trend analysis. The estimated phase speed is 1.85 0.63 m s-1. Again, the result shows that the estimated phase speed does not correspond to one particular baroclinic mode, though they fall within the range expected for the first two baroclinic modes (e.g. c1 = 2.5 m
s-1, c2 = 1.55 m s -1
Fig. 5. Squared coherence amplitude (a) and phase (b) of the zonal current at 1.5ºS, 90ºE at 10m depth with the SSH at each longitude along the equator at period of 30 – 70 days. The dashed horizontal line in the upper panel is the 95% confidence level. The dashed line along the phase in the lower panel is a linear regression fit to time lag between 75E and 95E.
In order to explore if these propagating features captured by the above coherence analysis have a basin-wide structure, we examine the longitudinal structure of the SSH along the equator. Fig. 6 shows the longitude-time diagram of 30–70-day band-pass filtered SSH along the equator.
The figure clearly shows eastward propagating signals which across the basin.
This result further confirms that there are eastward-propagating intraseasonal-signals
along the equator which areassociated with the propagation of the first two baroclinic equatorial wave.
C
ONCLUSIONS
Data from TRITON buoy moored at 1.5S, 90E are used to study the intraseasonal characteristic of the near-surface zonal currents in the equatorial Indian Ocean (Fig. 2). The daily surface wind data from NCEP/NCAR) reanalysis are utilized to investigate the forcing mechanism. Merged SSH data from AVISO are used to demonstrate the basin wide evolution of the intraseasonal signals.
Spectrum analysis of the zonal current at 1.5S, 90E demonstrated that there exist energetic intraseasonal variations within the period of 30–70 days (Fig. 3). Based on this result, a band-pass filter was designed and applied to all time series to examine the dynamics underlying the intraseasonal variations of the observed near-surface zonal currents.
The coherence analysis between the zonal currents and the zonal winds along the equator reveals that the intraseasonal zonal currents are forced by the atmospheric intraseasonal disturbances from the west of the mooring location (Fig. 4). On the other hand, the coherence analysis between the zonal currents and the SSH along the equator suggests that these intraseasonal variations are associated with the first two baroclinic mode of the equatorial waves (Fig. 5). Moreover, the longitude-time diagram of the filtered SSH (Fig. 6) further indicate eastward-propagating signal along the equatorial Indian Ocean.
A
CKNOWLEDGMENTS
The current data utilized in the present study are supplied by the RIGC/JAMSTEC. The altimeter products were obtained from AVISO, while the wind data are provided by the NCEP/NCAR. Helpful comments from a reviewer have improved the presentation of the manuscript.
R
EFERENCES
Bloomfield, P. 1976. Fourier Decomposition of Time Series: An Introduction, John the equatorial Indian Ocean observed from sea surface height, wind, and temperature data, J. Phys. Oceanogr., 37, 188-202.
Han, W. 2005, Origins and dynamics of the 90-day and 30-60-day variations in the equatorial Indian Ocean, J. Phys. Oceanogr., 35, 708-728.
Han, W., D. M. Lawrence, and P. J. Webster. 2001. Dynamical response of equato-rial Indian Ocean to intraseasonal winds: Zonal flow, J. Geophys. Res. Ocean Dipole on intraseasonal zonal currents at 90E on the equator as revealed by self-organizing map, J. Geophys. Res. Lett., 35 : 403-409
Iskandar, I., Y. Masumoto, and K. Mizuno. 2009. Subsurface equatorial zonal current in the eastern Indian Ocean, J. Geophys. Res. Lett, 114 : 6005-6009
Masumoto, Y., H. Hase, Y. Kuroda, H. Matsuura and K. Takeuchi. 2005. Intraseasonal variability in the upper layer currents observed in the eastern equatorial Indian Ocean, J. Geophys. Res. Lett., 32: 2607-2611.
Murtugudde, R. G., J. P. McCreary, and A. J. Busalacchi. 2000. Oceanic processes associated with anomalous events in the Indian Ocean with relevance to 1997-1998, J. Geophys. Res. Lett, 105: 3295-3306.
Nagura, M., and M. J. McPhaden. 2010. Wyrtki jet dynamics: Seasonal variability, J. Geophys. Res. Lett., 115,: 7009 - 7011.
O’Brien, J.J., H. E. Hurlburt. 1974. Equatorial jet in the Indian Ocean: Theory, Science, 184 : 1075-1077.
Reppin, J., F. A. Schott, J. Fischer, and D. Quadfasel. 1999. Equatorial currents
and transports in the upper central Indian Ocean: Annual cycle and interannual variability, J. Geophys. Res.Lett, 104: 495-514.
Saji, N. H., B. N. Goswami, P. N. Vinayachandran, and T. Yamagata. 1999. A dipole mode in tropical Indian Ocean, Nature, 401: 360-363.
Sengupta, D., R. Senan, B. N. Goswami, and J. Vialard. 2007. Intraseasonal variability of equatorial Indian Ocean zonal flow, J. Clim, 20 : 3036-3054.
Webster, P. J., A. M. Moore, J. P. Loschnigg, and R. R. Leben. 1999. Coupled ocean-atmosphere dynamics in the Indian Ocean during 1997-98, Nature, 401: 356-359.