Leaders in many nations
are currently discussing ambitious targets for reducing emissions of greenhouse gases (GHGs) in order to mitigate the serious impact of climate change on the environment, human societies, and our economies. Many scientists and policy makers believe that limiting the rise in global mean temperatures below 2 degrees Celsius is an important aim, as they see this as a threshold where the implications of global warming become very serious.Aiming to contribute to these discussions, McKinsey & Company has undertaken a global effort to provide a fact base on what technical levers exist to achieve abatement from the projected base case of emissions, and at what cost. The global work concluded that the implementation of some 200 initiatives across ten major economic activities and 21 regions has the potential to reduce these admissions by 55 percent, at a cost of less �60 per tonne of CO2e1 or even 70 percent with higher
cost initiatives or by sequestering atmospheric carbon.
The following report focuses on what the challenge is for Brazil to play its part in this process of abating carbon emissions. Not surprisingly, it identifies reducing deforestation and emissions from the agriculture sector as the main sources of abatement, representing 85 percent of the abatement potential in the country.
A particular challenge for the taskforce was the quantification of what it would cost to effectively stop deforestation by 2030, especially in the Amazon biome.
It is not our intention to point the way to a specific path to solve a problem as complex as this one. Our contribution consists of compiling the works of numerous experts who have been studying this theme for decades, and public managers who have the practical job of facing this challenge, to develop a systemic approach for addressing the issue. This approach is anchored on strengthening the institutions and monitoring and control mechanisms, on creating incentives to develop and grow sustainable forestry activities, and investments to create
cost and the impact associated with each of the numerous initiatives, available to the public as our contribution to advance the discussion of these themes.
The conclusions in this report confirm Brazil’s potential to take a leading role in the global fight against climate change.
In addition to contributing by eliminating deforestation, because it has a large landmass that is either degraded or is not productive, Brazil has the capability to implement a broad scale reforestation program it can use for atmospheric carbon sequestration. When the global carbon sequestration markets are sufficiently developed to remunerate such reforestation programs more amply, Brazil would be the natural destination for this new industry and could serve as a global carbon reservoir.
This study intentionally avoids any assessment of specific policies and regulatory choices. Instead, its purpose is to provide an objective and uniform set of data that can serve as a starting point for corporate leaders, academics and policy makers when discussing how best to achieve emission reductions in Brazil.
According to the World Resources Institute2, Brazil is the 4th largest greenhouse gas (GHG)
emitter in the world but, looking forward to 2030, it is also one of the 5 countries with the largest potential to reduce such emissions. Its leading role in global climate change has then a number of implications, as well as creating significant opportunities.
The numerous issues related to these opportunities must be debated by various groups within Brazilian society – business, the government, regulatory bodies and non-government organizations. Sixty initiatives account for 10 percent of the potential abatement in Brazil, and have been identified as having a negative costs or, in other words, the associated savings would be larger than the costs. Of the remaining 70 initiatives, 80 percent of the abatement potential would cost less than �10 per tonne of CO2e (tCO2e) , much less than the value of a tonne of CO2e traded in the international carbon credit market. Implementing these initiatives, however, will require significant effort, from creating a low carbon culture and a regulatory framework through investments that would need encouragement in the form of legislation, or with this country’s increased involvement in the global carbon trading markets.
Within this context, the purpose of McKinsey & Company’s report is to identify and quantify the impact and cost of each of the initiatives Brazil can use to contribute to the global climate change agenda. This document is organized into the following chapters:
1. Summary of the main results
2. The Brazilian base case
3. Details of the emissions and abatement opportunities by sector
4. Implications for the Country
Appendix 1 – Model approach
Appendix 2 – How to read the abatement curve
Appendix 3 – Calculating implementation cost of avoiding deforestation
1.
Summary of the main results
– Brazil has an important
role to play in reducing global Greenhouse gas emissions
Globally,
in 2005 around 45 gigatonnes of CO2 equivalent (GtCO2e) were emitted into the atmosphere. According to the global McKinsey study3 that looked at current emissions and theirprojected growth, by 2030 emissions under a business-as-usual4 (BAU) scenario are expected
to reach 70 GtCO2e. The study built a database of over 200 opportunities for GHG abatement
distributed across 10 economic sectors and 21 world regions.
Our global analysis reveals that we can reduce emissions from 70 to 32 GtCO2e by taking a number of globally coordinated initiatives, with a cost of up to �60 per GtCO2e (Figure 1) An
additional 9 GtCO2e could come from either more costly technical measures (above �60 per
GtCO2e), from significant behaviour changes, or carbon sequestration from intense reforestation programs or other alternative techniques. Theoretically, capturing all this potential would mean emission levels that are broadly consistent with an emission pathway that, according to the Intergovernmental Panel on Climate Change (IPCC), would result in an average increase in the global temperature of less than 2 degrees Celsius.
Figure 1
3 “Pathways to a Low-Carbon Economy - Version 2 of the Global Greenhouse Gas Abatement Cost Curve”, McKinsey & Company, 2009.
4 The McKinsey & Company report uses BAU (business as usual) as terminology for the base case.
10
2005 25
Global greenhouse gas emissions
GtCO2e/year
20
15 2030
Evolution in global greenhouse gas emissions
Base case
Global abatement opportunities < €60/t CO2e
Global abatement
opportunities (€60–100/t CO2e)
and behavior changes
(high level estimates)
-9 (20%)
70
32
-38 (80%)
23
Evolution required to keep temperature increase below 2ºC
Peak at 550 ppm, long-term stabilization at 550 ppm Peak at 550 ppm, long-term stabilization at 550 ppm Peak at 550 ppm, long-term stabilization at 550 ppm Concentration of CO2e in the atmosphere
Note: As a reference, 1990 total emissions were 36 GtCO2e
SOURCE: Global GHG Abatement Cost Curve v2.0; Houghton; IEA; IPCC; den Elzen; Meinshausen; OECD; US EPA; van Vuuren 0
Within this context, Brazil has a relevant role to pay as it is responsible for 5 percent of the current GHG emissions and will be responsible for 4 percent of the estimated 2030 emissions, or 2.8 GtCO2e. Unlike more industrialized nations and the global norm, the main source of emissions in Brazil is the forestry sector. Deforestation alone is responsible for 55 percent of this country’s current GHG emissions and will be responsible for 43 percent in 2030. This very significant negative impact of the forestry sector is partially compensated by the low emissions of Brazil’s power sector, as most of the power in Brazil comes from large hydroelectric plants. In addition, ethanol penetration in the vehicle fleet is quite high.
Nevertheless, at 12 tCO2e per capita emission, Brazil is comparable to industrialized nations in
Europe, where per capita emissions are around 10 tCO2e per capita. If we exclude the forestry
sector, Brazilian per capita emissions drop to 5 tCO2e, which would bring this country down to the level of low/moderate emitters. However, as the Brazilian economy grows, so will the intensity of its GHG emissions, reaching a projected 14 tCO2e per capita in 2030, or 7.5 tCO2e per capita if we leave out the forestry sector. In short, Brazil’s emissions are already above the global average and, looking forward, even if we eliminate emissions from the forestry sector, they would remain relatively high.
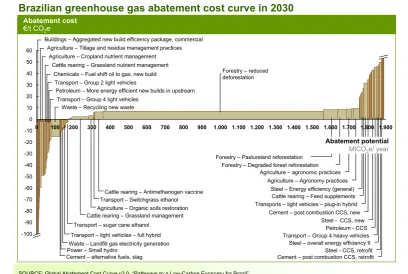
This shows how important it is that Brazil considers measures to reduce GHG emissions. Our study evaluated over 120 opportunities to reduce GHG emissions in all of Brazil’s main economic sectors. The result is an estimated potential to reduce 2030 Greenhouse gas emissions from 2.8 GtCO2e to 0.9 GtCO2e. This would eliminate 1.9 GtCO2e, equivalent to a 70 percent reduction in GHG emissions. Figure 2 shows the main initiatives included in this volume of greenhouse
gas abatement and the cost5 associated with each one. Appendix 1 shows how to interpret this
curve in more detail.
Figure 2
5 The cost includes the sum of investments and operating costs minus the economic benefit derived.
Brazilian greenhouse gas abatement cost curve in 2030
SOURCE: Global Abatement Cost Curve v2.0. “Pathways to a Low-Carbon Economy for Brazil”
Abatement cost
€/t CO2e
1.900
300 1.800
100 500 600 1.200
0 1.500 20 30 40 50 60 1.600 10
800 1.400 1.700
0 200 700 900 1.000 1.100 1.300
-10 -100 -20 -30 -40 -50 -60 -70 -80 400 -90
Cement – post combustion CCS, retrofit Steel - CCS, retrofit Steel – overall energy efficiency II Transport – Group 4 heavy vehicles Petroleum - CCS Steel - CCS, new Cement – post combustion CCS, new Transports – light vehicles – plug-in hybrid
Cattle rearing – Feed supplements Steel – Energy efficiency (general) Agriculture – Agronomy practices Agriculture – agronomic practices Agriculture – Tillage and residue management practices
Agriculture – Cropland nutrient management Cattle rearing – Grassland nutrient management
Chemicals – Fuel shift oil to gas, new build Transport – Group 2 light vehicles
Petroleum – More energy efficient new builds in upstream Transport – Group 4 light vehicles
Waste – Recycling new waste
Buildings – Aggregated new build efficiency package, commercial
Forestry – Pastureland reforestation Forestry – Degraded forest reforestation
Abatement potential
MtCO2e/ year Forestry – reduced
deforestation
Waste – Landfill gas electricity generation Transport – light vehicles – full hybrid
Cattle rearing – Antimethanogen vaccine
Agriculture – Organic soils restoration Transport – Switchgrass ethanol
Cattle rearing – Grassland management
Transport – sugar cane ethanol
The potential abatement volume is significant, positioning Brazil behind only the US, China and India in terms of absolute reduction in emission volume. In percentage terms, the potential abatement is higher than the 50 percent global average. In addition, the costs associated with
the Brazilian abatement curve are low. Whereas the world average for 2030 is around �18 per
tCO2e abated for initiatives with a positive cost, in Brazil the average cost of such initiatives is
�9 per tCO2e.
Globally, the main sources of GHGs are power and transportation, which together would account for 40 percent of the BAU emissions in 2030. In Brazil, the environmental performance of these sectors is relatively good and together they account for only 13 percent of emissions. The preponderance of hydroelectric plants for power generation and the high penetration of ethanol as an automobile fuel have a positive impact on both these sectors. There are several opportunities for abatement in both these sectors but the overall impact is not large, especially
when we consider that the energy matrix is expected to remain relatively good in the base case scenario. The abatement potential in these sectors adds up to 72 MtCO2e, or 4 percent of Brazil’s total abatement potential.
Globally, the industrial sector (cement, steel, chemicals, oil & gas and other sectors) will account for 26 percent of the 2030 emissions. In Brazil, the industrial sector is less important, accounting
for only 13 percent of the emissions. This is partly the result of the way power is produced and partly due to characteristics intrinsic to industry in Brazil. This includes, for example, carbon intensity associated with domestic crude oil production, which at 18 kg CO2e per barrel of crude is relatively low. This in turn is due to the type of crude oil and environmental measures already implemented by the industrial sector. In other countries, crude oil is a much more carbon intense industry, reaching levels in excess of 70 kg CO2e per barrel of crude. Another example is Brazil’s steel industry. About 35 percent of this country’s pig iron is produced using charcoal rather than coke. If we assume that future supplies of charcoal will come from reforested or
sustainably managed sources, the environmental performance of the Brazilian steel industry could contribute to GHG abatement. Abatement initiatives for these industry sectors add up to 130 MtCO2e, or 7 percent of this country’s abatement potential.
The two sectors that depend heavily on the behaviour of the end consumer - buildings and
waste treatment – will be responsible for 7 percent and 2 percent of the world’s 2030 emissions
The most relevant sectors in Brazil, both in terms of emissions as well as abatement opportunities, are those related to land use. Some 70 percent of current and 2030 base case emissions come from forestry and agriculture, making it essential that these emissions be significantly curtailed. The relevance of agriculture comes from the fact that Brazil is a large producer of agricultural products, providing much of the world’s increasing demand for food, and leading global exports in a number of commodities such as grains (30 percent of all the soy traded worldwide) and beef (25 percent of global trade).
Agriculture, including cattle, accounts for about 25 percent of current Brazilian emissions,
a percentage that is expected to increase to 30 percent, or 820 MtCO2e by 2030. Half of the
agriculture emissions come from cattle, as enteric fermentation and organic wastes from close
to 200 million heads of cattle produce methane, one of the GHGs. The other half of the sector emissions come from farming practices such as burning off land prior to planting and excessive use of nitrogen fertilizers, leading to the formation of nitrous oxide, another GHG. Abatement opportunities in agriculture and cattle rearing are significant and account for 14 percent of this country’s total 2030 abatement potential. The initiatives identified depend on farmer training and changes in farming and cattle rearing practices, and on investments in research and specific regulations.
The largest portion, however, will come from the forestry sector. Deforestation, especially in the Amazon biome, is Brazil’s largest source of GHG emissions and responsible for 55 percent of current emissions. This percentage is expected to drop to 43 percent in 2030, based on a premise that the volume of deforestation will level off at the average level of the past 10 years as outlined in the baseline scenario defined by the National Climate Change Plan6 released
in 2008. Eliminating deforestation by 2030 accounts for 72 percent of all of the abatement opportunities in Brazil.
A lasting solution to eliminate emissions associated with deforestation requires an understanding of the socio-economic context and the economic forces at work in the destruction of forests, especially in the Amazon biome. This knowledge is essential to develop a set of initiatives that can be used to systematically address the issue, something that both the experts on the theme and the Government leaders involved have long understood.
To understand the costs associated with the initiative to preserve the Amazon forest using a sustainable development model, we have compiled numerous contributions from experts on this theme and developed a systemic approach that includes:
• (i) strengthening institutions;
• (ii) Reinforcing the command/control of the State;
• (iii) Incentives to increase the supply of timber and other forest products based on sustainable practices;
• (iv) And lastly investments to create formal jobs and improve the Human Development Index of the population affected by deforestation.
The spending associated with abatement of forestry led GHG emissions will vary over time. On average, the annual cost would be �2.5 billion7 over the course of the next twenty years for
initiatives directly related to curbing deforestation, or �5.7 billion if we include the initiatives required to increase the socio-economic development indicators of the rural population in those parts of the legal Amazon most affected by deforestation. Over time, this investment will likely be essential to give the population access to better paying jobs and promote the sustainable development of the region. This would translate into a cost per tonne of carbon close to �8 per tCO2e.
Unlike other studies, this report does not evaluate the economic value of the standing forest itself, which consists of the revenue from selling deforested timber and the alternative use of the land for faming, cattle rearing or mining. In this case, we would also have to model the negative side effects of deforestation such as, for instance, a change in the continent’s rainfall pattern across the continent. Such considerations were considered not pertinent to the central question being addressed in this project: what would it take to reduce the current level of deforestation in the Amazon?
There are also reforestation opportunities in areas where the native forest has been cut down. These opportunities could become the targets of commercial exploration, such as timber and pulp, or the recovery of legal and permanent reserves. In this case, the costs could be covered by international carbon credits and could even become an economically profitable activity.
In conclusion,
our study shows that to implement all of the identified initiatives to cut Brazil’s 2030 GHG emissions by 70 percent would require spending some �5.7 billion annually to preserve the Amazon Forest, and an amount associated with other initiatives that would increaseover time reaching �8 billion by 2030. The total spending would amount to some 1 percent of
the country’s GDP. A significant part of this cost could be funded using international carbon credits. In this calculation we have left out initiatives with a negative cost or, in other words, where the savings generated are larger than the investment required.
2.
Brazil’s base case
– deforestation in the Amazon distorts
this country’s low carbon intensity
Brazil has an important role
in the world’s greenhouse gas emissions. In 2005 it was responsible for 5 percent of the base case emissions, or 2.2 GtCO2e, making it the world’s 4th largest emitter according to the World Resources Institute. The Brazilian forestry sector isprimarily responsible for this high ranking: deforestation accounts for 55 percent of all the GHGs emitted in Brazil. According to the National Emissions Inventory published in 2006, each year 1.2 GtCO2e8 are emitted into the atmosphere by burning forests to open up cropland or by forests
that have been cut down to make charcoal for the steel industry or to provide raw material for wood products. If we were to leave out the forestry sector from the emissions inventory, Brazil would be responsible for only some 2 percent of global emissions.
A base case for how emissions will evolve has been developed to enable the assessment of the potential levers to abate carbon emissions between 2005 and 2030. This base case considers that all economic activities will see the impact of existing regulations and reflects current expectations of how market conditions will evolve. Thus, annual global emissions are expected to grow at a rate in excess of 50 percent between 2005 and 2030.
The main premises used to model the Brazil case are based on the country having a significant development potential that it is likely to capture over the coming years. For the purposes of this model, we have assumed that the population will grow on average at 0.9 percent per year through 2030, and that the GDP will grow at an average annual rate of 3.5 percent through 2015 and 2.8 percent between 2015 and 2030. This is based on the expectation that Brazilian industry will experience vigorous development, with the output of cement and steel, for instance, increasing an average of 4.2 percent and 4.6 percent a year respectively until the end of the study period. In the agricultural sector, the country would continue to have about 6 percent of the world’s pasture area and 4.3 percent of its cropland. In general, we have assumed 2005 prices and costs, US$ 60 per barrel9 of crude oil and a 4 percent annual interest.
In this base case, Brazil’s emissions would grow by only 28 percent between 2005 and 2030, as shown in Figure 3. This is because we have assumed that emissions by the main source, the forestry sector, will remain constant at the average rate measured between 1996 and 2005, the period used as the basis for comparison in the National Climate Change Plan. However, if we exclude the forestry sector from our analysis altogether, the anticipated growth in emissions in Brazil is 60 percent, higher than the global average. Much of this increase is the result of the expectation that Brazilian industry will develop intensely over the period, and a strong growth in road transportation.
8 Includes gross emissions from the First Brazilian Inventory of Atropic Greenhouse Gas Emissions using the maximum carbon intensities per biome adjusted for the average 1990 – 2005 deforestation rate for the biome.
Figure 3
However, Brazil’s accelerated economic development is based on a low emission platform. Brazil’s 2005 GHG emissions, again if we exclude the forestry sector, were 5 tCO2e per capita, bringing Brazil down to below the 100th global position in per capita intensity of GHG emissions.
In the base case, economic development will increase per capita emissions to 7,5 tCO2e, bringing this country into a position closer to the current European figure of 10 tCO2e per capita, but still far from US emissions (23 tCO2e per capita). If we include forestry sector emissions, Brazil’s per capita GHG emissions in 2005 increase to 12 tCO2e per capita, which is higher than the European average.
If we compare Brazil’s current and 2030 emissions with the rest of the world (Figure 4), we see very different behaviours. One of the main differences between Brazil and the rest of the world is that while globally, on average, emissions from the power sector are the most important (27 percent) in Brazil they have low relevance (3 percent). Road transport, another sector of extremely high relevance to the global average, is of only moderate importance in Brazil. On the other hand, agriculture and forestry, of only moderate relevance to the global average (21 percent), are the most important GHG emitters in Brazil (72 percent).
Brazilian base case GHG emissions by sector in 2005 and 2030 GtCO2e/ year
Figure 4
World
Comparison of the Brazilian and worldwide GHG emission profiles in 2030
0.07 Chemicals
0.06 Steel
Cement
0.06 Oil & Gas
0.04 Other industry
0.28 0.09 Power
0.05 Road transport
0.13
0.82 Forestry
Buildings Agriculture Waste
0.04
1,20
3.7 3.5 3.5 3.0 1.7
4.6 7.9 7.2
18.7 11.4 4.7
SOURCE: MCT, Global Abatement Cost Curve v2.0. “Pathways to a Low-Carbon Economy for Brazil” GtCO2e, direct emissions, base case, 2030
2.83
Total 69.9
Relative weight (%)
3 10
5 2 2 2 2 2 1 29 43 Brazil
3.
Details of the emissions and abatement opportunities by
sector
- While there are opportunities to reduce emissions
in all sectors, it is in the forestry sector where impact will be
greatest
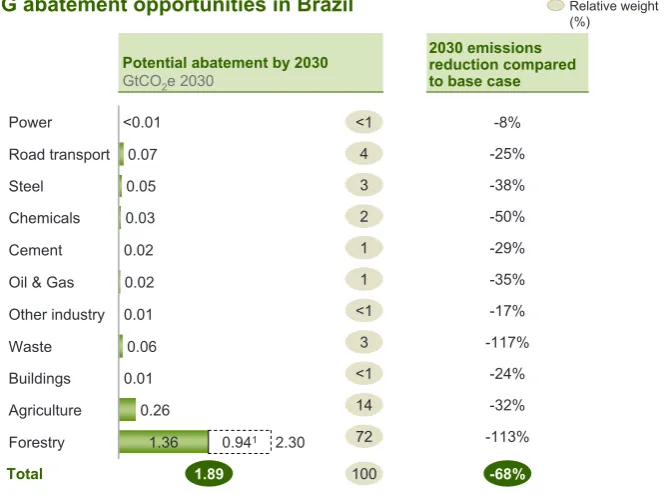
Just as the forestry sector is a weighty component of Brazil’s GHG emissions, the opportunities for abatement in this sector are just as important, as can be seen by the abatement cost curve (Figure 5). By far the largest opportunity Brazil has to reduce Greenhouse gases is to eliminate deforestation and promote reforestation of degraded land, which together account for over 70 percent of the abatement opportunity. Nevertheless, even though the other sectors analyzed, namely manufacturing industry, buildings, transportation, power and waste treatment are less important in relative terms, in absolute terms they represent a potential abatement of 530 MtCO2e per year in 2030, higher than that of several developed nations.
Figure 5
2030 GHG abatement opportunities in Brazil
SOURCE: MCT, Global Abatement Cost Curve v2.0. “Pathways to a Low-Carbon Economy for Brazil”
Relative weight (%) <0.01 Power 0.07 Road transport 0.05 Steel 0.03 Chemicals 0.02 Cement 0.02 Oil & Gas
0.01 Other industry
1.36 0.941
0.06 Waste 0.01 Buildings 0.26 Agriculture 2.30 Forestry 1.89 Total -68%
Potential abatement by 2030
GtCO2e 2030
2030 emissions reduction compared to base case
<1 4 3 2 1 1 <1 3 <1 14 72 -8% -25% -38% -50% -29% -35% -17% -117% -24% -32% -113%
1 Potential additional abatement based on extensive reforestation of degraded areas in the country
3a. Power Generation
– The power sector is responsible for
significant carbon emissions in developed nations, but in Brazil it has
an outstanding environmental performance
Brazil’s current power generation matrix is one of the cleanest in the world. Hydroelectric power plants account for 85 percent of all of the electricity generated, so Brazil emits an average of 94
t of CO2e per gigawatt hour (GWh) produced. The global average is 580 tCO2e per GWh and, in
countries that rely heavily on coal fired power plants, can be as high as 1,000 tCO2e per GWh. These emissions account for only 1.5 percent of the country’s total emissions, positioning it as one of the countries with the smallest proportion of GHGs from power generation. Worldwide, power plant emissions account for 24 percent of the total, making it the top ranked GHG emitter. The expectation is that investments will be made to increase the global penetration of nuclear, wind and solar energy, as well as biomass based cogeneration. This would bring down the global average to 170 tCO2e per GWh, still almost twice the current Brazilian average.
According to Brazil’s National Energy Plan, Brazil will more than double the amount of electricity it generates over the next 20 years. This growth, while including major investment in hydroelectricity and promoting alternative sources such as nuclear energy, will result in a power generation matrix that is more dependent on fossil fuels – 14 percent compared to the current 9 percent (Figure 6). As a consequence, sector emissions will triple, from 30 MtCO2e to 90 MtCO2e by 2030. In spite of this relatively high growth, the share of emissions from the power sector in Brazil will be around 3.5 percent, much lower than the global average.
Whilst considering opportunities to reduce emissions beyond the business-as-usual scenario it is worth noting the demand reduction expected from abatement initiatives in other sectors, which in the case of Brazil reach around 10 percent of base case generation in 2030. This reduction in demand can be either reflected in cancelling the investments in fossil fuel plants or distributed across power sources. In the first case, the Brazilian electric energy matrix would become even cleaner than it is today as shown in Figure 6. For reporting purposes we adopted the more conservative option, distributing the demand reduction across all power sources. In both cases, we also considered expanding small hydroelectric plants participation in the matrix to reduce fossil fuel penetration, as such investments are typically cost effective and
could reduce emissions by 7 MtCO2e, equivalent to some 8 percent of the base case emissions
expected in 2030.
of which Brazil is excellently placed to develop. Solar and wind energy options remain more expensive, although costs are expected to come down in future as technology evolves and players acquire scale. Additionally, Brazil could explore the option of biomass power generation more aggressively.
Figure 6
3b. Highway transportation
– High levels of ethanol penetration in
the fuel market have a positive impact on Brazil.
Highway transportation emissions, defined as the emissions of the domestic fleet of light (passenger cars), light commercial and heavy vehicles accounts for 6 percent of current Brazilian GHG emissions, behind only forestry and agriculture. Worldwide, highway transportation is the second largest sector and accounts for 13 percent of GHG emissions. In Brazil, this sector benefits heavily from the significant penetration of fuel ethanol, that represents 40 percent of the fuels market for light-duty vehicles (in energy content). Over 85 percent of all light vehicles currently sold in Brazil use flexfuel technology. By 2020, over 80 percent of the Brazilian automobile fleet should be capable of running on pure ethanol, a jump from the current 20 percent, displacing gasoline even further. In spite of this, emissions intensity from the gasoline and Diesel used in Brazil can be high due to delays in the investment needed to improve their quality, as stipulated under the Automotive Vehicle Air Pollution Control Program (Proconve).
2% 3% 2% 2% 9% 82% 15% 73% 401 2005 1% 4% 4% 3% 933 2030
1 Excludes imported power 2 Wind and solar
3 Demand reduction leading to cancelation of investments in fossil fuel plants 4 Distribution of demand reduction across all power sources
Evolution of the Brazilian power generation matrix under base case scenario and with abatement
%, TWh/year1
SOURCE: IEA WEO 2007. PNE, Global Abatement Cost Curve v2.0. “Pathways to a Low-Carbon Economy for Brazil” 2% 4% 5% 4% 4% 81% 73% 842 1% 4% 5% 3% 14%
842 Other2
Biomass Small hydro Nuclear Fossil fuels Large hydro 91
Base case 2030 with demand reduction and
increased share of small hydro
Demand reduction from abatement in other sectors
Distributed reduction4 Reduction allocated
The base case projects accelerated growth of the Brazilian fleet–115 percent between 2005 and 2030, when it will reach 49 million vehicles. Much of this growth will come from light vehicles. The increase in base case emissions between 2005 and 2030 is limited to 100 percent, reaching
280 MtCO2e due to the expected improvements in fuel quality by 2030 (Proconve), the levelling
off of ethanol use by Otto cycle engines at 46 percent10 and a 5 percent penetration of biodiesel.
This is 7 percent of all GHGs expected for 2030.
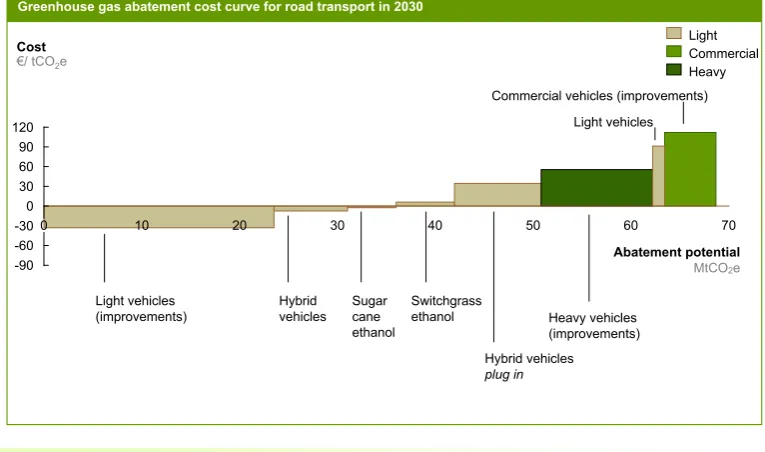
Opportunities to reduce emissions from road transportation can be split into improvements in technology and increased penetration of biofuels. Sixteen technological improvements applicable to light vehicles have been mapped. These can impact the engine, the transmission box, aerodynamics, weight and tires. In addition, we have included the penetration of hybrids (pure hybrids or plug-ins) and electric cars. Ethanol penetration will increase and includes both ethanol produced from existing sugarcane technology as well as biomass and lignocellulose ethanol, a technology expected to come on-stream after 2015. Biodiesel penetration has been limited to the base case and no additional opportunity is foreseen as this fuel competes for edible oils. In the case of heavy and commercial vehicles, opportunities will come primarily from improved technology (Figure 7). These investments should reduce anticipated 2030 base case emissions by 25 percent or some 70 MtCO2e, at an average cost of �12 per tCO2e.
Figure 7
10 In energy contained, source PNE 2030 – Empresa de Pesquisa Energética
50 60 70
0 120
0 60 90
-30 -60 30
10 20 30 40
-90
Implementing initiatives in the transport sector could reduce annual emissions by 69 MtCO2e in 2030
SOURCE: Global Abatement Cost Curve v2.0. “Pathways to a Low-Carbon Economy for Brazil”
Light Commercial Heavy
Greenhouse gas abatement cost curve for road transport in 2030
Cost
€/ tCO2e
Light vehicles (improvements)
Hybrid vehicles
Sugar cane ethanol
Switchgrass ethanol
Hybrid vehicles plug in
Heavy vehicles (improvements)
Abatement potential
MtCO2e Light vehicles
3c. Steel
– The outlook for significant expansion of Brazil’s steel
industry will lead to significantly higher emissions
Most of Brazil’s steel plants are integrated mills that emit 2.5 times as much carbon as scrap (or recycled) metal based facilities. However, Brazilian steel partially relies on charcoal (35 percent) to produce pig iron, which reduces emissions if the charcoal used comes from reforestation and not from native forests.
The base case anticipates significant growth of the steel sector, driven both by Brazil’s own development as well as the export of semi-finished goods. Production capacity is expected to reach some 95 Mt or three times the current capacity by 2030, with significant participation still from integrated plants and (reforested) charcoal pig iron.
Opportunities to reduce steel plant emissions will come from: (i) numerous initiatives to improve the energy efficiency in the production process itself; (ii) the use of renewable energy sources (replacing coke with charcoal); (iii) the use of new efficient technologies in new mills (such as, for example, integrating continuous casting and hot rolling); (iv) carbon capture and sequestration (CSS) technology (Figure 8). The more cost effective solutions are linked to energy efficiency, for example installing cogeneration facilities in new plants to use blast furnace gases to generate electricity. Other efficiency measures would include preventive maintenance, optimized process flows (management, logistics, IT), improved heat recovery, pre-heating scrap and laser based scrap analysis. Coal replacement in Brazil’s integrated steel mills will be indirect, as electric arc furnaces in the region will be encouraged to use pig iron made from charcoal up to the technically feasible limit, so that more scrap can be used by integrated mills, thereby requiring less coal.
These opportunities would cost an average of �4 per tCO2e and save some 28 MtCO2e. CCS
opportunities would cost an average of �46 per tCO2e and save some 22 MtCO2e. In all, the
Figure 8
3d. Chemicals
- The chemical industry could reduce its 2030
emissions by 50 percent
Petrochemicals are a large portion of Brazil’s chemical industry, accounting for 60 percent of its output. Forty percent of the petroleum equivalents used by the sector are used to drive its plants. Worldwide, much of the power (40 percent) used by the sector comes from natural gas, which is cleaner than petroleum and contributes to limiting chemical plant emissions. However, given the scarcity in Brazil, increasing penetration of gas beyond current levels is challenging. In Brazil, the chemical sector uses very little coal (1 percent), whereas the world average is 14 percent. Another positive factor is that in Brazil, biomass already accounts for 2 percent of the power used in the chemical sector.
In the base case, chemical sector emissions should grow 2.4 fold, given that the industry itself is expected to expand significantly. Much of this growth will come from GHGs emitted by the chemical processes themselves.
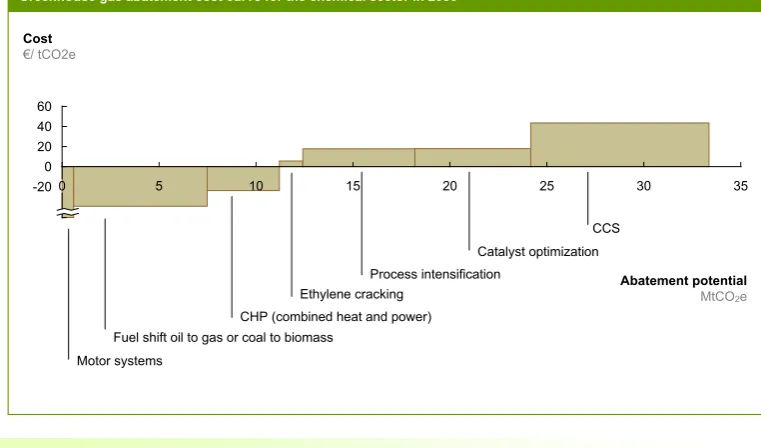
Twenty percent of the abatement opportunity in the chemical sector would come from replacing the fuel used to generate power, replacing coal and expanding the use of natural gas and biomass (e.g. sugarcane bagasse). Normally such replacements have a negative economic cost (Figure 9). Of similar importance are process related opportunities (such as improving
Implementing initiatives in the steel sector could reduce annual emissions by 50 MtCO2e in 2030
SOURCE: Global Abatement Cost Curve v2.0. “Pathways to a Low-Carbon Economy for Brazil”
Abatement potential
MtCO2e Cost
€/ tCO2e
Greenhouse gas abatement cost curve for the steel sector in 2030
-50
-100 0 50
20 30
10 40 50
0
New Retrofit
Increased energy efficiency, new Coke substitution - new
Coke substitution - retrofit
More efficient machinery and processes - retrofit
continuous processes, enhanced process control, preventive maintenance and logistics), and optimum use of catalysts to reduce direct emissions by improving the chemical structure and enhancing some chain reactions, reducing reaction temperatures at limited additional cost. These and other opportunities related to using process energy to generate heat and reduce
the volume of fuel used would add up to an abatement potential of 24 MtCO2e, at an average
negative cost of �-18 per tCO2e. Carbon capture and storage opportunities would add another
9 MtCO2e, albeit at high cost of �43 per tCO2e. In all, these 33 MtCO2e would be a 50 percent abatement of the anticipated base case chemical industry emissions for 2030.
Figure 9
3e. Oil & Gas
– Currently emissions from the Brazilian Oil & Gas
industry are low compared to other countries, and abatement
opportunities are limited
Both oil & gas production and refining emit GHGs. The relatively small amounts of GHGs emitted by crude oil exploration and development are excluded from the scope of this analysis. GHGs emitted by petrochemical plants are included in the chemical sector, those emitted as a result of the distribution of fuels are included in ground transportation and those emitted by marketing and end consumption are included under power, buildings and transportation.
CCS
Greenhouse gas abatement cost curve for the chemical sector in 2030
Implementing initiatives in the chemical sector could reduce annual emissions by 33 MtCO2e in 2030
SOURCE: Global Abatement Cost Curve v2.0. “Pathways to a Low-Carbon Economy for Brazil”
30 5
0 20 40 60
-200 10 15 20 25 35
Abatement potential
MtCO2e Cost
€/ tCO2e
Motor systems
Fuel shift oil to gas or coal to biomass
CHP (combined heat and power) Ethylene cracking
Process intensification
Compared to other countries, the Brazilian Oil & Gas sector emits only small amounts of GHGs. This is the result of the type of crude oil produced in Brazil, the technology used to produce and refine it and primarily the quality and extent of the environmental measures adopted by industry players in this country. In addition, there is also the advantage of a clean power generation matrix. More than half the Oil & Gas industry emissions come from refining, 30-40 percent come from crude oil production and the remaining 10 percent from gas distribution and processing.
In the base case, emissions would increase 50 percent by 2030, reaching 60 MtCO2e or 2 percent of all emissions. The average annual increase in the period is 1 percent, less than the expected increase in Brazil’s oil output, which is 3 percent, and is the result of the fact that new fields will naturally adopt more advanced technology and environmental efforts will continue.
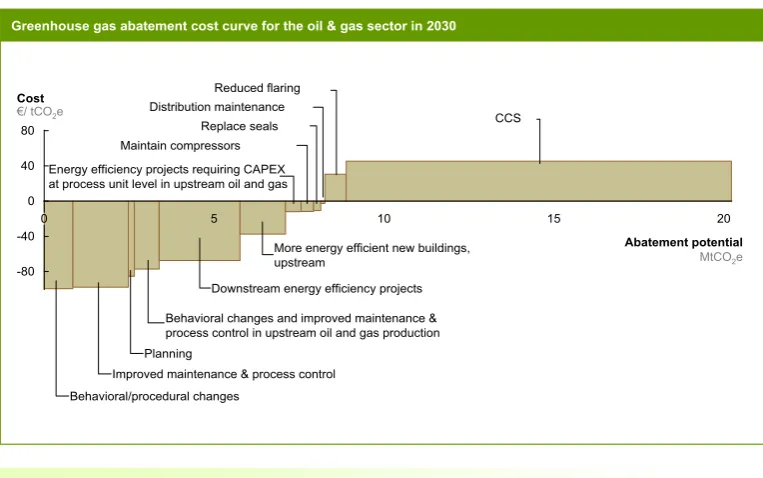
Opportunities for abatement add up to 20 MtCO2e, or 35 percent of the expected 2030 base case
emissions and 1 percent of the total GHG abatement potential for Brazil (Figure 10). About 40 percent of these opportunities are the result of refinery initiatives to use energy more efficiently, which in turn includes an increased awareness and improvement of maintenance processes (leading to optimum equipment utilization). Because of the savings this would generate, costs tend to be negative, in this case �-54 per tCO2e. The remainder of the opportunities are based on improvements in CCS, costing a significant �45 per tCO2e.
Figure 10
Greenhouse gas abatement cost curve for the oil & gas sector in 2030
20
5 10
0 80
15 Cost
€/ tCO2e
-80 40
0 -40
Implementing initiatives in the oil & gas sector could reduce annual emissions by 20 MtCO2e in 2030
SOURCE: Global Abatement Cost Curve v2.0. “Pathways to a Low-Carbon Economy for Brazil”
Abatement potential
MtCO2e
Behavioral/procedural changes
Improved maintenance & process control Planning
Behavioral changes and improved maintenance & process control in upstream oil and gas production
Downstream energy efficiency projects More energy efficient new buildings, upstream
CCS Reduced flaring
3f. Cement
– In the base case the cement industry anticipates
steeper increases in emissions between 2005 and 2030
Given that Brazil is under intense development, cement production is expected reach 2030 with an output almost 3 times that of 2005. The cement industry produces the basic input for concrete, widely used in construction and infrastructure works. Rapid growth will come with an increase in emissions, which are expected to grow 1.7 times over this period, the largest of any of Brazil’s industries.
Over 70 percent of the emissions from cement plants in Brazil are generated when limestone and clay are calcined to produce clinker, an intermediate in cement production. Replacing clinker with alternative materials such as slag from the steel industry will directly reduce emissions. A small portion of the cement sector emissions in Brazil is indirect, resulting from the use of electricity and the burning of fuels.
Figure 11
3g. Waste Treatment
– The second largest potential for abatement in
sectors not related to land use is in the waste treatment sector
Solid waste and effluent (residential sewage and industrial effluents) treatment has very significant opportunities for abatement, second only to those sectors that rely on the use of land (forestry and agriculture), and close to road transport. These wastes produce methane from the anaerobic decomposition of organic materials. Emissions from solid waste are driven by organic waste content, system humidity, weather conditions and the design of the landfill. Effluent emissions (methane and nitrous oxide) tend to be more intense in countries where treatment and collection systems are in the early stages.
Brazil has the world’s 5th largest population, and penetration of residue collection and treatment is relatively low. Waste emissions contribute 53 MtCO2e, placing Brazil among the global top 10. The base case scenario for 2030 projects a moderate 26 percent growth of these emissions compared to 2005, taking into account the various ongoing initiatives to treat landfill gases.
In the analysis of these abatement opportunities we included solid waste pre-treatment (recycling and composting) and treatment (e.g. collecting landfill gases). The abatement of GHGs emitted from effluent treatment has not been assessed due to lack of information.
Greenhouse gas abatement cost curve for cement in 2030
0 5 10 15
0 80
40
-40
-80 Cost
€/ tCO2e
Abatement potential
MtCO2e
Implementing initiatives in the cement sector could reduce annual emissions by 16 MtCO2e in 2030
SOURCE: Global Abatement Cost Curve v2.0. “Pathways to a Low-Carbon Economy for Brazil” Clinker substitution by Other MIC
Clinker substitution by fly ash Alternative fuel - waste
Clinker substitution by slag
Post combustion CCS - retrofit Post combustion CCS- new capacity
Brazil has the opportunity to totally displace these emissions, especially through initiatives to recycle any new solid wastes generated (Figure 12). These initiatives, such as reusing metals and papers as inputs in their own production chains, would cover 75 percent of the potential sector abatement. Composting new solid waste would add another 2 percent of abatement. The remaining 23 percent of the opportunity is related to more intense use of landfill gases (either directly or to generate electricity). Typically, the cost of these initiatives is negative, or around
�-15 per tCO2e, due to the revenue from these activities. However, success depends primarily on changing behaviour and getting people and companies to develop a culture of recycling. Technology barriers are currently considered minimal and could be completely eliminated by 2030.
Figure 12
3h. Buildings
– The buildings sector has the most cost effective
opportunities, but the potential for abatement is limited
Residential and commercial buildings will account for only 1 percent of the expected base case emissions in 2030. On a global average, the sector is responsible for 7 percent of the emissions. Brazil is at an advantage primarily because of its tropical climate, with less energy used to heat buildings and water. However, some 50 percent of the lamps used in this country are still incandescent lamps, and there has been an increase in the penetration of electronic goods, as the lower income segments of the population quickly gain access to credit, all of which drive up power consumption.
0 10 20 30 40 50 60
0
-20
-40 20
Implementing initiatives in the waste treatment sector could reduce annual emissions by 63 MtCO2 e in 2030
Abatement potential
MtCO2e
Cost
€/ tCO2e
SOURCE: Global Abatement Cost Curve v2.0. “Pathways to a Low-Carbon Economy for Brazil”
Greenhouse gas abatement cost curve for waste treatment in 2030
Landfill gas direct use
Recycling new waste
Landfill gas electricity generation
In the base case, emissions by the Brazilian building sector would grow 43 percent to 36 MtCO2e by 2030. About 65 percent of the emissions come from residences, where almost 25 percent of the power consumed is in the form of electricity, and 75 percent is in the form of liquefied petroleum gas (LPG) used for cooking. Compared to the global average, the penetration of natural gas in Brazilian residences is extremely low (less than 1 percent). The commercial segment (offices and public buildings) is responsible for the remaining 35 percent of the emissions, and here electricity is the major component and accounts for about half of this total.
There is the opportunity to abate some 8.5 Mt of the CO2e emitted by the sector, 25 percent of which by improving lighting systems, and another 25 percent by switching water heating systems in homes and commercial buildings (Figure 13). Opportunities in lighting include switching incandescent and compact fluorescent lamps (CFL) for much more efficient light emitting diodes (LEDs). LEDs produce 150 lumens per watt (lm/W), whereas CFLs produce 60 and incandescent lamps 12 lumens per watt. In water heating, the opportunities are in replacing electric or gas systems with solar energy, saving up to 85 percent of the power used. Another 20 percent of the opportunity is related to the gradual replacement of existing white goods and consumer electronics with more energy efficient ones, a potential energy saving of 35 percent. Energy efficiency packages add another 20 percent potential abatement by reducing the demand for energy through improved thermal insulation and internal air flows in new buildings, as well as more efficient building materials and techniques to put up walls, roofs, floors and windows.
Figure 13
3i. Agriculture
– Agriculture is the second largest emitter, behind
only forestry. There is high potential to reduce the GHGs emitted by
this activity, but implementation is challenging.
Agriculture is Brazil’s second largest GHG emitter and will account for 29 percent of the base case emissions in 2030. At 820 MtCO2e, it is second only to forestry. Typically, agricultural activities emit nitrous oxide (46 percent of all agricultural emissions worldwide) and methane (54 percent) rather than carbon dioxide. A number of the abatement opportunities are related to carbon sequestration.
In Brazil, the main agricultural activity that gives rise to GHGs is cattle rearing and is the result of enteric fermentation and residues deposited on pastures. These account for more than 50 percent of the emissions. Another portion is the result of farming practices such as managing soil nutrients (for instance excessive use of nitrogen) and burning waste (e.g. sugarcane farms). The sheer volume of these emissions is such that Brazil contributes 10 percent of all of the GHGs coming from agriculture, and is second only to China.
Given expected growth in agricultural activities in the base case, these emissions are expected to grow by 40 percent between 2005 and 2030. Cattle rearing accounts for 37 percent of the
Greenhouse gas abatement cost curve for the buildings sector in 2030
Implementing initiatives in the buildings sector could reduce annual emissions by 8.5 MtCO2e in 2030
Cost
€/ tCO2e
Commercial Residential
SOURCE: Global Abatement Cost Curve v2.0. “Pathways to a Low-Carbon Economy for Brazil”, IEA
-49 0 1 -350 4 3 5 2 -700
6 7 8
0 Switch incandescent to LEDs Switch CFLs to LEDs Electronic consumer
Lighting new build controls Appliances Electronics -office Appliances -refrigerators
Retrofit HVAC - air conditioning
Lighting retrofit controls
Switching from electric to solar water heating
Switching from T12 light to T8/T5 Retrofit HVAC controls Building envelope retrofit Retrofit air conditioning maintenance Air conditioning retrofit Aggregated new build efficiency package
Water heating – switching from gas to solar
Abatement potential
expected growth. Soil emissions are expected to grow at a much faster pace - 90 percent - and by 2030 their share will be similar to that of cattle rearing activities. Emissions from farming practices such as burning wastes should remain flat over the period, which means their share of total agricultural emissions should drop from 30 percent to 21 percent.
Base case estimates bear in mind three factors that are of relevance for the domestic and international markets: (i) population growth (25 percent worldwide between 2005 and 2030); (ii) global development resulting in an increase in per capita GDP; (iii) changes in eating habits with a consequent increase in the consumption of animal protein. The base case does not take into account the potential consequences of climate change which could affect agricultural output (e.g. rain cycles), given that the magnitude of such impact is still uncertain. The base case does include the effects of carbon storage associated with larger crop areas. Related emissions reflect the best scientific work available by the time of publication of Brazil’s Initial Communication to the United Nations Framework Convention on Climate Change, but as in other sectors, some uncertainties exist.
Figure 14
Another 26 percent of the potential abatement is related to initiatives to recover farm soil, often degraded due to excessive or improper use, erosion, the loss of organic material, high salt contents or low pH. Soil productivity can be recovered by planting pasture. Soils can be made more fertile by proper nutrient selection, the application of organic substrates such as some wastes or composts, less tillage (direct planting), keeping farm wastes on the soil and moisture retention. Industry estimates show that 26 million hectares (Mha) in Brazil already use direct planting, a practice that reduces soil degradation. This high level of penetration is considered in
the base case. However, Embrapa and FAO11 estimates show that there are some 100 Mha to
188 Mha of degraded soil in Brazil, mostly in the Cerrado region and along the coast. In addition, there are opportunities associated with the recovery of flooded areas (organic soil). Draining these areas for farming tends to emit nitrous oxide and carbon dioxide.
The remaining opportunities are distributed in the form of better farm nutrient management, including rice (evaluated separately due to its significance in other countries) and waste management practices.
The average cost of the initiatives in the agricultural sector is low, expected to average around
�2 per tCO2e in 2030. Little investment is required and it will be mostly enabled through small changes in current farming practices. This estimate excludes the need for training, incentives/
11 Bai ZG, Dent DL, Olsson L and Schaepman ME 2008. Global assessment of land degradation and improvement 1: identification by remote sensing. Report 2008/01, FAO/ISRIC – Rome/Wageningen.
Greenhouse gas abatement cost curve for the agriculture sector in 2030
40
-20 0 250
-40
-60
50 100
Cost
€/ tCO2e
150 0
20
200
Implementing initiatives in the agricultural sector could reduce annual emissions by 262 MtCO2e in 2030
Tillage and residue management practices Cropland nutrient management
Grassland nutrient management Rice management - shallow flooding
Rice management - nutrient management Grassland management
Organic soils restoration
Cattle rearing – Antimethanogen vaccine Agronomy practices Degraded land restoration
Cattle rearing - Feed supplements
SOURCE: Global Abatement Cost Curve v2.0. “Pathways to a Low-Carbon Economy for Brazil”
Abatement potential
fees or monitoring tools. Even so, preliminary quantitative estimates show that the additional cost would be limited to �1 per tCO2e. There are barriers to implementing these initiatives in that the farming sector is highly fragmented. In a number of areas agriculture is merely for subsistence, and in this case using climate change as a motivator is not very efficient.
3j. Forestry
– Most of the opportunities for GHG abatement in Brazil
are in the forestry sector, and include both reducing deforestation
and recovering degraded areas. However, the implementation of
structural initiatives in the region is complex.
The forestry sector has received much of the attention of the Brazilian climate change agenda. This is not only due to the volume of GHGs emitted by deforestation, but also because of other negative effects such as the loss of biodiversity and changes in rainfall patterns. In addition, Brazil has the word’s largest inventory of tropical forests (~460 Mha), more than half the world total. It is also the country with the highest absolute deforestation rate with an average of 1.9 Mha deforested per year in the region in the period of 1996-2005, the timeframe analyzed by the National Climate Change Plan. The Amazon forest biome analyzed in this plan has the highest rate of deforestation and the highest carbon inventory in Brazil.
Recently the government has taken a number of initiatives to reduce deforestation; of special importance is the Action Plan to Prevent and Control Deforestation in the Legal Amazon
(PPCDAM)12, which was able to reduce the area deforested each year by 60 percent between
2003 and 2008. Secondly there is the December 2008 National Climate Change Plan13 that
aims to gradually reduce deforestation until it is completely eliminated in 2040.
Because of the historical occupation model for the Amazon, the population in the region has over the past 30 years grown from 10 to 25 million. Some 6 million live in rural areas and around 700 thousand are engaged directly in forest destroying economic activities like timber logging or cattle ranching.
Experts who have dedicated decades to this theme as well as government leaders who must address this challenge in practical terms contend that there must be a systemic approach to eliminate deforestation related emissions. This systemic approach focus on creating formal employment options and a range of products based on legal activities that use sustainable practices. An important part of any solution to this puzzle is also likely to be a stronger presence for public institutions, starting with the effective implementation of land titling efforts.
12 Plan drafted by the Permanent Interministerial Working Group to Reduce Deforestation in the Legal Amazon. This is a Federal Government plan Coordinated by the Office of the Chief of Staff
To understand the costs associated with the initiative to preserve the Amazon forest using a sustainable development model, we have compiled numerous contributions from experts on this theme and developed a systemic approach that includes:
• (i) Strengthening institutions;
• (ii) Reinforcing the command/control of the State;
• (iii) Incentives to grow sustainable practices;
• (iv) And lastly investments to create formal jobs and improve the Human Development Index of the population in the rural area (Figure 15).
Figure 15
There are some prerequisites that are likely to need to be put in place if any deforestation effort is to be effective over the long term. First, this is likely to include solid land ownership regulations. In other words, we must know who the land belongs to before the law can be enforced, and certainly before we can expect to attract formal and serious businesses to the area. Today, less than 10 percent of the area has clear land title. In addition, law enforcement must be present and enforced in the field, with more police and a more efficient judiciary system. We estimate these efforts would require some �1 billion per year14 (Figure 16).
14 At an exchange rate of 3 R$/� for initiatives to curtail deforestation.
Incentives
Development
Institutions strengthening
Monitoring/ enforcement
A
B
C
Environmental enforcement 4
Origin assurance 5
Forest stewards 6
Payments for forest maintenance & recovery 7
Subsidies/Financial aid for alternative products 8
Penalties for non sustainable activities
9
Land tenure 1
Law enforcement
2
Judiciary
3
Economic development
10
11 Social development
D
SOURCE: “Pathways to a Low-Carbon Economy for Brazil”
Initiatives to preserve the Amazon forest
Figure 16
Stronger institutions will increase the probability of successfully implementing and capturing the benefits of monitoring and control initiatives. We have analysed a set of ideas proposed for the category and estimate that effective oversight would be possible at an annual investment of around �0.5 billion. For example, effectively monitoring existing parks would likely require three times the current number of agents. Implementing intelligent systems to track cattle and timber are also critical to successful government monitoring and control. Finally, there will be a need to compensate traditional communities for their monitoring effort, something that is already being done but could be expanded.
It is not enough to put pressure on the causes of deforestation. In some regions, activities associated with deforestation are essential to the local economy. Incentives for new production chains that can replace the existing ones will need to be created. Specifically, support would be required for the creation of formal activities along the cattle and lumber chains, such as sustainable and certified handling, and more intense cattle farming and enhanced pasture management, which would enable doubling the output using the same area. Initiatives such as these would enable increasing the output of these production chains without deforestation. They would also increase formal employment and tax revenue for the government. There is also the option to implement mechanisms to pay land owners who opt to preserve their forested
land for the provision of environmental services. We estimate that some �0.8 billion would be
required each year for incentives and to pay for environmental services of this nature Annual cost of the 5-front effort required to avoid deforestation of the Amazon forest
ESTIMATE
SOURCE: “Pathways to a Low-Carbon Economy for Brazil”
0,5
1,5
1,8
5,7
0,8
1,1
A Institutions strengthening
B Monitoring/ enforcement
C Incentives
Economic Social Total cost
D Development
According to our model, the spending associated with abatement of forestry emissions will vary over time as some of it is for structural investments and some is for recurring expenses. On average, the annual cost over the next twenty years will be �2.4 billion. We believe that it is technically possible that twenty years will be sufficient to eliminate deforestation in Brazil. Assuming a linear reduction in deforestation over this period we arrive at an average cost per tonne of CO2e not emitted of �3.5. After this initial twenty year period we would assume that the costs associated with fighting deforestation would be much smaller, as all structural investments would have been made and a new sustainable economy will be in place.
In addition to initiatives designed to specifically reduce deforestation, we believe it is important to ensure in the long term a certain level of economic and social development in the less favoured areas of the Brazilian North, as well as in the emigration poles for this region. In addition to the sustainable rural activities mentioned above, we would also have to create higher value added jobs in the smaller cities and towns and increase the investment in basic services such as healthcare and education in the Amazon so as to improve the population’s human development index. Over the long term this investment will be essential to give the population access to better paying jobs and promote the sustainable development of the region. We estimate this would add an incremental cost of �3 billion per year. This could be recorded as an expense the country must face in order to bring a less developed area up to the national average, or included in the overall balance sheet associated with reducing deforestation. If, as a nation, Brazil selects the second option, the total annual cost to avoid the 0.8 GtCO2e emitted each year from deforestation of the Amazon biome will be �5.7 billion, or �8 per tCO2e.
Figure 17
Greenhouse gas abatement cost curve for the forestry sector in 2030
0 100 200 300 400 500 1.000 1.100 1.200 1.300
0
900 800 700 600 10
15 20 25
5 Cost
EUR/tCO2e
Implementing initiatives in the forestry sector could reduce annual emissions by 1.36 GtCO2e in 2030
Reduced deforestation outside the Amazon
SOURCE: Global Abatement Cost Curve v2.0. “Pathways to a Low-Carbon Economy for Brazil”
Abatement potential
MtCO2e Forest management
Cropland reforestation
Degraded forest reforestation
Pastureland reforestation
The 30 percent of GHGs emitted by deforestation in areas outside the Amazon are, for the most part (80 percent), the result of deforestation in the Cerrado and Pantanal regions. We estimate the annual cost of curtailing deforestation in other regions would be �600 million, or
�1.8 per tCO2e. The cost is smaller than it is in the Amazon biome because it does not include investments in economic and social development, or the strengthening of institutions. Figure 17 illustrates the cost curve for all forestry sector initiatives.
Recently implemented efforts show commitment on the part of government and private entities to curtail deforestation. In the government sphere we point to major efforts made to create conservation areas, new regulation that limits credit for properties that have environmental liabilities, new credit facilities for reforestation and State programs to systematically fight deforestation. There are also initiatives to reduce the consumption of illegal timber, such as the new Caixa Econômica Federal Standards for mortgage approval, and the new law passed by the State of São Paulo to encourage the sustainable use of timber. Finally, private enterprise is also undertaking important efforts such as the Soy Moratorium15.
Finally we point to the creation of the Amazon Fund, which may be an important vehicle to support systemic initiatives to reduce deforestation and promote sustainable development in the region.
In addition to opportunities to reduce deforestation related GHG emissions, we have included opportunities in reforestation of the areas surrounding pasture and cropland, forestry management (for instance fire control), and reforestation of degraded areas, totalling 0.75 Mha of additional forest each year, or 16 Mha planted by 2030. These initiatives represent a carbon storage opportunity equivalent to 158 MtCO2e, 13 percent of the total abatement opportunity in forests, at an average cost of �9 per tCO2e.
This volume of reforested land is conservative when compared to the potential Brazil has to use degraded areas for carbon storage reforestation. Although no official number exists, Embrapa and FAO indicate that there are some 100 Mha to 188 Mha of degraded land in the country. There is a significant potential in reforestation, especially in the Amazon where forests grow at a faster rate than anywhere else in the world. This could include a combination of commercial forestry operations, where Brazil already leads the world in pulp production and could consolidate itself as the world leader in wood products, and reforestation using native species to permanently restore legal reserves not for commercial use.
This not-for-profit reforestation could be funded using international carbon credits. This mechanism is already operational on a small scale and the expectation is that it will increase rapidly, given that opportunities to reduce GHG emissions at lower costs are limited. By 2030 there will be 9 GtCO2e for which there is no abatement option costing less than �60 per tCO2e.
This will require implementing new, higher cost technologies or sequestering the emitted carbon. Given this context, reforestation is a very attractive option. If we assume that by 2030, 25 percent of this volume (2.3 GtCO2e per year) will be captured by 230 Mha of reforested area all over the
world, and that the average price of a carbon credit will be �20-30 per tonne, we arrive at a
market worth close to �25-30 billion a year. Brazil is very well positioned to capture an important share of this market.
4.
Implications
– The need to invest, to mobilize players and
the implications for society at large are concentrated in the
forestry sector
Although
our study is not intended as a detailed roadmap to a low-carbon society in Brazil, it does make it clear that it is entirely possible to achieve this. It is up to Brazil, as a society, to find the path to make this future happen for the next generation. Our cost curve shows that the cost of implementing the necessary initiatives in all sectors except for forestry would require an annual spending that would grow over time to reach �8 billion by 2030. In this calculation we have left out initiatives with a negative cost or, in other words, where the savings generated are larger than the investment required.The estimated annual cost to preserve the Amazon forest varies between �2.4 and �5.7 billion, depending on whether or not economic and social development costs are included, in addition to those directly associated with curbing deforestation.
Thus the total cost for implementing all of the initiatives required to reduce Brazil’s GHGs vary over time, but would be somewhere around 1 percent of the country’s GDP. A significant part of this cost could possibly be funded using international carbon credits.
In addition to the cost of reducing emissions, we have identified that Brazil potentially has a major opportunity in the reforestation of degraded areas to obtain carbon credits. This market is still incipient, but the scenario is ripe for rapid growth if international regulation evolves favourably.
Appendices
Appendix 1
– Model approach
To arrive at these conclusions, the costs and abatement potential of more than 100 abatement measures across six industry sectors have been analyzed using a four step process. First, a ‘business-as-usual’ baseline was determined using current trends applied to current and future emissions. Second, a range of emission reduction opportunities was identified and fact-based estimates were made of the costs and potential abatement volume presented by eac