Full Terms & Conditions of access and use can be found at
http://www.tandfonline.com/action/journalInformation?journalCode=vjeb20
Download by: [Universitas Maritim Raja Ali Haji] Date: 11 January 2016, At: 22:30
Journal of Education for Business
ISSN: 0883-2323 (Print) 1940-3356 (Online) Journal homepage: http://www.tandfonline.com/loi/vjeb20
Hispanic College Students’ Perceptions of
Members of Business Occupations: An Exploratory
Study
Suzanne N. Cory , Ellen Wall Mullen & Thomas Edward Reeves
To cite this article: Suzanne N. Cory , Ellen Wall Mullen & Thomas Edward Reeves (2009) Hispanic College Students’ Perceptions of Members of Business Occupations: An Exploratory Study, Journal of Education for Business, 85:3, 125-131, DOI: 10.1080/08832320903252447 To link to this article: http://dx.doi.org/10.1080/08832320903252447
Published online: 08 Jul 2010.
Submit your article to this journal
Article views: 25
CopyrightC Taylor & Francis Group, LLC ISSN: 0883-2323
DOI: 10.1080/08832320903252447
Hispanic College Students’ Perceptions of Members
of Business Occupations: An Exploratory Study
Suzanne N. Cory, Ellen Wall Mullen, and Thomas Edward Reeves
St. Mary’s University, San Antonio, Texas, USA
The authors explored freshmen Hispanic and non-Hispanic White student perceptions of the members of three different business occupations: bankers, accountants, and marketing managers. Usingttests, some differences were found between the two ethnic groups regarding perceived individual characteristics of members of the occupations, but the application of a supervised learning technique to identify the ethnicity of respondents, based on these results, was not successful. Chi-square tests indicated that student responses were often related to whether they knew someone practicing the occupation. The authors offer suggestions for helping students obtain a more accurate understanding of bankers, accountants, and marketing managers.
Keywords: Occupational perceptions, Hispanic college students, Supervised learning
Hispanics have become the fastest growing ethnic group in the United States. According to the U.S. Census Bureau, there are currently 44.3 million Hispanics living in the United States, representing 15% of the population. This number is projected to skyrocket to 102.6 million, or 24% of the population, by 2050. One of the most notable things about the Hispanic pop-ulation is its youth. The median age of Hispanics in 2005 was 27.2 years, compared with 36.2 years for the population as a whole. Although about half the nation’s Hispanics live in two states—Texas and California—their population is spreading and large numbers are settling in communities in the United States where few Hispanics have settled before, including Kentucky, Minnesota, Nebraska, and Alabama. Their influ-ence is now felt “from the Mexican border to Minnesota [and] from California to the Carolinas” (Schmidt, 2007, p. 169).
In addition, the number of Hispanics seeking higher ed-ucation in the United States is greater than ever before. The number of Hispanics enrolled in U.S. colleges has increased more than threefold since 1980 (Schmidt, 2007), and more than 240 U.S. colleges are now designated as Hispanic-serving institutions, indicating that at least 25% of their en-rollment is Hispanic. As more business schools target His-panic students for recruitment and the numbers of this ethnic group in colleges and universities expand, educators with
Correspondence should be addressed to Suzanne N. Cory, Depart-ment of Accounting, Bill Greehey School of Business, St. Mary’s Uni-versity, One Camino Santa Maria, San Antonio, TX 78228, USA. E-mail: scory@stmarytx.edu
an improved understanding of these students will be better prepared to meet their needs.
Given possible cultural differences between Hispanics and non-Hispanic Whites, Leppel (2001) was concerned about whether Hispanics are likely to consider a major in business. If not, then business schools could be at a serious disadvan-tage as they scramble to attract a portion of the burgeon-ing number of Hispanic college students to major in one of their business disciplines. However, Leppel concluded that Hispanics were more likely to major in business than non-Hispanic Whites, which, based on their projected population increase, is predicted to expand their college enrollment and fuel future growth for many business schools. However, Lep-pel did not investigate which discipline within business may be more attractive to Hispanic students.
Methods used for students to select college majors have been studied previously (Cohen & Hanno, 1993; Kim, Markham, & Cangelosi, 2002; Lackland & DeLisi, 2001; Leppel, Williams, & Waldauer, 2001; Porter & Umbach, 2006). Robertson (2000) determined that students use many factors when selecting their courses, including work ex-perience, interest and success in previous similar courses. Boudarbat (2008) determined that anticipated earnings in their field of choice had a significant influence on Cana-dian community college students’ choice of major and that students who had been employed prior to beginning their academic careers were more responsive to earnings vari-ations than were students who had no prior work expe-rience Others have more narrowly focused attention on
126 S. N. CORY ET AL.
student selection of discipline within the business school (Malgwi, Howe, & Burnaby, 2005; Noel, Michaels, & Levas, 2003; Pritchard, Potter, & Saccucci, 2004; Strasser, Ozgur, & Schroeder, 2002) but no agreement about the determining factor(s) used to make this choice has been achieved.
Investigation of role models has determined that they can often directly influence individuals’ career aspirations (Hackett, Esposito, & O’Halloran, 1989; Nauta, Epperson, & Khan, 1998). Role models and the influence of mothers and other family members have been found to significantly influence the educational and career aspirations of Hispanic women, (Cardoza, 1991) and Flores and Obasi (2005) re-ported that mentors and role models were instrumental in af-fecting the career decisions of Hispanic high school students. Ceja (2004) completed qualitative interviews with Chicana high school seniors and found a noteworthy role of parents in the development of their career aspirations.
The influences of others on college students’ choice of major has been studied, but only in a very limited manner with Hispanic students. The focus of much research using Hispanic students as subjects often deals more with them simply attaining a college degree of any sort. One stream of research addresses issues that tend to affect Hispanic students more than others, such as the added challenges many of them face because of getting minimal support from friends and family in their pursuit of a college degree (Pluviose, 2007), their tendency to be at risk for finishing high school (Sol-berg, Carlstrom, Howard, & Jones, 2007), or their notable reliance on 2-year colleges for starting their postsecondary education (Gonzalez & Hilmer, 2006). Additionally, as noted by Rivera, Blumberg, Chen, Ponterotto, and Flores (2007), research on Hispanics has primarily focused on Mexican American women. Johnson-Bailey (2004) studied retention and participation issues affecting Black female graduate stu-dents enrolled in programs within a college of education. They found that one of four factors influencing retention was networking by Black students, but no evidence was provided indicating this may also have influenced choice of major.
As indicated previously, although the focus of much re-search has dealt with the unique challenges Hispanic students face in their academic careers, little has been done to deter-mine why Hispanic students chose a college major or if their decisions are driven by different information than that of non-Hispanic White students. In general, major selection seems to be driven by many factors, including role model influence, previous work experience, family culture, and mentors, as well as job availability, earnings potential, interest, and apti-tude in the subject matter. Sapti-tudents have many methods for gathering information about potential majors, one of which may be their perceptions about individuals currently practic-ing the occupation.
It is possible that college students have preconceptions about members of occupations as they begin their academic career. These preconceptions, or stereotypes, may actually impact their decision about their choice of major. According
to Ashmore and Del Boca (1981), a stereotype is a set of beliefs about the personal attributes of a group of people. In-dividuals simplify and conserve mental resources when they use stereotyping. According to Macrae, Milne, and Boden-hausen (1994), stereotypes are used for filtering, organizing, and remembering information. Some feel that occupations tend to attract individuals with certain characteristics. For example, many individuals may have preconceptions about the attributes of accountants, computer programmers, engi-neers, social workers, or insurance agents. However, these preconceptions may be misconceptions. Given that Hispan-ics now represent 11% of the college-aged population in the United States, getting an idea about their stereotypical views of selected business occupations, as compared with non-Hispanic White students, may be useful as colleges try to attract more Hispanics to major in business disciplines.
Little work has been done that targets Hispanics in this manner and not many studies specifically use Hispanic stu-dents as participants. Exceptions include Leppel (2001), who explored the impact of Hispanic ethnicity on the business ma-jor, and Landry, Moyes, and Cortes (2004), who examined ethical perceptions of Hispanic students by major and by gen-der. Erlach (2000) addressed the problem of few Hispanics in the United States professoriate to serve as effective role mod-els for aspiring Hispanic students. Most previous research has dealt with Hispanic consumer choice and marketing issues (Hernandez, Cohen, & Garcia, 2000; Kara & Kara, 1996), their job satisfaction (Moyes, Owusu-Ansah, & Ganguli, 2006), and especially Hispanic entrepreneurs (Shim & East-lick, 1998; Shinnar & Young, 2008; Smith-Hunter, 2006).
The present study was designed to investigate whether differences exist in Hispanic and non-Hispanic White un-dergraduate students’ perceptions of personality traits of the members of three different business occupations. The pro-fessions studied were bankers, accountants, and marketing managers.
METHOD
A semantic differential instrument, similar to the instrument used by Cory, Beer, Reeves, and Nouyrigat (2006), Beer and Cory (1996), Davidson and Etherington (1995), and Cory (1992) was designed to gather information about students’ perceptions of the personality traits of members of three oc-cupations: bankers, accountants, and marketing managers. These occupations were selected based on statistics pub-lished by the Department of Labor indicating the majority of business students find jobs in finance, banking, and as stockbrokers as well as in service areas, including account-ing and marketaccount-ing. Additionally, these occupations were used by Cory and we felt the students in the present study should be familiar with them.
Students were presented with 15 pairs of personality traits which could be descriptive of a member of each of the three
Very Fairly Slightly Neither Slightly Fairly Very Aggressive _____ _____ ______ ______ ______ ______ ____Timid
FIGURE 1 Rating scale.
occupations. Each pair of terms was separated by a 7-line measuring stick and students chose which of each pair of words they felt was more descriptive of a member of the occupation indicated. Students were told to think of a mem-ber of the respective profession and then to place a mark between each pair of descriptive terms, based on the strength of the occupation’s association with the term. For example, Figure 1 shows how the terms “Aggressive” and “Timid” were presented to the students.
If the term on the left was selected, the response was coded as 3, 2, or 1, based on the strength indicated (i.e., very, fairly, or slightly, respectively) and –3, –2, or –1 if the term on the right was selected, again based on the strength indicated (i.e., very, fairly, or slightly, respectively). If the response was “neither,” the response was coded as zero. The terms and coding methods were the same as those used by Cory (1992).
First,tscores were computed to determine whether differ-ences occurred between the Hispanic and the non-Hispanic White students’ perceptions of these personality traits. The
t statistic is a means test used to identify whether a given trait is significant on a univariate basis but does not pro-vide information on these personality traits taken as a whole. Therefore, to further investigate our findings, a supervised learning technique (Roiger & Geatz, 2003) was used to ana-lyze the data. Supervised learning is a process of forming a general concept definition by observing specific examples of the concept to be learned. Individuals use models that help them identify objects of similar structure, which is called induction-based supervised learning.
Supervised Learning
Supervised learning has two purposes. First, supervised learning is used to build classification models from sets of data that have examples and nonexamples of the concepts in-dividuals want to learn from. Each example or nonexample is called an instance of the data. Second, once a classification model is built, the model is used to define a newly presented instance into a category. Further, supervised learning models are designed to classify, estimate, or predict future outcomes. The data are divided into two sets. One set is called the train-ing set and these data are used to train the model. The second set is called the test set and these data are used to see how well the model classifies the data. The goal is to build clas-sification models that show consistency and have high pre-dictive accuracy. Classification correctness is best calculated by presenting previously unseen instances as a test data set. The predictions of the test data can be summarized in a table known as a confusion matrix, which is shown in Figure 2.
C1 C2
C1 C11 C12 C2 C21 C22
FIGURE 2 Two-class confusion matrix.
Values along the main diagonal represent correct classi-fications. For the confusion matrix, the value C11represents the total number of class C1instances correctly classified by the model. A similar statement can be made for the value C22. Values in row Cirepresent those instances that belong to Ci. For example, fori=1, the instances associated with cells C11and C12are all actually members of C1. To find the total number of C1instances incorrectly classified as members of Class 2, refer to C12. Values found in column Ci indicate those instances that have been classified as members of Ci.
Withi=1, the instances associated with C21have been clas-sified as members of class C1. To find the total number of instances incorrectly classified as members of class C1, refer to cell C21.
The supervised data-mining process used in this study was performed using the iDA software package, a Microsoft Excel add-on. The iDA package uses examples from the data to learn and categorize or cluster cases without making any assumptions about the data. When learning is unsupervised (no restrictions on the number of clusters by the user), sev-eral optimizing heuristic evaluation functions are used to cluster input data into naturally occurring groups. This is a process similar to that used in human learning. Research has shown that much of human learning involves the storage and retrieval of data records or instances of data of learned concepts. Humans use these examples to categorize newly encountered instances of unknown origin. The data-mining tool used in the present study works in a similar fashion by using examples stored in categories (Roiger & Geatz, 2003). After using supervised learning, the Chi-square statistic was then computed to determine whether Hispanic and non-Hispanic White students’ answers varied based on whether they actually knew someone practicing the occupation. The goal in this case was to determine whether student responses may be influenced based on their acquaintance with someone in the occupation.
Sample
Students from three different U.S. universities participated in the present study. One university was located in the West, one in the Southwest, and one in the East. We selected these universities based on their diverse student body and faculty. A total of 510 responses were received, of which 404 were completed by Hispanic or non-Hispanic White students. However, because the focus of the present study was individuals who had just begun their college studies and also had limited exposure to working life, attention was fo-cused on Hispanic and non-Hispanic White students who
128 S. N. CORY ET AL.
TABLE 1
Gender and Ethnicity of Respondents Students No Older Than 19 Years of Age
Group Non-Hispanic White Hispanic Total
n % n % n %
Men 40 13.38 77 25.75 117 39.13
Women 62 20.74 120 40.13 182 60.87
Total 102 34.11 197 65.89 299 —
were no older than 19 years of age. This reduced the sample size to 299 respondents. As shown in Table 1, there were 197 usable responses from Hispanic students and 102 from non-Hispanic White students. Just over 60% of the respon-dents were female. These sturespon-dents were on the threshold of their academic careers and, as a general rule, should have some familiarity with the three business professions being studied.
RESULTS
As shown in Table 2, the set of terms was provided to all respondents for each of the professions.Ttests were used to identify differences in term rankings between the Hispanic students and the non-Hispanic White students for each of the three business professions. A negativetscore indicated that the mean average for Hispanics was higher than that for non-Hispanic Whites, and a positivetscore indicated the opposite. Hence, the Hispanic students felt bankers were more unam-bitious, impulsive, impatient, and awkward, and that accoun-tants were more imaginative, confused, impulsive, rebellious, and optimistic than did their non-Hispanic White counter-parts. Finally, Hispanics felt that marketing managers were
more uncertain, unambitious, indifferent, confused, conser-vative, impulsive, and awkward than did the non-Hispanic Whites in our sample. In general, then, with some excep-tions, Hispanics had more negative stereotypical images of members of these occupations than did their non-Hispanic White counterparts.
Next, using the results of thettests, supervised learning was used to determine whether the responses for each profes-sion could be identified as Hispanic or non-Hispanic White. The results are shown in Table 3. First, a subset of data (the training set) was used to train the model. Then, the model was tested to see how well it predicted the responses of 25 Hispanic and 25 non-Hispanic White students. As shown in Table 3, non-Hispanic White students were properly classi-fied most often based on their perceptions of bankers (80%), followed by marketing managers (60%). Hispanic students were properly classified most often based on their percep-tions of marketing managers (64%). Beyond these results, the model did not correctly detect differences between the Hispanic and non-Hispanic White students in the present study. This suggests that there were few significant differ-ences in the overall view of someone in these occupations between the Hispanic and the non-Hispanic White students in the sample.
TABLE 2
Results oftTests for Differences Between Hispanic and Non-Hispanic White Students In Three Business Occupations
Term Bankers Accountants Marketing Managers
Aggressive–Timid –0.79 –1.33 1.07
Imaginative–Dull –0.84 –2.88
∗ –0
.52
Enthusiastic–Indifferent –0.92 –0.82 2.01
∗
Intelligent–Confused 1.05 2.16
∗ 2
.62 ∗
Outspoken–Conservative –0.74 –1.32 1.65
†
Impulsive–Methodical −2.60
∗∗ –4
.62
∗∗ –1
.75
†
Rebellious–Conforming –1.49 –2.16
∗ 0
Independent–Submissive –0.29 –0.73 –0.18
Enterprising–Awkward 2.64
∗∗ –0
.93 2.94
∗∗
Optimistic–Pessimistic –0.86 –1.82
† 1
.36
Note.Statistically different term is underlined. †p=.10.∗p=.05.∗∗p=.01.
TABLE 3
Confusion Matrices for Each of the Three Occupations
Occupation
Classified as
Non-Hispanic White Classified as Hispanic Total % Correct
Banker
Actually Non-Hispanic White 20 5 25 80%
Actually Hispanic 17 8 25 32%
Total 37 13 50 56%
Accountant
Actually Non-Hispanic White 12 13 25 48%
Actually Hispanic 11 14 25 56%
Total 23 27 50 52%
Marketing manager
Actually Non-Hispanic White 15 10 25 60%
Actually Hispanic 9 16 25 64%
Total 24 26 50 62%
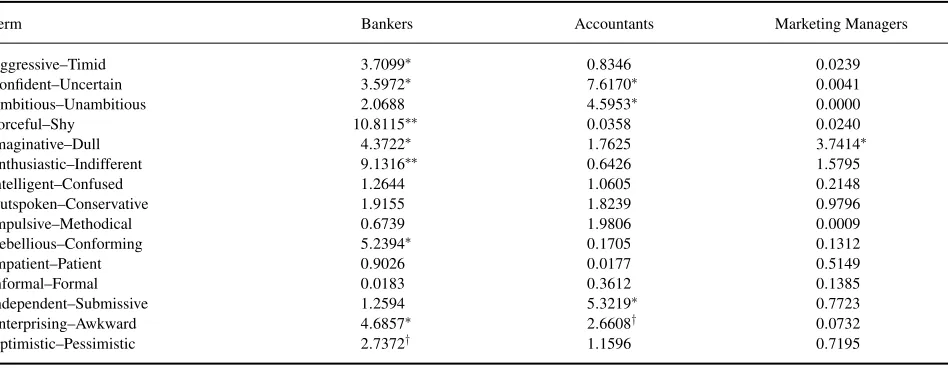
Finally, the possibility that actually knowing someone in the occupations may have influenced the students’ attribute selection was tested. Student responses were grouped into three categories: (a) attribute on the left was chosen, (b) attribute on the right was chosen, and (c) neither attribute was chosen. The chi-square test for differences was then used to determine whether each group of student responses might have been influenced because they knew someone in the occupation. Results for Hispanic students are shown in Table 4 and for non-Hispanic White students in Table 5.
As shown in Table 4, Hispanic student responses were most often different for bankers, based on whether they knew someone in that occupation. Responses were statis-tically different, at least at the 10% level, for 13 of the 45 total responses (8 of the 15 terms for bankers and 4 of the 15 terms for accountants, but only 1 of the 15 terms for
marketing managers). Results presented in Table 5 indicate that non-Hispanic White student responses were most often statistically different, at least at the 10% level, for 14 of the 45 total responses (5 of the 15 terms for accountants and marketing managers and in 4 of the terms for bankers).
If students actually knew someone practicing in the occu-pation, their responses were significantly different from stu-dents who did not know someone practicing the occupation for about one third of the comparisons (13/45 for Hispanics and 14/45 for the non-Hispanic Whites). These results lend support to the supposition that stereotypes can be affected by a variety of sources, including whether someone has actually been exposed to a member of the stereotypical group under study. Hence, one determining factor students may use to ad-dress the stereotype issue is personal knowledge, rather than society’s stereotypical imprint.
TABLE 4
Hispanic Students’ Chi-Square Results for Differences Regarding Knowing or Not Knowing Someone in the Occupation
Term Bankers Accountants Marketing Managers
Aggressive–Timid 3.7099
Ambitious–Unambitious 2.0688 4.5953
∗ 0
Intelligent–Confused 1.2644 1.0605 0.2148
Outspoken–Conservative 1.9155 1.8239 0.9796
Impulsive–Methodical 0.6739 1.9806 0.0009
Rebellious–Conforming 5.2394
∗ 0
.1705 0.1312
Impatient–Patient 0.9026 0.0177 0.5149
Informal–Formal 0.0183 0.3612 0.1385
Independent–Submissive 1.2594 5.3219
∗ 0
130 S. N. CORY ET AL.
TABLE 5
Non-Hispanic White Students’ Chi-Square Results for Differences Regarding Knowing or Not Knowing Someone in the Occupation
Term Bankers Accountants Marketing Managers
Aggressive–Timid 6.3627
∗ 1
.4189 0.9576
Confident–Uncertain 0.7392 0.6469 2.2749
Ambitious–Unambitious 4.0251
∗ 5
.9979
∗ 2
.7839†
Forceful–Shy 0.0675 6.7340
∗∗ 0
Intelligent–Confused 0.0663 4.3367
∗ 3
.1457
†
Outspoken–Conservative 0.7981 1.4464 3.0061
†
Impulsive–Methodical 1.2961 3.2133
† 2
.2098
Rebellious–Conforming 0.0022 0.0221 0.0135
Impatient–Patient 0.0826 0.8505 5.4608
∗
Informal–Formal 0.0193 0.0000 0.0425
Independent–Submissive 0.1014 1.5117 0.0052
Enterprising–Awkward 0.3443 1.2439 0.8513
Optimistic–Pessimistic 2.2049 2.1351 2.6286
†p=.10.∗p=.05.∗∗p=.01.
SUMMARY AND CONCLUSIONS
In the present study, we examined the question of whether differences exist in Hispanic and non-Hispanic White un-dergraduate students’ perceptions of personality traits of the members of three different business occupations: accoun-tants, bankers, and marketing managers. A sample of students from three different universities was surveyed about their per-ceptions of members of these occupations.Ttests were used to identify statistically significant differences in those per-ceptions. Results suggest that the occupational perceptions between the two groups of students were not significantly dif-ferent. In other words, although Hispanic and non-Hispanic White students differed in some of their stereotypical be-liefs about members of these business occupations, they also shared many. In addition, chi-square test results revealed that responses from both groups of students were somewhat af-fected based on whether they knew someone practicing the occupation. These results suggest that stereotypes are af-fected more by whether the student knows someone in that occupation than by ethnicity.
For educators, simply assuming students’ perceptions of business occupations differ based on ethnicity could be a mistake. Although occupational stereotypes may vary some-what by culture, other factors may exert a more powerful influence on student choice of major and occupation. Specif-ically, knowing someone practicing the occupation may be helpful for students as they choose a business discipline. Consequently, the more experience all students can have with individuals in a profession, the less they need to rely on stereotypes as a cognitive heuristic in choosing a major.
Thus, we recommended that business schools encourage active student involvement with industry professionals to encourage pursuit of relevant majors. Programs that bring
professionals to campus or enable students to interact with professionals in industry off campus could be invaluable in assisting students select a major. For example, an Execu-tive in Residence program or Professor for a Day program inviting industry professionals to campus to speak to and work with students could provide a valuable experience. In addition, internships can confirm students’ choice of major by enabling them to interact with professionals in the work-place. This activity not only provides valuable real-world experience, but also enables them to familiarize themselves with individuals in the occupation and to meet potential role models and mentors. Bringing industry to the classroom or the classroom to industry may provide students with the most realistic, relevant information on which to base their decision of a major and ultimately their choice of a career.
REFERENCES
Ashmore, R. D., & Del Boca, F. K. (1981). Conceptual approaches to
stereo-types and stereotyping. In D. L. Hamilton (Ed.),Cognitive processes in
stereotyping an intergroup behavior(pp. 1–35). Hillsdale, NJ: Erlbaum. Beer, F. M., & Cory, S. N. (1996). Accounting students’ perceptions of
cer-tified public accountants: Gender differences.Journal of Business Issues,
1(1), 91–96.
Boudarbat, B. (2008). Field of study choice by community college students
in Canada.Economics of Education Review,27(1), 79–93.
Cardoza, D. (1991). College attendance and persistence among Hispanic
women: An examination of some contributing factors.Sex Roles,24,
133–137.
Ceja, M. (2004). Chicana college aspirations and the role of parents:
Devel-oping educational resiliency.Journal of Hispanic Higher Education,3,
338–362.
Cohen, J., & Hanno, D. (1993). An analysis of underlying constructs
affect-ing the choice of accountaffect-ing as a major.Issues in Accounting Education,
8, 219–238.
Cory, S. N. (1992). Quality and quantity of accounting students and the
stereotypical accountant: Is there a relationship?The Journal of
Account-ing Education,10(1), 1–24.
Cory, S. N., Beer, F. M., Reeves, T. E., & Nouyrigat, G. (2006). Do differences in occupational stereotypes exist between students in the
U.S. and France?International Journal of Business Research,6, 201–
208.
Davidson, R. A., & Etherington, L. D. (1995). Personalities of account-ing students and public accountants: Implications for accountaccount-ing
edu-cators and the profession.Journal of Accounting Education,13, 425–
444.
Erlach, D. (2000). Hispanics and higher education: Multicultural myopia.
Journal of Education for Business,75, 283–285.
Flores, Y. L., & Obasi, E. M. (2005). Mentors’ influence on Mexican
Amer-ican students’ career and educational development.Journal of
Multicul-tural Counseling and Development,33, 146–164.
Gonzalez, A., & Hilmer, M. J. (2006). The role of 2-year colleges in the
improving situation of Hispanic postsecondary education.Economics of
Education Review,25, 249–257.
Hackett, G., Esposito, D., & O’Halloran, M. S. (1989). A self-efficacy
approach to the career development of women.Journal of Vocational
Behavior,35, 164–180.
Hernandez, S. A., Cohen, J. F., & Garcia, H. L. (2000). Hispanic
accultur-ation: Conceptual and modeling issues.The Journal of Applied Business
Research,16(4), 73–83.
Johnson-Bailey, J. (2004). Hitting and climbing the proverbial wall:
Partic-ipation and retention issues for Black graduate women.Race, Ethnicity
and Education,7, 331–349.
Kara, A., & Kara, N. R. (1996). Ethnicity and consumer choice: A study
of Hispanic decision processes across different acculturation levels.The
Journal of Applied Business Research,12(2), 22–34.
Kim, D., Markham, F. S., & Cangelosi, J. D. (2002). Why students pursue the business degree: A comparison of business majors across universities.
Journal of Education for Business,78, 28–32.
Lackland, A., & DeLisi, R. (2001). Students’ choices of college majors
that are gender traditional and nontraditional.Journal of College Student
Development,42(1), 39–48.
Landry, R., Moyes, G. D., & Cortes, A. C. (2004). Ethical perceptions
among Hispanic students: Differences by major and gender.Journal of
Education for Business,80, 102–108.
Leppel, K. (2001). Race, Hispanic ethnicity, and the future of the college
business major in the United States.Journal of Education for Business,
76, 209–215.
Leppel, K., Williams, M., & Waldauer, C. (2001). The impact of parental
occupation and socioeconomic status on choice of college major.Journal
of Family and Economic Issues,22, 373–394.
Macrae, C. N., Milne, A.B., & Bodenhausen, G.V. (1994). Stereotypes as
energy saving devices: A peek inside the cognitive toolbox.Journal of
Personality and Social Psychology,66(1), 37–47.
Malgwi, C. A., Howe, M. A., & Burnaby, P. A. (2005). Influences on students’ choice of college major.Journal of Education for Business,80, 275–282.
Moyes, G. D., Owusu-Ansah, S., & Ganguli, G. (2006). Factors influenc-ing the level of job satisfaction of Hispanic accountinfluenc-ing professionals: A perceptual study.Journal of Business & Economic Studies,12(1), 12–26. Nauta, M. M., Epperson, D. L., & Kahn, J. H. (1998). A multiple-groups analysis of predictors of higher level career aspirations among women
in mathematics, science, and engineering majors.Journal of Counseling
Psychology,45, 483–496.
Noel, M., Michaels, C., & Levas, M. (2003). The relationship of personality
traits and self-monitoring behavior to choice of business major.Journal
of Education for Business,78, 153–157.
Pluviose, D. (2007, December 27). Black, brown and college bound.Diverse
Issues in Higher Education,24(23), 7. Retrieved November 4, 2009, from http://diverseeducation.com/article/10441/1.php
Porter, S. R., & Umbach, P. D. (2006). College major choice: An analysis
of person-environment fit.Research in Higher Education,47, 429–449.
Pritchard, R., Potter, G., & Saccucci, M. (2004). The selection of a business major: Elements influencing student choice and implications for outcomes
assessment.Journal of Education for Business,79, 152–157.
Rivera, L. M., Blumberg, F., Chen, E. C., Ponterotto, J. G., & Flores, L. Y. (2007). The effects of perceived barriers, role models and acculturation on the career self-efficacy and career consideration of Hispanic women.
The Career Development Quarterly,56, 47–61.
Robertson, I. F. (2000). Influence on choice of course made by university
Year 1 bioscience students: A case study.International Journal of Science
Education,22, 1201–1218.
Roiger, R. J., & Geatz, M. W. (2003).Data mining: A tutorial-based primer. New York: Addison Wesley.
Schmidt, P. (2007). Academe’s Hispanic future. In P. McCaffrey (Ed.),
Hispanic Americans(pp. 169–179). New York: H.W. Wilson Company. Shim, S., & Eastlick, M. A. (1998). Characteristics of Hispanic female
business owners: An exploratory study.Journal of Small Business
Man-agement,36(3), 18–34.
Shinnar, R. S., & Young, C. A. (2008). Hispanic immigrant entrepreneurs in the Las Vegas metropolitan area: Motivations for entry into and
out-comes of self-employment.Journal of Small Business Management,46,
242–262.
Smith-Hunter, A. (2006). An initial look at the characteristics of Hispanic
women business owners and their businesses.The Business Renaissance
Quarterly: Enhancing the Quality of Life at Work,1, 101–140. Solberg, V. S. H., Carlstrom, A. H., Howard, K. A. S., & Jones, J. E.
(2007). Classifying at-risk high school youth: The influence of exposure to community violence and protective factors on academic and health
outcomes.The Career Development Quarterly,55, 313–327.
Strasser, S., Ozgur, C., & Schroeder, D. (2002). Selecting a business college major: An analysis of criteria and choice using the analytical hierarchy
process.Mid-American Journal of Business,17(2), 47–56.