Refer to Important disclosures in the last page of this report
Stock DataTarget price (Rp) Rp2,700
Prior TP (Rp) Rp2,700
Shareprice (Rp) Rp1,870
Upside/downside (%) +44.4
Sharesoutstanding (m) 3,561
Marketcap. (US$ m) 479
Government of Indonesia 51.0%
Public 49.0%
Estimate Change; Vs. Consensus 2018 2019 PT Indo Premier Sekuritas joey.faustian@ipc.co.id +62 21 5793 1168
Unusually high burn rate in 1Q18
Earnings of Rp73bn in 1Q18 (+283% yoy)
Achieved 13%/14% of our/company’s FY18 new contract target.
Revise up earnings forecast by 4.7/4.1% for FY18-FY19F
Maintain Buy with unchanged TP of Rp2,700.
1Q18 earnings above historical performance in the last 5 years.
ADHI
reported earnings of Rp73bn (+283% yoy) in 1Q18, representing 10/9% of
our/consensus’ FY18 estimate. This strong achievement in 1Q18 is ADHI’s best 1Q
performance in the last 5 years, which has average of 3% contribution of 1Q to
ADHI’s full year earnings. Revenue was Rp3.1tn (+40% yoy) in 1Q18, cumulating
17/16% of our/consensus’ FY18 target, which also higher than ADHI’s 1Q
historical performance in the last 5 years of 7.2-16.6%. There were margin
expansion all across the board with gross, operating, and net margin stands at
13.7%, 9.9%, and 2.3% (1Q17: 10.6%, 7.0%, and 0.9%) due to increase
revenue portion from LRT Jabodebek and real estate segment which has better
gross margin of 15% and 19%, respectively.
Achieved 14% of our FY18 new contract target of Rp21tn.
ADHI booked
new contract of Rp3tn (-19% yoy) in 1Q18, which represent 14/13% of
our/company’s FY18 target of Rp21/23tn. ADHI is currently planning to have a
joint operation with Acset Indonusa to join tender process for Jakarta-Cikampek
and Serpong-Balaraja toll road, with contract worth of Rp900bn and Rp3.8tn,
FY19F forecast by 4.7/4.1% for FY18-FY19F given increase revenue portion of LRT
Jabodebek and real estate segment to 50% and 5.2% (1Q17: 33% and 4.3%)
which has better gross margin. In addition, we also apply better margin for EPC
segment which has positive gross margin of 14.2% in 1Q17, after booking a
negative 13.1% in 1Q17.
Maintain Buy with unchanged TP of Rp2,700.
We continue to like ADHI given
its better outlook given better certainty on LRT Jabodebek project, supported by
ongoing TOD projects which have shown increase contribution towards ADHI’s
revenue. We believe TOD’s segment will be ADHI’s driving growth for the next
Source: ADHI, IndoPremier Share Price Closing as of : 20-April-2018
2
Refer to Important disclosures in the last page of this report
Fig. 1: Net profit to grow by 35% CAGR FY17-FY19F Fig. 2: Revenue to grow by 15% CAGR FY17-FY19F
Source: Company, IndoPremier Source: Company, IndoPremier
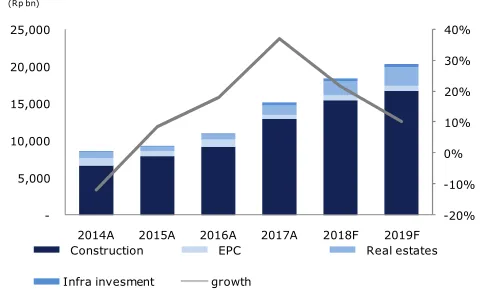
Fig. 3: Revenue by segment in 1Q18 Fig. 4: Positive operating cash flow in 1Q18
Source: Company, IndoPremier Source: Company, IndoPremier
Fig. 5: New contract of Rp3tn in 1Q18 Fig. 6: Net margin improvement FY17-FY19F
Source: Company, IndoPremier Source: Company, IndoPremier
-21%
2014A 2015A 2016A 2017A 2018F 2019F
(Rp bn)
Net profit growth
-20%
2014A 2015A 2016A 2017A 2018F 2019F
Construction EPC Real estates
Infra invesment growth
2012A 2013A 2014A 2015A 2016A 2017A 2018F
(Rp bn)
2014A 2015A 2016A 2017A 2018A 2019F
3
Refer to Important disclosures in the last page of this report
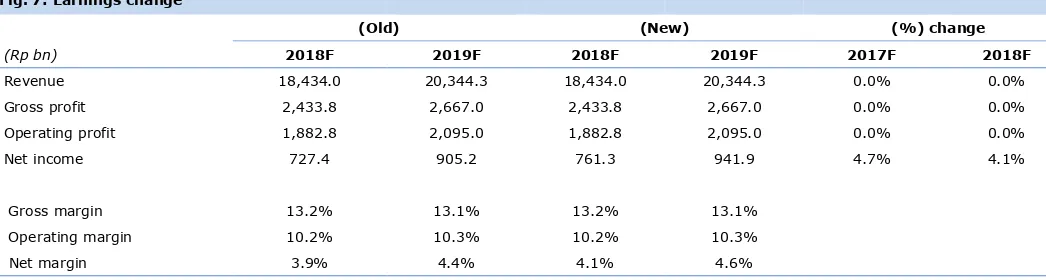
Fig. 7: Earnings change
(Old) (New) (%) change
(Rp bn) 2018F 2019F 2018F 2019F 2017F 2018F
Revenue 18,434.0 20,344.3 18,434.0 20,344.3 0.0% 0.0%
Gross profit 2,433.8 2,667.0 2,433.8 2,667.0 0.0% 0.0%
Operating profit 1,882.8 2,095.0 1,882.8 2,095.0 0.0% 0.0%
Net income 727.4 905.2 761.3 941.9 4.7% 4.1%
Gross margin 13.2% 13.1% 13.2% 13.1%
Operating margin 10.2% 10.3% 10.2% 10.3%
Net margin 3.9% 4.4% 4.1% 4.6%
4
Refer to Important disclosures in the last page of this report
Year To 31 Dec (RpBn) 2016A 2017A 2018F 2019F 2020F
Income Statement
Net Revenue 11,064 15,156 18,434 20,344 23,313
Cost of Sales (9,949) (13,098) (16,000) (17,640) (20,347)
Gross Profit 1,115 2,058 2,434 2,704 2,966
SG&A Expenses (456) (581) (772) (799) (927)
Operating Profit 659 1,477 1,662 1,905 2,039
Net Interest (95) (341) (453) (449) (492)
Forex Gain (Loss) 64 7 0 0 0
Others-Net (15) (185) 93 91 156
Pre-Tax Income 613 957 1,302 1,547 1,703
Income Tax (298) (440) (538) (602) (692)
Minorities (2) (2) (2) (3) (3)
Net Income 313 515 761 942 1,008
Balance Sheet
Cash & Equivalent 3,365 4,131 4,798 4,274 4,366
Receivable 3,970 3,739 4,170 4,610 5,228
Inventory 131 3,683 3,669 3,878 4,247
Other Current Assets 9,368 13,264 15,070 17,016 19,101
Total Current Assets 16,835 24,818 27,707 29,779 32,942
Fixed Assets - Net 1,814 1,876 3,677 4,850 5,434
Goodwill 0 0 0 0 0
Non Current Assets 1,446 1,639 1,696 1,847 2,025
Total Assets 20,095 28,333 33,080 36,476 40,402
ST Loans 2,344 3,537 5,069 5,595 6,411
Payable 8,373 11,611 0 13,947 16,136
Other Payables 1,828 2,235 2,527 2,754 3,239
Current Portion of LT Loans 500 250 250 500 0
Total Current Liab. 13,044 17,633 19,763 22,796 25,786
Long Term Loans 1,428 4,665 6,625 6,242 6,423
Other LT Liab. 180 164 214 246 273
Total Liabilities 14,653 22,463 26,602 29,284 32,482
Equity 3,415 3,413 3,413 3,413 3,413
Retained Earnings 1,997 2,446 3,038 3,751 4,477
Minority Interest 10 11 12 13 14
Total SHE + Minority Int. 5,422 5,869 6,462 7,177 7,904
Total Liabilities & Equity 20,075 28,332 33,064 36,460 40,386
5
Refer to Important disclosures in the last page of this report
Year to 31 Dec 2016A 2017A 2018F 2019F 2020F
Cash Flow
Net Income (Excl.Extraordinary&Min.Int) 315 517 764 945 1,011
Depr. & Amortization 66 131 208 332 421
Changes in Working Capital 2,074 191 (241) 1,374 1,280
Others (301) (3,124) (3,412) (877) (1,108)
Cash Flow From Operating 2,154 (2,285) (2,682) 1,774 1,605
Capital Expenditure (1,257) (386) (2,066) (1,656) (1,183)
Others 163 104 145 168 150
Cash Flow From Investing (1,094) (283) (1,922) (1,488) (1,034)
Loans 1,153 4,181 3,492 392 497
Equity 1 0 0 0 0
Dividends (94) (94) (155) (228) (283)
Others (195) (447) (559) (594) (625)
Cash Flow From Financing 866 3,640 2,778 (431) (410)
Changes in Cash 1,926 1,072 (1,826) (146) 161
Financial Ratios
Gross Margin (%) 10.1 13.6 13.2 13.3 12.7
Operating Margin (%) 6.0 9.7 9.0 9.4 8.7
Pre-Tax Margin (%) 5.5 6.3 7.1 7.6 7.3
Net Margin (%) 2.8 3.4 4.1 4.6 4.3
ROA (%) 1.7 2.1 2.5 2.7 2.6
ROE (%) 5.9 9.1 12.3 13.8 13.4
ROIC (%) 5.2 5.2 5.5 5.9 5.8
Acct. Receivables TO (days) 84.8 70.2 60.9 60.9 59.3
Acct. Receivables - Other TO (days) 35.4 22.6 17.4 17.8 17.7
Inventory TO (days) 67.8 6.9 4.4 4.7 5.0
Payable TO (days) 272.6 278.4 268.4 267.6 269.8
Acct. Payables - Other TO (days) 0.0 0.0 0.0 0.0 0.0
Debt to Equity (%) 78.8 144.0 184.8 171.9 162.4
Interest Coverage Ratio (x) 0.4 0.3 0.4 0.3 0.3
Net Gearing (%) 16.7 73.6 110.6 112.3 107.1
Head Office
PT INDO PREMIER SEKURITAS
Wisma GKBI 7/F Suite 718
Jl. Jend. Sudirman No.28
Jakarta 10210 - Indonesia
p +62.21.5793.1168
f +62.21.5793.1167
INVESTMENT RATINGS
BUY : Expected total return of 10% or more within a 12-month period HOLD : Expected total return between -10% and 10% within a 12-month period SELL : Expected total return of -10% or worse within a 12-month period
ANALYSTS CERTIFICATION.
The views expressed in this research report accurately reflect the analysts personal views about any and all of the subject securities or issuers; and no part of the research analyst's compensation was, is, or will be, directly or indirectly, related to the specific recommendations or views expressed in the report.
DISCLAIMERS