Received:30 May 2017 / Accepted: 04September2017 / Published: 01 December 2017
Abstract. El Niño and the Indian Ocean Dipole (IOD) are oceanographic phenomena ZKLFK RFFXU LQ WKH WURSLFDO 3DFLÀF 2FHDQ DQG WKH ,QGLDQ 2FHDQ GXH WR DLU²VHD interactions. These phenomena affect climate variability both regionally and globally. This study was conducted to understand the impacts of El Niño 2015 and IOD 2016 events on rainfall in the Pameungpeuk and Cilacap regions. The data used consists of the 1,f2LQGH[,2'LQGH[GDLO\UDLQIDOOIURP²GDLO\VHDVXUIDFHWHPSHUDWXUH IURP²GDLO\VHDVXUIDFHKHLJKWIURP²DQGSHQWDGVHDVXUIDFHFXUUHQW IURP ² 7KH PHWKRG XVHG LQ WKLV UHVHDUFK ZDV D GHVFULSWLYH DQDO\VLV 7KH UHVXOWVKDYHVKRZQWKDWUDLQIDOOLQ3DPHXQJSHXNDQG&LODFDSZDVLQÁXHQFHGE\(O Niño 2015 and negative IOD 2016. During El Niño 2015 a decrease in rainfall occurred, whereas during negative IOD 2016 rainfall increased. Rainfall anomalies in the east season and the second transition season during El Niño 2015 in Pameungpeuk reached ïPPDQGïPPPHDQZKLOHLQ&LODFDSUDLQIDOODQRPDOLHVUHDFKHGïPPDQG ïPP&RQYHUVHO\UDLQIDOODQRPDOLHVGXULQJQHJDWLYH,2'UHDFKHGPP and 360 mm in Pameungpeuk, and in Cilacap reached 293 mm and 365 mm. Changes in rainfall in Pameungpeuk and Cilacap during El Niño 2015 and negative IOD 2016 events were closely related to the weakening and strengthening of convections in the southern waters of Java.
Keywords: anomaly, rainfall, El Niño, IOD, convection.
Abstrak.(O1LxRGDQ,QGLDQ2FHDQ'LSROH,2'DGDODKIHQRPHQDRVHDQRJUDÀ\DQJWHUMDGL GL VDPXGHUD 3DVLÀN GDQ VDPXGHUD +LQGLD WURSLV DNLEDW LQWHUDNVL DQWDUD DWPRVIHU GDQ ODXW
Fenomena ini mempengaruhi variabilitas iklim baik regional maupun global. Penelitian ini dilakukan untuk mengetahui dampak kejadian El Niño 2015 and IOD 2016 terhadap curah hujan di wilayah Pameungpeuk dan Cilacap. Data yang digunakan terdiri dari indeks NIÑO3.4, indkes IOD, curah hujan harian dari tahun 1987–2016, suhu permukaan laut harian dari tahun 1987–2016, tinggi muka laut harian dari tahun 1994–2016 dan arus permukaan laut lima harian dari tahun 2007–2016. Metode yang digunakan dalam penelitian ini adalah analisis diskriptif. Hasil penelitian menunjukkan bahwa curah hujan di Pameungpeuk dan Cilacap dipengaruhi oleh kejadian El Niño 2015 dan IOD fase negatif 2016. Selama El Niño 2015 terjadi penurunan curah hujan, sedangkan selam IOD fase negatif 2016 intensitas curah hujan meningkat. Anomali curah pada saat musim timur dan musim peralihan kedua selama El Niño 2015 di Pameungpeuk PHQFDSDLïPPGDQïPPVHPHQWDUDGL&LODFDSPHQFDSDLïPPGDQïPP Sebaliknya, anomaly curah hujan selama IOD fase negatif 2016 mencapai 109 mm dan 360 mm di Pameungpeuk, dan di Cilacap mencapai 293 mm dan 365 mm. Perubahan curah hujan di wilayah Pameungpeuk dan Cilacap selama kejadian El Niño 2015 dan IOD fase negatif 2016 berkaitan erat dengan pelemahan dan penguatan konveksi di perairan selatan Jawa.
Kata kunci: anomali, curah hujan, El Niño, IOD, konveksi.
1. Introduction
El Niño and the Indian Ocean Dipole (IOD) are oceanographic events that occur
LQ WKH 3DFLÀF DQG ,QGLDQ 2FHDQV GXH WR DLU²VHD LQWHUDFWLRQV (O 1LxR VWDUWV ZLWK
there is low air pressure in the east and high air pressure in the west of the tropical
3DFLÀF 2FHDQ(Philander, 1990). Meanwhile, the IOD is characterised by sea surface temperature anomalies between the western and southeastern parts of the tropical Indian Ocean (Saji et al., 1999). An IOD event has two phases: positive and negative.
Positive IOD events are characterised by the cooling of the sea surface temperature in the southeastern equatorial Indian Ocean and the warming of the sea surface temperature in the western equatorial Indian Ocean. This warming causes convective clouds which are situated over the eastern Indian Ocean warm pool to shift to the west. Conversely, negative IOD events are characterised by the warming of the sea surface temperature in the southeastern equatorial Indian Ocean and the cooling of sea surface temperature in the western equatorial Indian Ocean. This warming causes convective clouds which are situated over this region to become stronger.
El Niño and IOD events cause changes in climate variability both regionally and globally. Changes in climate variability in turn cause various hydro-meteorological disasters in many countries. The position of the Indonesian Maritime Continent, located between these oceans, means it is highly vulnerable to El Niño and IOD events. El Niño events have caused drought disasters in Indonesia (Hendon, 2003; Davey et al., 2011; WMO, 2014). In contrast, negative IOD events have led to an increase in rainfall intensity in Indonesia (Guan et al., 2003).
Research about the impact of El Niño on agricultural products in Indonesia has been undertaken by several researchers. Agriculture is one of the most vulnerable sectors to El Niño events (Rojas et al., 2014). Deviation of climatic elements at planting time affects the growth period until harvest which causes the production value to be low (Wardoyo, 1999). About 18 provinces including the national food barns (West Java, Central Java, East Java, North Sumatra and NTT) are affected by El Niño events (Tabor et al., 2015).
El Niño events contribute to a decline in rice production (Xiangzheng et al., 2010; Naylor et al., 2001). El Niño 1997/1998 caused a loss of about 3 million tons of rice in Java (D’Arrigo & Wilson, 2008). In 2015, drought disasters and decline in agricultural production in Indonesia constituted one of the world’s most costly natural disasters; this is estimated to have caused a loss of 16 billion USD (Done & Holland, 2016). El Niño
KDGVLJQLÀFDQWLPSOLFDWLRQVLQWKH
social and economic sectors (Kishore et al., 2000).
Agriculture is a driving sector and buffers the concept of development in the south of Garut Regency in the future (Suminar et al., 2007). The coastal region of Garut Regency has a base economy in the agricultural sector (Sudarya et al., 2013). Meanwhile, the role of the agricultural sector in Cilacap Regency is very strategic because it contributes to the
IXOÀOPHQWRIEDVLFQHHGVIRUWKHSHRSOHRIWKH
regency especially and the people of Central Java in general (BPS, 2014).
Rainfall in the Indonesia Maritime Continent region, especially in South
6XPDWUDDQG:HVW-DYDLVLQÁXHQFHGE\,2'
events (Liong et al., 2003). IOD 1997 caused severe rainfall in eastern Africa and droughts in Indonesia (Saji et al., 1999; Webster et al.,
0HDQZKLOH,2'HYHQWVLQÁXHQFHPDQ\
countries bordering the Indian Ocean, with severe droughts in countries surrounding Indonesia during a positive IOD event (Weller & Cai, 2014).
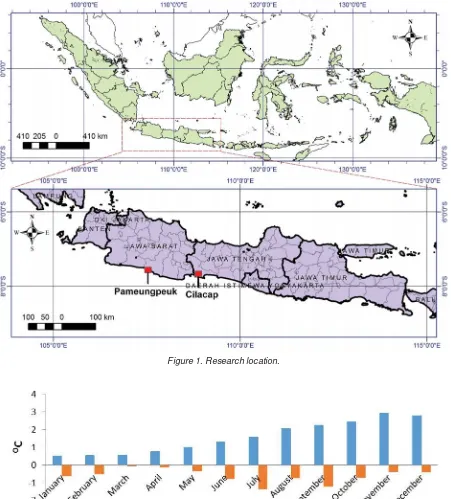
Figure 1. Research location.
Figure 2. NIÑO3.4 and IOD indexes.
2. Research Method
The research sites were Pameungpeuk and Cilacap, which are shown in Figure 1. The locations of the study are indicated by red squares. The data used consisted of the NIÑO3.4 index, IOD index, monthly rainfall from ²GDLO\VHDVXUIDFHWHPSHUDWXUHIURP ²VHDOHYHOKHLJKWIURP²DQG
Cilacap and the Technology Test Center and Space and Atmospheric Observation in Garut, LAPAN.
The method used in this research is a descriptive analysis. Daily and pentad data are processed into monthly data. The impacts of El Niño 2015 and IOD 2016 on rainfall are determined by their anomalous values. The value of rainfall anomaly during El Niño 2015 and IOD 2016 are calculated using equations 1 and 2:
where is rainfall anomaly, is the
climatological rainfall, is rainfall at time i
and n is the amount of data. In the study,
WKH FRUUHODWLRQ FRHIÀFLHQW EHWZHHQ UDLQIDOO
anomaly in the NIÑO3.4 and IOD indexes was calculated. To determine whether there
LV D VLJQLÀFDQW FRUUHODWLRQ EHWZHHQ WKHVH WZR YDULDEOHV D VLJQLÀFDQFH WHVW ZDV FDUULHG RXW
using the t-test method.
The results analysis based on the index values of NIÑO3.4 2015 and IOD 2016 is shown in Figure 2. Based on the index values, it is known that in 2015 there was a strong El Niño event with anomalies of up to 2.95 OC and
in 2016 there was a negative IOD event with anomalies of up to 1.2 OC. The strong impacts of
El Niño in the south of Java occur between July and November (Supari et al, 2016). Therefore, analysis was done from June to November 2015 representing the year of the El Niño and June to November 2016 representing the year of the IOD.
3. Results and Discussion
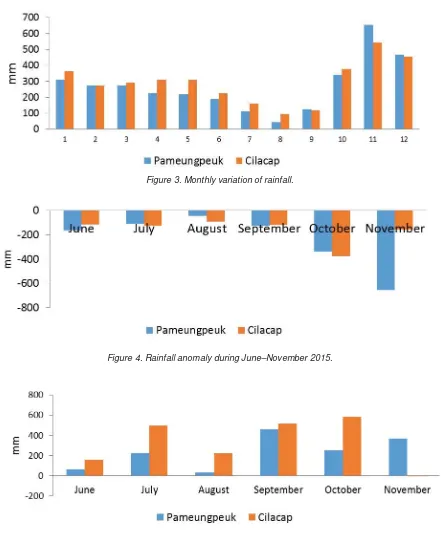
The monthly variation of rainfall in Cilacap and Pameungpeuk is shown in Figure 3. The intensity of rainfall in Cilacap and Pameungpeuk is quite high, with an annual average of more than 270 mm. The type of rainfall in this region exhibits a monsoonal pattern with one maximum and one minimum
value. The highest amount of rainfall occurred in November and the lowest occurred in August. The average amount of rainfall in the east season and the second transition season in Pameungpeuk reaches 115 mm and 374 mm respectively, while in Cilacap it reaches 161 mm and 346 mm respectively.
5DLQIDOO DQRPDO\ LQ WKH SHULRG -XQH²
November 2015 in Pameungpeuk and Cilacap is shown in Figure 4. The intensity of rainfall decreases during El Niño events, which is indicated by negative anomaly. The smallest decrease in rainfall intensity occurred in August in both regions, but the largest decline occurred in October in Cilacap, and in November in Pameungpeuk. This result is consistent with Supari et al. (2016), who state that the impact of El Niño 2015 on monthly precipitation in Cilacap was strongest in October. Rainfall anomaly during the east season and the second transition season in Pameungpeuk
UHDFKHGïPPDQGïPPUHVSHFWLYHO\ DQGLQ&LODFDSUHDFKHGïPPDQGPP
respectively.
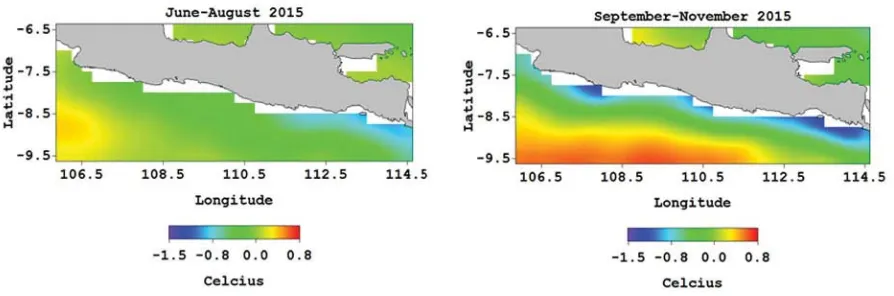
5DLQIDOO DQRPDO\ LQ WKH SHULRG -XQH²
November 2016 in Pameungpeuk and Cilacap is shown in Figure 5. In contrast to El Niño 2015, there was an increase in rainfall intensity during negative IOD 2016. The largest increase occurred in September in Pameungpeuk, and in October in Cilacap. Anomalies of rainfall during the east season and the second transition season in Pameungpeuk reached 109 mm and 360 mm respectively; meanwhile in Cilacap they reached 293 mm and 365 mm respectively.
7KH FRUUHODWLRQ FRHIÀFLHQW EHWZHHQ
rainfall anomaly in Pameungpeuk with the
NIÑ2 LQGH[ ZDV ï DQG ZLWK WKH ,2'
LQGH[ ZDV ï 0HDQZKLOH WKH FRUUHODWLRQ FRHIÀFLHQWEHWZHHQUDLQIDOODQRPDO\LQ&LODFDS
with the NIÑ2 LQGH[ ZDV ï DQG ZDV ïZLWKWKH,2'LQGH[7KHVDPHUHVXOWZDV
stated by Fadholi (2013), where the value of the
FRUUHODWLRQFRHIÀFLHQWEHWZHHQWKH,2'LQGH[
Figure 3. Monthly variation of rainfall.
Figure 4. Rainfall anomaly during June–November 2015.
Figure 5. Rainfall anomaly from June–November 2016.
7KH UHVXOW RI WKH VLJQLÀFDQFH WHVW RQ WKH YDOXH RI WKH FRUUHODWLRQ FRHIÀFLHQW RI UDLQIDOO anomaly in Pameungpeuk, using the t-test PHWKRG ZDV REWDLQHG ZLWK ï DJDLQVW WKH NIÑ2 LQGH[ DQG ï DJDLQVW WKH ,2' LQGH[7KHYDOXHRIWKHVLJQLÀFDQFHWHVWXVLQJ WKHWWHVWPHWKRGLQ&LODFDSZDVïDJDLQVW the NIÑ2LQGH[DQGïDJDLQVWWKH,2' index. Meanwhile, the value of t-table at alpha ZDVïVRWKHWHVWYDOXHRIVLJQLÀFDQFH
is greater than the t-table. This suggests that the phenomena of El Niño and IOD have a VWURQJLQÁXHQFHRQWKHLQWHQVLW\RIUDLQIDOOLQ Pameungpeuk and in Cilacap.
,2'7KHVLJQLÀFDQWGHFOLQHDQGLQFUHDVH
of rainfall intensity occurred between the east season and the second transition season. The average rainfall anomaly from June to
1RYHPEHU ZDV PRUH WKDQ ï PP
but from June to November 2016 it was more than 150 mm. The maximum and minimum rainfall anomalies occurred during the second transition season.
Several other studies have also shown similar results. This result is in agreement with a study conducted by Kirono et al. (2016), which stated that the annual rainfall dropped clearly during the 2015 El Niño event. In a study about food production centres in Java it was found that, especially in West Java, East Java and South Sumatra, the impact of El Niño is very
VLJQLÀFDQWWRUDLQIDOOGXULQJWKHVHFRQGVHDVRQV
(Pramudia & Las, 2000). Rainfall anomaly in the western and eastern parts of Indonesia during negative IOD events increased by more than 100 mm/month, while it decreased by more than 100 mm/month during El Niño events (Nur’utami & Hidayat, 2016). El Niño 2015 has caused the territory of Indonesia, the
3KLOLSSLQHV DQG WKH 3DFLÀF ,VODQG FRXQWULHV
to experience drought from July to December 2015 (VAM, 2015).
Changes in rainfall intensity during El Niño 2015 and negative IOD 2016 in both areas are closely related to the weakening and strengthening of deep convection. The
FRQYHFWLRQ SURFHVV LV LQÁXHQFHG E\ FKDQJHV
in the oceanic conditions of southern Java, especially the sea surface temperature. The sea surface temperature of the Indonesian waters that are located in the tropical region plays a crucial role in strong convection processes (Qu
et al., 2005; Sprintall et al., 2014). During El Niño
events, there is a shift of the warm pool from
WKHZHVWHUQSDUWRIWKHWURSLFDO3DFLÀF2FHDQWR
the centre and the east.
A shift in the warm pool will cause a
GHFUHDVHLQVHDOHYHOLQWKHZHVWHUQ3DFLÀF2FHDQ
and a rise in the east [see BOM AU (2008)]. The effect of El Niño events on the condition of the southern waters of Java is closely
OLQNHGWRWKH,QGRQHVLDQ7KURXJKÁRZV\VWHP
There are three main routes of the Indonesian
7KURXJKÁRZWRWKH,QGLDQ2FHDQWKURXJKWKH
Lombok Strait, the Ombai Strait and the Timor Gap (Sprintall et al., 2009). The Indonesian
7KURXJKÁRZWUDQVSRUWLVZHDNHQHGDWWKHWLPH
of El Niño and strengthened at the time of La Niña (Meyers, 1996; Mihardja et al., 2001, as
FLWHGLQ1LQJVLK6DÀWULet al., 2012).
The sea surface current pattern in the southern waters of Java during the east season and the second transition season of 2015 are shown in Figure 6. From June to November 2015, the sea surface current moved westward. During the southeast monsoon, between June and November, in the southern waters of Java there was an upwelling process (Wyrtki, 1962; Susanto & Marra, 2005; Sachoemar & Hendiarti, 2006). Upwelling is a process involving the rising of the water mass from the lower layer
RI DERXW ² PHWUHV WR WKH VXUIDFH OD\HU
(Bowden, 1983). Because the water mass comes from the lower layers, the sea surface temperature in the upwelling area is colder than that of the surrounding region.
The strengthening of upwelling during El Niño 2015 was accompanied by a decrease in sea level, as shown in Figure 7. The average decrease was very small, where the sea surface height anomalies during the east season were
RQO\DERXWïFPDQGLQWKHVHFRQGWUDQVLWLRQ VHDVRQUHDFKHGDERXWïFP7KHGHFUHDVHLQ
the sea surface height of the coastal waters was greater than the decrease offshore. The largest decline occurred on the south coast of East Java during the second transition season, where the
DQRPDO\UHDFKHGïFP
The weakening of the Indonesian
7KURXJKÁRZWUDQVSRUWGXULQJ(O1LxRHYHQWV
causes sea levels in the southern waters of Java to decline. This decrease in sea levels leads to a shallowing process of the thermocline depth. In some El Niño events, the shallowing of the thermocline depth in the southern waters of Java reaches between 20 and 60 metres (Susanto
et al., 2001). The shallowing of the thermocline
Figure 6. Pattern of surface current from June–November 2015.
Figure 7. Anomaly of sea surface height from June–November 2015.
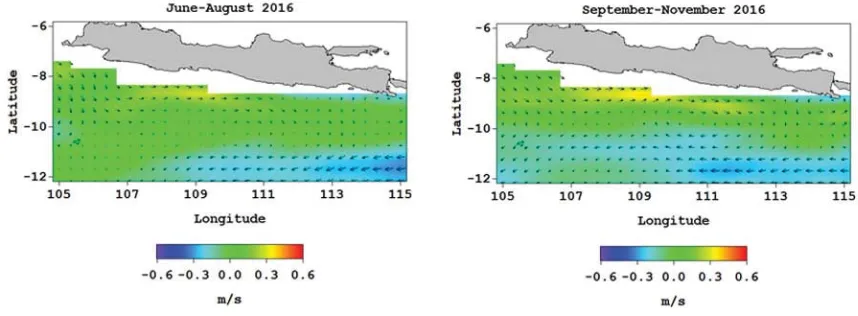
Figure 8. Anomaly of sea surface temperature from June–November 2015.
The strengthening of upwelling will cause a decrease in sea surface temperature. The distribution of sea surface temperature anomalies in the southern waters of Java during the east season and the second transition season during El Niño 2015 is shown in Figure 8. During El Niño 2015, the sea
surface temperature in the southern waters of Java was colder than under normal conditions, which is characterised by negative anomaly. The average sea surface temperature anomaly GXULQJWKHHDVWVHDVRQDERXWZDVïOC, and
LQWKHVHFRQGWUDQVLWLRQVHDVRQZDVDERXWï
Figure 9. Pattern of sea surface current from June–November 2016.
Figure 10. Anomaly of sea surface height from June–November 2016
Figure 11. Anomaly of sea surface temperature from June–November 2016
The smallest decrease in sea surface temperature occurred on the south coast of East Java during the second transition season, ZKHUH WKH DQRPDO\ UHDFKHG ï OC. The cooling of the sea surface temperature in the southern waters of Java leads to a decrease in the convection process, so cumulus clouds around the region were not formed. During El Niño events, there is a strong convection
increase above the central and eastern regions RIWKHWURSLFDO3DFLÀF2FHDQDQGDGHFOLQHDERYH the Indonesian Maritime Continent (Olchev et al., 2015). This mechanism caused the amount of rainfall in Cilacap and Pameungpeuk to decrease during El Niño 2015.
waters of the Java caused convergence. This convergence process caused downwelling. Similar results were stated by Yoga et al (2014), where, at the time of negative IOD 2010, a downwelling process occurred in the southern waters of Java.
Sea surface height anomaly from June to November 2016 is shown in Figure 10. During negative IOD 2016, the sea surface height in the southern waters of Java increased. The sea surface height anomaly at the time of the east season reached 27.9 cm, and reached 28.5 cm during the second transition season. The largest increase occurred in the southern waters of East Java during the second transition season, which reached 29.4 cm.
Anomaly of sea surface temperature in the southern waters of Java during the east season and the second transition season during negative IOD 2016 is shown in Figure 11. In contrast to El Niño 2015, the sea surface temperature in southern waters of Java increased during negative IOD 2016. According to Martono (2016), the effect of IOD events on
WKHÁXFWXDWLRQRIWKHVHDVXUIDFHWHPSHUDWXUH
in the Indonesian waters was stronger than that of ENSO. The increase in the sea surface temperature in the east season reached 2.24
OC, and dropped to 1.56 OC during the second
transition season. The largest rise in sea surface temperature occurred on the south coast of Central Java to East Java in the east season,
monthly rainfall in the Pameungpeuk and Cilacap regions were affected by El Niño 2015 and negative IOD 2016. Rainfall intensity in these regions decreased during El Niño 2015 and increased during negative IOD 2016. Average rainfall anomalies from June to November 2015
UHDFKHGïPPLQ3DPHXQJSHXNDQGUHDFKHG ïPPLQ&LODFDS0HDQZKLOHWKHDYHUDJH
rainfall anomaly from June to November 2016 reached 329 mm in Cilacap, and reached 234 mm in Pameungpeuk. Changes in rainfall intensity during El Niño 2015 and negative IOD 2016 are closely related to the weakening and strengthening of the convection process. The
FRQYHFWLRQSURFHVVLVVWURQJO\LQÁXHQFHGE\WKH
condition of the southern waters of Java. At the time of El Niño 2015 there was a strengthening of the process of upwelling, so the sea surface temperature in the southern waters of Java was colder than under normal conditions. This condition causes convection in the region to weaken. Conversely, during negative IOD 2016, a downwelling process occurred, which caused the sea surface temperature to become warmer, so the convection process above this region became stronger.
Acknowledgements
The author would like to thank Dr. Teguh Harjana for the advice and input that enabled this study to be completed.
References
BOM AU. (2008). El Niño Southern Oscillation (ENSO). Retrieved 4 December 2017, from http:// www.webcitation.org/6vStGgBDG
Publishers Chichester.
BPS. (2014). Cilacap Dalam Angka 2014. Badan Pusat Statistik Kabupaten Cilacap.
'·$UULJR5DQG:LOVRQ5(O1LxRDQG,QGLDQ2FHDQLQÁXHQFHVRQ,QGRQHVLDQGURXJKW
implications for forecasting rainfall and crop productivity. International Journal of Climatology, 28, pp.611-616.
Davey, M., Huddleston, M., and Brookshaw, A. (2011). Global Impact of El Niño and La Niña Implications for Financial Markets. Commissioned for the Lighthill Risk Network. London. Done, J., and Holland, G. (2016). El Niño Global Impact Forecast. Willis Research Fellow and
Willis Senior Scientist at the National Center for Atmospheric Research, Boulder CO. Fadholi, A. (2013). Studi dampak El Niño dan Indian Ocean Dipole (IOD) terhadap curah hujan
di Pangkal Pinang. Jurnal Ilmu Lingkungan, 11(1), pp.43-50.
Guan, Z., Ashok, K., and Yamagata, T. (2003). Summertime Response of the Tropical Atmosphere to the Indian Ocean Dipole Sea Surface Temperature Anomalies. Journal of the Meteorological
Society of Japan, 81(3), pp.533-561.
+HQGRQ ++ ,QGRQHVLDQ 5DLQIDOO 9DULDELOLW\ ,PSDFWV RI (162 DQG /RFDO $LU²6HD
Interaction. Journal of Climate. 16(1), pp.1775-1790.
JAMSTEC. (2008). Indian Ocean Dipole (IOD). Retrieved 4 December 2017, from http://www. webcitation.org/6vSuoSgWl
Kirono, D. G., Butler, J. R., McGregor, J. L., Ripaldi, A., Katzfey, J., & Nguyen, K. (2016). Historical and future seasonal rainfall variability in Nusa Tenggara Barat Province, Indonesia: implications for the agriculture and water sectors. Climate Risk Management² Kishore, K., Subbiah, A.R., Sribimawati, T., Diharto, S., Alimoeso, S., Rogers, P., and Setiana, A.
(2000). Indonesia Country Study. Asian Disaster Preparedness Center.
Lee, H.S. (2015). General Rainfall Patterns in Indonesia and the Potential Impacts of Local Seas on Rainfall Intensity. Water, 7, pp.1751-1768.
Liong, T.H., Bannu, and Siregar, P.M. (2003). Peranan pengelompokan Samar dalam prediksi kekeringan di Indonesia berkaitan dengan ENSO dan IOD. Jurnal Matematika dan Sains,
8(2), pp.57-61.
Martono. (2016). Seasonal and Interannual Variations of Sea Surface Temperature in the Indonesian Waters. )RUXP*HRJUDÀ, 30(2), pp.120-129.
0H\HUV*9DULDWLRQRI,QGRQHVLDQ7KURXJKÁRZDQGWKH(O1LxR6RXWKHUQ2VFLOODWLRQ
Journal of Geophysical Research. 101(C5), pp.12,255-12,263.
Naylor, R.L., Falcon, W.P., Rochberg, and D Nikolaswada. (2001). Using El Niño/Southern Oscillation Climate Data To Predict Rice Production In Indonesia. Climatic Change, 50,
SS²
Ningsih, N.S. (2003). Peranan Iklim pada Studi-Studi Kelautan. Prosiding Seminar dan Lokakarya Aspek Klimatologi dan Lingkungan serta Pemanfaatannya, 29-30 Januari 2003, Bandung.
1XU·XWDPL01DQG+LGD\DW5,QÁXHQFHVRI,2'DQG(162WR,QGRQHVLDQUDLQIDOO YDULDELOLW\ UROH RI DWPRVSKHUHRFHDQ LQWHUDFWLRQ LQ WKH ,QGR3DFLÀF VHFWRU 7KH QG
International Symposium on LAPAN-IPB Satellite for Food Security and Environmental Monitoring 2015, LISAT-FSEM 2015, Procedia Environmental Sciences, 33SS²
Olchev, Ibrom, A., Panferov, O., Gushchina, D., Kreilein, H., Popov V., Propastin, P., June, T., Rauf, A., Gravenhorst, G., and Knohl, A. (2015). Response of CO2 and H22 ÁX[HV LQ D mountainous tropical rainforest in equatorial Indonesia to El Niño events. Biogeosciences,
Perairan Laut di Selatan Jawa Timur, Bali dan Lombok. -+LGURVÀU, 1(1), pp.21-26.
6DÀWUL0&DK\DULQL6<DQG3XWUL059DULDVL$UXV$UOLQGRGDQ3DUDPHWHU2VHDQRJUDÀ
di Laut Timor Sebagai Indikasi Kejadian ENSO. Journal of Tropical Marine Science and
Technology, 4(2), pp.369-377.
Saji, N.H., Goswami, B.N., Vinayachandran, P.N., and Yamagata, T. (1999). A dipole mode in the tropical Indian Ocean. Nature, 401, pp.360-363.
Sprintall, J., Gordon, A.L., Koch-Larrouy, A., Lee, T., Potemra, J.T., Pujiana, K., and Wijffels, S.E.
7KH,QGRQHVLDQVHDVDQGWKHLUUROHLQWKHFRXSOHGRFHDQ²FOLPDWHV\VWHP1DWXUH
Geoscience, 7, pp.487-492.
Sprintall, J., Wijffels, S.E., Molcard, R., and Jaya, I. (2009). Direct estimates of the Indonesian
7KURXJKÁRZ HQWHULQJ WKH ,QGLDQ 2FHDQ ²Journal of Geophysical Research, 114,
C07001.
Sudarya, D., Sitorus, S.R.P., and Firdaus, M. (2013). Analisis Perkembangan Ekonomi Wilayah untuk Arahan Pembangunan Kecamatan di Wilayah Pesisir Kabupaten Garut. Jurnal Imiah
Geomatika, 19(2), pp.134-140.
Suminar, J.R., Mariana, D., and Paskarina, C. (2007). Studi Evaluasi Kebijakan Pengembangan Kabupaten Garut Bagian Selatan. Laporan Penelitian, Peneliti Muda UNPAD, Lembaga Penelitian UNPAD.
Supari, Muharsyah, R., and Sopaheluwakan, A. (2016). Mapping Drought Risk in Indonesia Related to El-Niño Hazard. The 5th International Symposium on Earth Hazard and Disaster
Mitigation, AIP ConferenceProcHHGLQJV²
Supari, Muharsyah, R., and Wahyuni, N. (2016). Impact of the 2015 Godzilla El Niño event on the Indonesian rainfall. 6FLHQWLÀF-RXUQDORI33,8.0, 3(1), pp.26-31.
Susanto, D., and Marra, J. (2005). Effect of the 1997/98 El Niño on Chlorophyll a Variability along the Southern Coasts of Java and Sumatra, Oceanography, 18(4), pp.124-127.
Tabor, S., Ginting, E., and Aji, P. (2015). Preparing For El Niño: Policy Options.ADB Papers On
Indonesia, No. 01.
VAM. (2015). El Niño: Implications and Scenarios for 2015/16. World Food Progamme.
Wardoyo, W. (1999). Kebutuhan Informasi Cuaca dan Iklim Pada Sub Sektor Perkebunan. Prosiding Lokakarya Program Iklim Terpadu, 7 September 1999, Jakarta.
Webster, P.J., Moore, A.M., Loschnigg, J.P., and Leben, R.R. (1999). Coupled ocean-atmosphere dynamics in the Indian Ocean during 1997-98. Nature, 401, pp.356-360.
Weller, E., and Cai, W. (2014). Meridional Variability of Atmospheric Convection Associated with the Indian Ocean Dipole Mode. 6FLHQWLÀF5HSRUWV, 4, pp.3590.
Wyrtki, K. (1962). The Upwelling in the Region between Java and Australia during the Southeast Monsoon. Marine and Freshwater Research,13(3), pp.217-225.
Xiangzheng, D., Jikun, H., Fangbin, Q., Naylor, R.L., Falcon, W.P., Burke, M., Rozelle, S., and Battisti, D. (2010). Impacts of El Niño-Southern Oscillation events on China’s rice production.
Journal of Geographic Sciences, 20, pp.3-16.
Yoga, R.B., Setyono, H., and Harsono, G. (2014). Dinamika Upwelling dan Downwelling
%HUGDVDUNDQ9DULDELOLWDV6XKX3HUPXNDDQ/DXWGDQ.ORURÀO$'L3HUDLUDQ6HODWDQ-DZD