LIDAR MAPPING TECHNOLOGY TO POPULATE GREEN AREAS GIS
N. Cattaneo a, *, F. Di Maria a, F. Guzzetti a, A. Privitera a, G. Righetti b
a Built Environment Science and Technology Dept., Politecnico di Milano, 32 piazza Leonardo da Vinci, 21033 Milano,
Italy - nelly.cattaneo@yahoo.it, (francesca.dimaria, franco.guzzetti)@polimi.it, annaprivitera@hotmail.it b Geotechnos srl, 12 via del Follatoio, 34148 Trieste, Italy – giovanni.righetti@geotechnos.eu
KEY WORDS: Application, Mapping, Database, LIDAR, Survey, Vegetation
ABSTRACT:
In the last eight years the structure of Topographical Database of green areas has been implemented and consolidated: originally born to manage green areas in Milan, it is now used in other cities. Beside the optimizations achieved in data management (i.e. relationship between data and working process, updating procedures, exhaustive Index of Items) it is now becoming important an optimization in data acquisition: this is the reason why a test was started involving the use of LiDAR technology for surveying those green areas classified as equipped parks (over 50.000 sqmt), as an alternative to the traditional topographycal survey. LiDAR technology is commonly applied to forestry surveying and green mass computation, even in urban contexts, achieving good results also in automation of data processing. Nevertheless this testing activity has a specific aim, that is to derive (also using the contextual orthophoto) as many layers as possible among the ones described by the Specifications on Green areas TDb, preserving the high level of thematical detail and accuracy suggested by the Specifications. To do this, using the application Laserweb© for visualization and interaction with the point cloud, new and specific functions and layouts have been designed and implemented. For each item of the index has been made an effort to encode the optimal strategy for exploring the cloud and exporting the datum. The variety of the elements included in the Specification Index of Items is very differentiated, therefore also the procedures in point cloud analysis are various, as the main purpose of this work is to exploit all the potential information contained in a point cloud.
1. INTRODUCTION
The management of public green areas of Milan makes daily use of a set of four applications, one for each specific working topic (trees, playing equipment, working planning and data updating, queries and statistics). All these applications refer to the same database, which constitute the core of the so-called “Green GIS”, which has then been used by public administations of other towns and councils.
The rules and specifications concerning the survey of this kind of areas revealed to be essential, in order to guarantee over the years and the turnover of operators a complete and coherent database. The whole processing of data from the first collection to the connection with the working planning has constantly improved since 2003. This is why the database fits perfectly the daily practical management and can provide anytime up-to-date statistics and data.
In order to improve the whole system, a test has been made to optimize the capture of the geometrical data. It was considered necessary to test the LiDAR technology as an alternative to traditional topographical procedure, in the survey of wide parks, classifed as “over-local” parks (surface over 50000 sqm), in order to include parameters and methods fitting this kind of surveying, if considered satistactory, to the initial survey specifications.
LiDAR technology is commonly applied to forestry surveying, where it now achieves highly performing results also in the automation of data processing. It is a more and more appreciated technology, useful especially when it is necessary to computate irregular volumes such as the vegetal mass.
In our case the use of the point cloud has a different task: in the test made on the Idroscalo Park, the point cloud and the related ortophoto are the basic datasets used to extract the items that build up the index of the Green GIS. It is not possible to use automated processings, because the variety and the level of detail of the items included in the index is very high, and the as nominal scale is very high as well.
The testing activity was supposed to find and check a specific strategy for most items to be captured from the point cloud, maintaining the accuracy and the richness of information recommended by the specificatons.
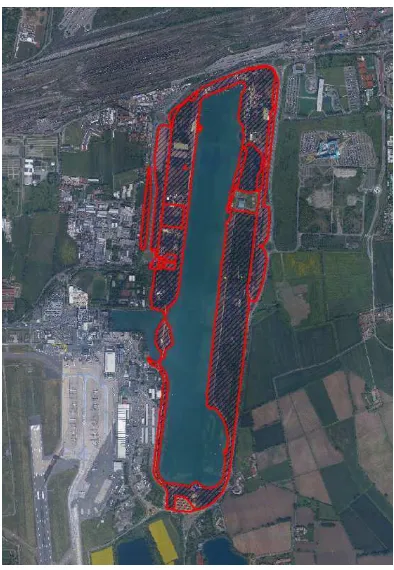
2. DATA ACQUISITION AND MANAGEMENT 2.1 Features of LiDAR survey and Laserweb© application The LiDAR surveying has been conducted on an area measuring over 80 hectars. It is a mainly flat area situated at a few kilometers from Milan, with a wide pond that constitutes the old seadrome, enclosed by a double ring of green connected with the roads used to reach the Linate Civil Airport and the suburbs.
In picture 1 the park area is marked out and it is possible to see how close it is to the airport. The flight has been carried out by a twin-engined plane flying at 1600 mt above ground level. The instruments used were a LEICA ALS 60 laserscanner and a 39 MP digital photogrammetrical camera RCD105.
It is important to underline that the proximity of the airport posed an important restraint to the flight height, thus forcing the
International Archives of the Photogrammetry, Remote Sensing and Spatial Information Sciences, Volume XXXVIII-4/C21
data acquisition to be carried out at height which revealed to be higher than the optimal one.
Figure 1. Location and extent of Idroscalo Park
However the flight has been planned in order to guarantee the acquisition of 4 point per sqm minimum. Moreover the collection of papers and authorizations in such a special area caused an unfortunate delay which made the flight take place in June. How it is easy to imagine and will be more clear in the following notes, for our purpose a flight in this period is not recommended at all: the vegetation is in its full seasonal development: the orthophoto cannot be used for a first detection of ground features in wide portions of the park and the density of ground points is remarkably reduced although 4 returns have been recorded.
These two working conditions pose enormous limits to the quality of the point cloud needed for our purpose. The test activity here submitted has then a wide improvement margin, and what was achieved in this case can be surely achieved more easily and with more satisfactory results in other situations with not such special conditions.
In spite of these disadvantages, the flight acquired produced a high precision DTM, which enabled the production of a highly accurate ortophoto. The flat area and the very low density of buildings allowed to use it as the metric reference for the whole project, as its accuracy is below 20 cm thus fitting the nominal scale of the database. The only limit is the ortophoto GSD which is 10 cm, due to the flight eight.
A feature which made the exploration of the point cloud and the displaying of ortophoto much more comfortable was the application Laserweb©, used by the Geotechnos company to provide the data: the point cloud and the orthophoto are accessible via Web; the performance of the interactions with the point cloud depends on the characteristics of the internet connection: in normal conditions this interaction is highly performing and it is possible to dispose of data and to display them with very quick response times. Moreover it is not
necessary to store these enormous amounts of data on a dedicated PC or to look for the most suitable package of software to manage them. Moreover it is possible to select every time a different portion of point cloud, choosing between the entire cloud or the ground points only.
It is then possible to work on any enabled computer connecting to the data which are stored on a remote server, as if they were on the computer itself, creating shapefiles or dxf files. This way of supplying LiDAR data makes them easily available for any kind of use, and this is a very interesting topic because a LiDAR flight collects such a big and indiscriminate quantity of data that many could be the operators interested to use aspects of them for more specific purposes. And a big variety of purposes promotes the development of new personalized specific tools enriching the application.
Laserweb© was created to support the activities connected to the road cadastre and the surveys related to it. In order to use it also for other aims, several features and tools have been implemented, within a research partnership between Geotechnos and the Politecnico of Milan.
2.2 From the Point Cloud to GIS: tools test
As already said, the Green GIS lays on a very detailed index (around 170 items). As explained in “Specifications for the
creation of the topographic database of green areas”, the index
is mainly made up by 6 shapefiles (2 point P, two linear L, 2 areal A: for each geometrical primitive there is one shapefile dedicated to vegetal features “V” and one dedicated to artificial features “AU”. The six shapefiles so described are then:
- AU_P.shp, including features as drinking fountains,
inspection pits (specifying the material: concrete, cast iron, pvc…) etc.;
- V_P.shp, including trees, single bushes, stumps, with
botanical attibutes;
- AU_L.shp, including fences of different kinds, curbs
of different materials, etc.; - V_L.shp, including hedges
- AU_A.shp, including road and path surfaces of
different materials, buildings of different nature, stairs, monuments, fountains etc.
- V_A.shp, including meadows of different kinds, wide
bushes, flowerbeds, etc.
It was immediately clear that the reconnaissance expeditions would have been necessary, in order to guarantee this level of detail and the accuracy of the information. It was also clear that the Reflectance comparison could not help, because of the variation of humidity conditions all over the area also due to differences in vegetation, and because of the very specific attributes to give to the features (surfaces made of concrete, self-blocking concrete bricks, concrete plates, have different codes).
The task of the point cloud was mainly focused on four aspects: providing the geometrical datum, providing a first help in the interpretation of the orthophoto, enabling a basic survey for unaccessible areas, that in our case were represented by a wild small wood around a little pond located in the North East of the park; and even though the Green GIS is not a fully 3D database, the point cloud has been used to provide the height informations necessary to describe the vegetation.
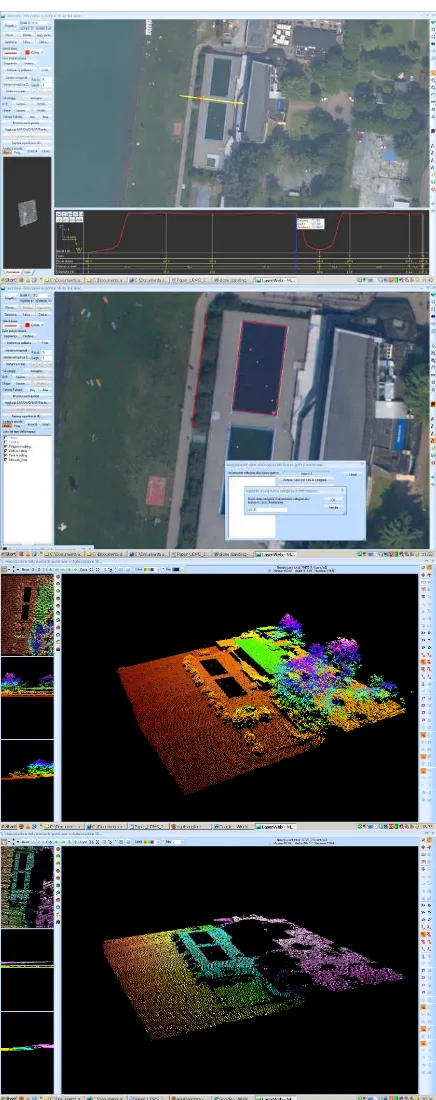
In Figure 2 the basic functions of Laserweb© are displayed: 3D visualization of the portion of the point cloud selected on the orthophoto, automatic generation of DSM profiles along selected section lines, measuring tools, drawing shapefiles and filling their attribute table with with the possibility to save them both on the server and on the working PC.
International Archives of the Photogrammetry, Remote Sensing and Spatial Information Sciences, Volume XXXVIII-4/C21
The most important features in the Green GIS are trees, so, since the beginning Geotechnos developed a semiautomatic function comitted to the extraction of position and size of the trees.
Figure 2. From the top: extraction of profiles from the DSM; generation of punctual, linear and areal shapefiles with basic editing tools; visualitazion of a selected portion of the point
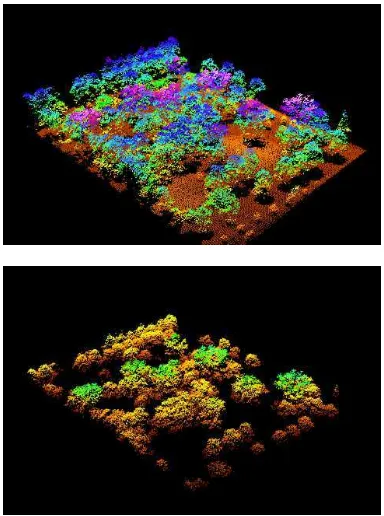
cloud; visualization of the ground point of the area In the point cloud it is easy to detect tree-canopies, and in many cases a canopy is clearly distinct from the next one. Depending on the kind of tree it is then possible to identify the top or the peak of the canopy itself.
Figure 3. Visualization of tree canopies
Once the tree top has been located, a specific tool captures P, as the very next point belonging to the point cloud, thus recording its position and the information of its z coordinate (altitude). A second tool enables the generation of a circumference with centre P and as wide as the canopy.
Once P and the canopy circle have been recorded, a third tool can be used to connect the circumference to the ground points through the directrices of this sort of cilinder.
The result is a shapefile made by points with the same x,y coordinates as P points, with two attributes: diameter of the canopy and height of the tree. These two attributes are already two of the fields contained in V_P.shp.
Figure 4. Detection of the tree top centre and canopy width
In order to guarantee the correct detection of P points and canopies it is important to restrict this activity to tree lines or to those portions of the area where trees stand alone. In these locations trees develop a symmetrical canopy and their actual width and centre position can be truthfully identified. It is remarkable that these portions of areas are those where a traditional topographical campaign is less profitable. In small woods and high density tree areas the use of theodolite is recommended.
Moreover it is now possible to visualize sections on the point cloud in the three main directions to facilitate the comprehension and the interpretation of the data.
New functions are being studied in order to superimpose outcoming data to the point cloud: this is going to be very useful when using LiDAR data in updating process.
International Archives of the Photogrammetry, Remote Sensing and Spatial Information Sciences, Volume XXXVIII-4/C21
Figure 5. Visualization of the point cloud at different heights can facilitate the comprehension of the items
2.3 Development guidelines
This kind of web application must enable a comfortable and full use of the point cloud in the activity of extracting data useful for a topographic database. It is then necessary a stronger interaction between the cloud and the shapefile that is being worked out. The next step is to enable the creation of polygons and polylines in the point cloud itself, and to provide the means to upload outcoming shapefiles in it. As the tools implemented for tree extraction are dedicated especially to trees standing alone and tree lines, the next step is to provide an automatic extraction of the V_P.shp from preselected portions of the full point cloud.
In the specific case of the Green GIS it is important to detect very narrow items, especially the right position and borders of path surfaces: this is why it is recommended to produce an orthophoto with GSD of 5 cm maximum, beside the obviuos advice not to plan the flight in a full vegetation season. Point clouds should enable the accurate detection of small buildings (sheds, electrical rooms, etc.) even under the tree-canopies. The survey must be specifically planned in order to have an effective result from the multiple returns also in these portions of the area.
In order to exploit the 3D nature of LiDAR data, it would be interesting to introduce in the application also a Sky View Factor-based layout of the DTM. The SVF is a very utilized parameter determined by the computation of how much of the sky is visible from each point: the layout simulates the corresponding shadowing effect of a diffuse light. Thanks to this parameter it would be possible to mark out even very small alteration of the ground surface, detecting the shape and the position of paved surfaces, slopes etc. To make this layout effective it is important to pay attention to the smoothing effect of algorithms in the generation of the DTM.
The reconnaissance expedition and localized traditional topographic campaigns are to be considered unavoidable. The
general survey planning must therefore include these two other aspect, without expecting from the LiDAR data any total solution.
3. CONCLUSIONS
This testing activity was necessary to start making technical and economical evaluations on the use of LiDAR technology for these specific and accurate purposes, bound to the characteristics of a previously structured database.
The opportunity of using an othophoto based on a highly accurate DTM is very profitable in the detection of the main geometries. Traditional topographical campaigns and reconnaissance expeditions are therefore unavoidable.
The development of automatic specific tools may speed up a part of the process, for wide areas where topographic expeditions would be very expensive and where semiautomatic extraction would take time and be expensive as well.
This should match with instruments that allow a following check on the output.
References:
Shan, J., Toth, C.K. 2009. Topographic Laser ranging and
scanning – principles and processing. CRC Press, London.
Cattaneo, N., Di Maria, F., Guzzetti, F., Privitera, A., 2008.“La
gestione della banca dati delle aree verdi del comune di Milano attraverso l’aggiornamento continuo dei dati” 12th National conference ASITA – L’Aquila, Italy.
Cattaneo, N., Di Maria, F., Guzzetti, F., Privitera, A., Viskanic, P., 2010. “Specifiche tecniche per la realizzazione del database
topografico del patrimonio verde”, Milano, Italy. http://www.r3-gis.com/upload/pages/specifiche_verde.pdf
International Archives of the Photogrammetry, Remote Sensing and Spatial Information Sciences, Volume XXXVIII-4/C21