Refer to Important disclosures in the last page of this report
Stock DataTarget price (Rp) Rp3,075
Prior TP (Rp) Rp4,175
Share price (Rp) Rp2,500
Upside/downside (%) +23.0
Shares outstanding (m) 10,590
Market cap. (US$ m) 1,837
Republic of Indonesia 60.0%
Estimate Change; Vs. Consensus
2018F 2019F
PT Indo Premier Sekuritas stephan.hasjim@ipc.co.id +62 21 5793 1168
Slowing profit growth as rate rises
1H18 earnings growth of 12% was below market expectations.
Strong asset growth was offset by lower NIMs, high opex growth.
Stable asset quality, credit cost and provision/NPL coverage.
We cut earnings and TP, due to rising rates, but keep BUY rating.
Modest results.
BBTN reported net profit of Rp1.4tn in 1H18 (+12%), with its
2Q/1Q profits forming only 21%/19% of our FY18F forecast of Rp3.5tn. As such,
its earnings came well below our and market expectations. For comparison, 1H
profit contributed 45% to FY17 profit (excluding extraordinary incomes in 4Q17).
BBTN’s lower than expected profit was due to: 1) its declining NIMs (-29bps yoy);
and 2) high operating cost growth (+17%), which offset its strong asset growth of
20% while its provisions grew modestly by 13%. Meanwhile, the bank’s core profit
(PPOP) grew modestly by 11% to Rp2.2tn in 1H, forming 42% of our full-year
forecast (also below our expectation).
NIM pressure
. BBTN’s strong loan growth of 19% (vs. industry growth of 10%)
was driven by growth of subsidized mortgages (+30%) vs. 13% for commercial
mortgages. We believe the growth outlook for low cost housing in Indonesia will
remain robust in the coming years given strong government support in the form
of liquidity loans (KPR FLPP), interest subsidy (KPR SSB) and Tapera housing
loans. We expect further NIM pressure to be mitigated by new subsidy schemes
such as KPR SSB (where its interest subsidy is linked to 12mth SBI rate) while the
new KPR FLPP scheme (75%:25%) to be implemented from 2H18 should also
lower the bank’s vulnerability to rising rates and reduce operating cost despite the
new FLPP scheme’s potentially lower NIMs vs. previous 90%:10% scheme.
Asset quality
. BBTN’s asset quality is stable with NPL ratio of 2.78% in 1Q & 2Q
(1H17: 3.2%), with NPL ratios improving for housing loans (2.54% vs. 2.83%)
and commercial loans (6.62% vs. 9.28%). Credit cost was also stable at 41bps in
1Q & 2Q vs. (1H17: 44bps), in-line with our assumption, while provision/NPL
coverage improved to 42%, from 39%.
Valuation
. We cut our earnings forecasts by 4-5% for FY18-20F, due to lower
NIMs and higher opex, and reduce our TP to Rp3,075 (from Rp4,175) due to: 1)
our 50bps higher cost of capital assumption to reflect the rise in 10-yr yields
during the second quarter; 2) our lower LT ROAE assumption. Our TP is based on
GGM-derived target FY18F P/B of 1.33x, assuming LT ROAE of 13.8% (from
14.8%), LT growth of 8.5%, cost of equity of 12.5% (from 12%). We estimate LT
ROAE based on DuPont analysis, assuming LT ROAA of 1.15% and asset/equity
leverage of 12x. However, we keep our BUY rating given the steep fall in share
price, the stock’s low valuation and its still robust earnings growth outlook.
Bank Tabungan
(
BBTN IJ
)
19 July 2018
Results Note
BUY
(Unchanged)
Year To 31 Dec 2016A 2017A 2018F 2019F 2020F
Operating income (RpBn) 9,268 10,805 12,051 13,736 15,509
PPOP (RpBn) 3,881 4,637 4,962 5,776 6,713
Source: BBTN, IndoPremier Share Price Closing as of : 18-July-2018
2
Refer to Important disclosures in the last page of this report
Fig. 1: Net Interest Income (Rp bn) and NIMs (%) Fig. 2: Non-Interest Income (Rp bn; % of Gross Income)
Source: Company, IndoPremier Source: Company, IndoPremier
Fig. 3: Operating Expense (Rp bn) and Cost/Income Ratio (%)
Fig. 4: Pre-Provision Profit (Rp bn; % of Average Assets)
Source: Company, IndoPremier Source: Company, IndoPremier
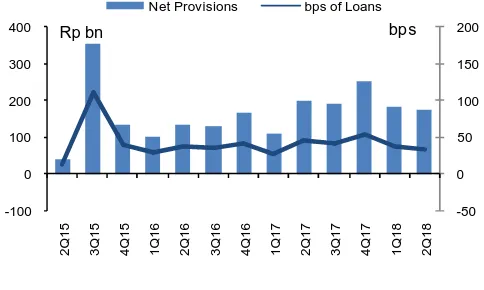
Fig. 5: Net Loan Provisioning (Rp bn; bps of Average Loans) Fig. 6: Net Profit (Rp bn) and ROAA (%)
Source: Company, IndoPremier Source: Company, IndoPremier
0%
Net Interest Income Net Interest Margin
Rp bn
Other Income Other Income % of Total
Rp bn
Operating Expenses Cost-Income Ratio
Rp bn
Pre-Provision Profit Pre-Provision Profit ROAA
Rp bn
Net Provisions bps of Loans
bps
Net Profit Net Profit ROAA
3
Refer to Important disclosures in the last page of this report
1H 2018 Results
Results (Rp Bn) 1H18 1H17 % Y-Y 2Q18 1Q18 % Q-Q
Customer Deposits 189,627 159,130 19.2 189,627 194,163 -2.3
Non-Performing Loans (NPL) 5,876 5,730 2.5 5,876 5,630 4.4
Special Mention Loans 21,127 21,341 -1.0 21,127 21,127 0.0
Loan Loss Reserves (LLR) 2,451 2,222 10.3 2,451 2,380 3.0
Total Assets 268,044 224,067 19.6 268,044 258,739 3.6
Risk-Weighted Assets 124,072 105,545 17.6 124,072 120,199 3.2
4
Refer to Important disclosures in the last page of this report
Year To 31 Dec (RpBn) 2016A 2017A 2018F 2019F 2020F
Income Statement
Interest income 17,139 19,272 21,860 25,744 30,484
Interest expense (8,975) (9,931) (11,414) (13,777) (16,930)
Net interest income 8,164 9,341 10,445 11,967 13,554
Fees and commissions 591 750 863 992 1,141
Trading income 282 403 400 400 400
Other operating income 231 311 342 377 414
Total operating income 9,268 10,805 12,051 13,736 15,509
Personnel expenses (2,122) (2,554) (3,014) (3,376) (3,714)
G&A expenses (2,466) (2,953) (3,307) (3,704) (4,075)
Other operating expenses (799) (661) (768) (880) (1,008)
Pre-provision operating profit 3,881 4,637 4,962 5,776 6,713
Provisions (708) (884) (869) (1,031) (1,226)
Current account with BI 10,697 12,555 14,472 17,100 20,215
Placements at BI & other banks 17,903 25,254 17,097 18,251 17,746
Short-term investments 4,172 7,706 13,871 15,258 16,784
Government bonds 9,244 8,184 8,184 8,184 8,184
Gross loans 164,446 198,991 235,611 279,807 333,395
Loan provisions (2,116) (2,356) (2,625) (3,056) (3,682)
Other assets 8,816 10,005 10,763 11,586 12,478
Total Assets 214,168 261,365 298,486 348,446 406,674
Customer deposits 159,988 192,474 222,639 263,082 311,000
Deposits from other banks 3,653 5,445 5,990 6,589 7,248
Securities and borrowings 24,304 32,856 37,347 42,187 47,196
Other liabilities 6,595 7,310 8,041 8,846 9,730
Total Liabilities 194,539 238,085 274,018 320,704 375,174
Share capital 7,349 7,349 7,349 7,349 7,349
Reserves and others 2,773 2,780 2,802 2,802 2,802
Retained earnings 9,008 11,512 14,316 17,590 21,348
Shareholders' equity 19,131 21,642 24,468 27,742 31,500
Minority interest 0 0 0 0 0
Total Liabilities & Equity 213,670 259,727 298,486 348,446 406,674
5
Refer to Important disclosures in the last page of this report
Year To 31 Dec 2016A 2017A 2018F 2019F 2020F
Growth Ratios (% yoy)
Gross loans 18.3 21.0 18.4 18.8 19.2
Total assets 24.7 22.0 14.2 16.7 16.7
Customer deposits 25.3 20.3 15.7 18.2 18.2
Net interest income 19.9 14.4 11.8 14.6 13.3
Non-interest income 23.3 32.6 9.6 10.2 10.5
Total operating income 32.3 16.1 9.5 16.0 15.0
Operating expense 20.0 14.5 14.9 12.3 10.5
PPOP 20.7 19.5 7.0 16.4 16.2
Net profit 41.5 15.6 12.6 16.0 15.0
Profitability Ratios
ROAA (%) 1.38 1.33 1.22 1.22 1.20
ROAE (%) 15.7 15.1 14.8 15.2 15.4
NIM (%) 4.71 4.52 4.06 4.01 3.89
Credit cost (bps) 35.4 41.8 32.2 32.2 33.5
Cost/income (%) 58.1 57.1 58.8 58.0 56.7
LDR (%) 102.8 103.4 105.8 106.4 107.2
CAR (%) 20.3 18.9 17.9 17.1 16.3
NPL ratio (%) 2.8 2.7 2.3 2.1 2.0
Provisions/NPL (%) 45.3 44.6 47.4 51.2 55.8
Head Office
PT INDO PREMIER SEKURITAS
Wisma GKBI 7/F Suite 718
Jl. Jend. Sudirman No.28
Jakarta 10210 - Indonesia
p +62.21.5793.1168
f +62.21.5793.1167
INVESTMENT RATINGS
BUY : Expected total return of 10% or more within a 12-month period HOLD : Expected total return between -10% and 10% within a 12-month period SELL : Expected total return of -10% or worse within a 12-month period
ANALYSTS CERTIFICATION.
The views expressed in this research report accurately reflect the analyst;s personal views about any and all of the subject securities or issuers; and no part of the research analyst's compensation was, is, or will be, directly or indirectly, related to the specific recommendations or views expressed in the report.
DISCLAIMERS