*
Ozonation of Yarn dyed Wastewater in a Continous Stirred Tank
Reactor : Kinetic Study and Performance Optimisation
Lieke Riadi1,2*, Andrian Sugiharto1, and Hana Gondokusumo1
1Departemnet of Chemical Engineering , The University of Surabaya ,Jl.Raya Kalirungkut ,Surabaya 60239, Indonesia 2Center for Environmental Studies, The University of Surabaya ,Jl.Raya Kalirungkut ,Surabaya 60239, Indonesia
Abstract. This paper describes the ozonation process in yarn dyed wastewater using continuous stirred tank reactor with the objective to study the kinetic of COD degradation at various volumetric flow rate (30, 50, 70 ml/min) and ozone concentration (2.70 %, 4.25%, 5.86 % mol/mol). The wastewater which was collected from a yarn dying process located in Surabaya area was pretreated by electrocoagulation prior to ozonation process. The electrocoagulation process was carried out to reduce the color intensity and total suspended solid. The pretreated wastewater was then processed using ozonation for 2.5 hours. The result showed that at various concentration of ozone, maximum COD removal was 90.78% which was achieved at 5.86 %mol/mol of Ozon and volumetric flow rate 50 ml/min. It was found that the degradation process followed the pseudo-first order kinetic model. The obtained pseudo-first order rate constants for volumetric rate of 50 mil/min were 0.0307 min-1, 0.0419 min-1 and 0.053 min-1 for ozon concentration of 2.70 %, 4.25%, 5.86 % mol/mol respectively. The residence time were 41 minutes, 31 minutes and 23 minutes for ozone concentration of 2.70 %, 4.25%, 5.86 % mol/mol respectively. These findings offers an alternative treatment for wastewater containing dyes.
1 Introduction
Yarn dyeing industry generates large amount wastewater with high color intensity, high chemical oxygen demand (COD), suspended solids and some heavy metals. The dyes may be carcinogenic and mutagenic which are harmful for human beings. The dyes have a complex aromatic molecular structure which is difficult to biodegrade [1,2]. Physical methods which are known to be used in the treatment usually used as primary treatment such as precipitation,adsorption, and chemical coagulation. Since the COD content is quite high enough after the primary treatment, it is further treated by other treatment such as chemical degradation or biodegradation. Biological process is slower, requires large area especially in the process of color removal. The electrochemical technique has been used which removed color but not the COD content [3].
Chemical processes are generally more simple in application and need oxidizing agents such as hydrogen peroxide, ozone and hydroxyl radicals. The process is known as Advanced Oxidation Process. Ozone is a strong oxidation agent (Eo= 2.07 V) which has been used to oxidize wastewater contained phenols and cyanides [4]. Due to its dipolar nature, ozone can either react as an electrophilic and nucleophilic agent or cause dipolar cycloaddition with most of the compounds with double bonds [5]. As a powerful oxidizing agent, ozone can
breakdown the double bonds of dye chromophores and also other functional groups such as complex aromatic rings of dyes [6]. The wastewater used in this study was collected from yarn dyeing industry located in southern part area of Surabaya.
The mechanism of ozonation, follow two main paths: a direct path corresponding to the action of molecular ozone, and an indirect path is a result from the decomposition of ozone to radicals, in which the reaction is initiated by hydroxyl ions (OH-) [7].The wastewater has a lot of azo dyes which is an aromatic double bonds as can be seen in Figure 1. The wastewater was treated using electrocoagulation in batch system prior ozonation.
Fig.1. chemical structure of azo dye.
Table 1. Characteristic of wastewater
2 Materials and Methods
2.1. Materials
2.1.1 Wastewater
Wastewater used in this study was collected form yarn dyeing industry located in southern part area of
Surabaya. Since the fluctuation of wastewater
characteristic, we have two types of wastewater with different COD.The wastewater used to study effect of flow rate had a COD content about 1300 ppm prior electrocoagulation and 780 ppm after electrocoagulation. Other experiments for parameter of ozone concentration and pH used wastewater with characteristic as shown in Table 1.
2.1.2. Ozone and oxygen gases
Ozone was generated from oxygen by Ozone generator (Viresco, Singapore). The ozone output was adjusted from 0-50 g/h. The oxygen ouput at 5-15 L/min. The exit port of ozone generator is connected with deep tube and the ozone gas was delivered to the reactor through tube sparger at the bottom of the reactor. The residual ozone was decomposed by trapping excess ozone at the reactor outlet which is connected to 2% potassium iodide (KI) solution trap.
2.2. Combined Electrocoagulation and Continuous Stirred Tank Reactor (CSTR)
An electrocoagulation (EC) reactor with 1.5 L volume was used. The real wastewater was taken form yarn industry located in Surabaya, East Java province, Indonesia. Anode and Cathode Al/Al was used with a
distance between two electrodes was 2 cm. The electrodes were connected to DC power supply. The size of Alumunium plate was 8 cm x 8 cm, with a thickness of 2 mm.
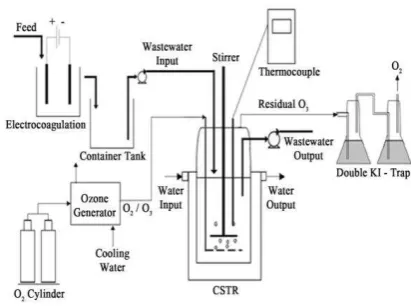
The EC process was run for 10 minutes and used a method as described by Riadi et al. [8]. The effluent from EC process was then collected and used as influent for ozonation process. A CSTR with 1250 mL volume was developed using a glass vessel connected to collection tank of effluent from electrocoagulation process. Ozone fed to CSTR from ozone generator and diffused through a diffuser in a bottom of reactor.The system used in the experiment can be seen in Figure 2.
2.3. Analysis of wastewater
COD was measured using closed reflux, colorimetric method based on Standard Methods for the Examination of Water and Wastewater [9]. Total Suspended solid was measured using dried method, color measurement was conducted using UV-Vis spectrophotometer at 498 nm wavelength based on Standard Methods for the Examination of Water and Wastewater [9].
The wastewater was also analysed using GC-MS to find out the components of dye in the wastewater. The GC serie is Agilent 7890 and the MS is agilent 5975, the column used was HP5MS, 30 m length and the diameter is 0.2 m. Ozone concentration trapped in KI solution was measured using sodium thiosulfate tritation procedure. Ozone consumed was calculated as: Ozone produced – Ozone trapped in KI trapper, with an assumption there is no ozone left to the environment.
Fig. 2. Scheme of ozonation in CSTR
2.4. Ozonation process
Ozonation process was carried out to evaluate the performance of COD degradation in a CSTR with working volume of 800 mL, and agitation of 200 rpm at 30oC. The parameters used in the experiment were
hours. pH and conductivity were measured using pH meter and counductivity-meter from METTLER.
3 Results and Discussions
3.1. Effect of ozone concentration
Experiments were carried out at 2.7 % mol/mol , 4.25 % mol/mol and 5.86 % mol/mol of ozone concentration with the wastewater flow rate (v) of 50 mL/minute. Ozone was assumed dissolved perfectly in wastewater, so the reaction can be considered as homogenous reaction. Since ozone was fed in excess then the reaction (1), is a pseudo first order reaction with z = stochiometri coefficient.
O3 + z COD --- degraded pollutant (1)
In a CSTR model [10] , we get :
(2)
By rearranging equation (2), we get :
(3)
Cao = initial COD concentration, Caf = final COD
concentration, = space time, k= first order kinetic constant.
The pseudo first order model fit with the data at the first 10 minutes of ozonation (Fig.3), hence based on the equation (3), we can calculate the pseudo first order kinetic constant at different ozone concentration as can be seen in Table 2.
Table 2. Pseudo-first order kinetic constant at different [O3]
Ozone
concentration at steady state, k’= pseudo first order kinetic constant which is = k x CO3.
The value of k’ using 5.86% mol/mol ozone was similar to k’ from batch experiment which was 0.0521 min-1. The pseudo first order kinetic constant in batch
experiment was also obtained at the first 10 minutes of ozonation and also used 5.86 %mol/mol ozone [11]. Result from the experiment showed that higher concentration of ozone will result in higher COD removal efficiency as can be seen in Fig.3. If we used 150 minutes timeline from the experiments, the percentage removal of COD were 33.17%; 49.57% and 90.78% for 2.7% , 4.25 %, 5.86% mol/mol ozone respectively.
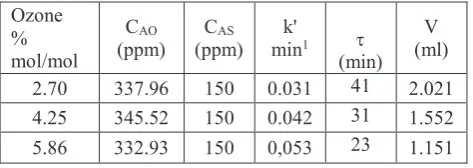
Since the allowable COD concentration to be discharged is 150 ppm (East Java province regulation), then we can recalculate the space time and reactor volume needed using the value of k’ as stated in Table 2.
To get 150 ppm of COD concentration in the wastewater at 50 mL/min flowrate (), we need bigger reactor volume (V) and longer space time () for lower ozone concentration (Table 3).
Fig.3. COD profile at different ozone concentration,(♦) 2.7% Ozone , (■) 4.25%, Ozone (▲) 5.86% Ozone.
Table 3. Value of pseudo first order kinetic constant at different ozone concentration
3.2. Effect of wastewater volumetric flow rate.
The ozone concentration used in the experiment was 4.25% mol/mol, the flow rate variable were 30,50,70 mL/minute. Result from this study showed that higher flow rate of wastewater will result in lower removal of COD as can be seen at Table 4. The experiment result of COD profile was similar to that in simulated model as written in equation (3) as presented in Fig.4. The best removal of COD was at flow rate of 30 mL/min. By working with smaller flow rate at constant volume ,we have bigger space time and we will have higher conversion in a single CSTR.
Table 4. Removal of COD (%) at different flow rate using 4.25 % mol/mol Ozone
flow rate (), mL/min % removal of COD
30 80.09
50 77.6
70 67.84
Fig.4. Removal of COD in ozonation process.(♦) 30mL/min experiment,(■)50mL/minexperiment,(▲)70mL/min
experiment. (---)30mL/min,model, (–)50mL/min,model, (....)70mL/min,model
3.3 Profile of pH and conductivity during ozonation process
There is no significant change of pH and conductivity during ozonation process, pH and conductivity practically remained constant, it can be seen that pH after ozonation decreased in only 0.4 units ( Fig.5).
Fig. 5. pH profile during ozonation (■) 2.7% ozone,(♦) 4.25% ozone, (▲) 5.86% ozone
Conductivity after treatment is slightly reduced (Fig.6). It implied that the Total Dissolved Solid (TDS) in the wastewater was stable. Both parameters were determined along the ozonation reaction as a function of mg of ozone/L consumed. This result is similar with the previous work done by Sarasa et.al [12]. Ozonation doesn’t have any effect in pH and conductivity, so the treatment doesn’t give additional cost to adjust the pH after the treatment. Moreover, ozonation works better in alkaline medium, since the oxidation capacity of ozone may increase due to the formation of highly reactive hydroxyl radicals (HO●) with Eo = 2.8eV, which can
attack the double bonds of dye chemical effectively.
Fig.6. Conductivity profile during ozonation (■) 2.7% ozone, (♦) 4.2% ozone, (▲) 5.86% ozone.
4 Conclusion
Ozone treatment is very effective in removing compounds derived from yarn dyeing manufacture, The optimum performance of ozonation was 23 minutes of space time with 1150 mL reactor volume, 50 mL/min volumetric flow rate and 5.86 % mol/mol of ozone. The pseudo first order kinetic constant was 0.053 min-1.There
is no significant change of pH and conductivity during the ozonation process.
We thank to BA yarn dyeing manufacture for financial support for the project and Laboratory of Reaction Engineering staffs for their help in carrying out this study.
References
1. N. Azbar, T. Yonar, K. Kestioglu, Chemosphere
55,35-43 (2004)
2. R. G. Saratale. G. D. Saratale, J. S Chang, S. P. Govindwar, J. Taiwan Inst. Chem. Eng., 42,138-157 (2011)
3. G. R. P. Malpass, D. W. Miwa, D. A. Mortari, S. A. S. Macado, A. J. Motheo, Water Res., 41, 2969-2977 (2007)
5. P. R. Gogate, A. B. Pandit, Adv. Environ. Res., 8, 501-551 (2004)
6. Q. Ruijuan, X. Bingzhe, M. Lingjun, W. Liansheng, W. Zunyao, Water Res., 68, 316-327 (2015)
7. A. M. Dore, N. Merlet, B. Legube, J. P. Croue , Ozone Sci. Eng., 10, 153-172(1988)
8. L. Riadi, W. Ferydhiawati, L. D. S. Loeman, Reaktor, 15, 73-78 (2014).
9. APHA, Standard Methods for the Examination of Water and Wastewater (American Public Health Association, 1998)
10. H. S. Fogler, Essentials of Chemical Reaction Engineering (Prentice Hall, 2011)
11. L. Riadi, A. Altway, S. M. Vania, A. Widyasayogo, Journal WPT, 12, 690-697(2017)