ECONOMIC GROWTH, INCOME INEQUALITY, AND POVERTY REDUCTION
IN RIAU PROVINCE 2002-2008
D.S. Priyarsono
Department of Economics, Bogor Agricultural University Ajid Hajiji
Statistics Office, Rokan Hilir District, Riau Province
Abstract
In the literature of development economics there are two well known propositions about poverty reduction. Firstly, poverty can be reduced by promoting economic growth (increasing income average) and by improving income distribution (reducing inequality). Secondly, increasing economic growth may worsen income distribution. This study attempts to empirically test these propositions by using panel data of an oil-rich Province of Riau in 2002-2008. It was found that economic growth did increase income inequality measured by Gini index. However, the worsening income inequality did not significantly effect poverty rate. Therefore, the positive effect of economic growth in reducing poverty dominated its negative effect on income distribution. This study also found that there were four sectors (constructions, trade-hotel-restaurant, finance-rent-corporate services, and transportation & communication) whose growth effectively reduced poverty. Surprisingly enough, agriculture sector in which most poor people work did not effectively reduce poverty.
Keywords: economic growth, income inequality, poverty reduction, Riau Province Introduction
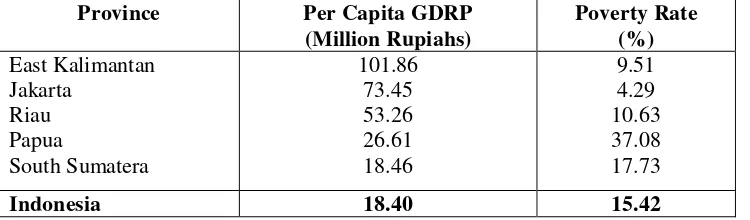
Riau Province consists of nine districts and two municipalities covering an area of 81,359 square kilometers. In 2008 the population size was 5,189,154. This province is one among the richest provinces in Indonesia because of its abundant natural resources especially oil. However, the poverty rate of this province is still relatively high, i.e. 10.63% in 2008, decreased from 15.39% in 2002. Table 1 shows a comparison of per capita Gross Domestic Regional Product (GDRP) and poverty rate among selected provinces in 2008.
Table 1. Per Capita GDRP and Poverty Rate of Selected Provinces and Indonesia (2008)
Province Per Capita GDRP
(Million Rupiahs)
Poverty Rate (%) East Kalimantan
Jakarta Riau Papua
South Sumatera
101.86 73.45 53.26 26.61 18.46
9.51 4.29 10.63 37.08 17.73
Indonesia 18.40 15.42
Source: Statistics Indonesia (2009)
During the period of 2002-2008 economic growth of Riau Province (without oil and gas) was 8.35%. However, if oil and gas are included, then the rate in the period was only 3.95%. From the point of view of spatial distribution, Pekanbaru Municipality experienced the highest economic growth, i.e. 10.21%; where as oil rich districts experienced lower rates, e.g., Siak District (1.85%), Bengkalis District (2.26%), and Rokan Hilir District (2.77%).
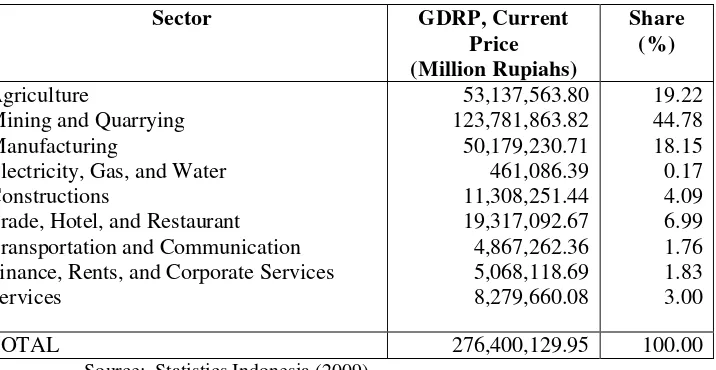
Table 2. Sectoral GDRP of Riau Province (2008)
Sector GDRP, Current Finance, Rents, and Corporate Services Services
Interindividual income inequality in Riau Province tended to worsen during 2002-2008. The Gini index increased from 0.273 in 2002 to 0.306 in 2008. This data indicate that the high economic growth has been accompanied by a worsening income distribution.
This study attempts to analyze the impacts of economic growth and income inequality on poverty reduction in Riau Province. It also attempts to identify the contribution of economic sectors in reducing poverty rate in the province.
Literature Review
Kuznets (1955) hypothesized that the relationship between per capita national income and income inequality could be described with an inverted U-curve. In an early stage of economic development, there is a positive correlation between the variables, i.e., an increase of per capita national income is accompanied by an increase of the income inequality. Eventually, when the income level reaches a certain point, the correlation approaches zero, and then it becomes negative, i.e., a further economic development indicated by higher per capita income is accompanied by a better income distribution.
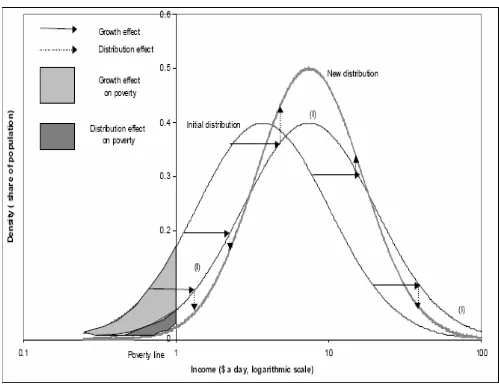
In general, economists agree that economic growth is important for poverty reduction (Perry et al, 2006). The benefit of rapid economic growth spreads to people of all income level groups. This phenomenon is known as the trickle down effects, a theory that was widely accepted in the decades of 1950s and 1960s. A high economic growth increases economic capacity as well as per capita income, and consequently, it reduces poverty. It is obvious, therefore, that economic growth is good for poverty reduction.
Figure 1.
Decomposition of Change in Distribution and Poverty into Growth and Distributional Effect
(Bourguignon, 2004)
Several empirical studies tested the aforementioned hypothesis. Lin (2003) reported China’s experience during the period of 1985-2001. It was reported that economic growth effectively reduced poverty. However, at the same time, the increasing income inequality that was created by the economic growth decreased the effectiveness of the effort to reduce poverty.
Ravallion (2006) studied the effects of income inequality on poverty in India and China in 1980-2000. He found that, similar to Lin’s findings, economic growth reduced poverty in the two countries, and income inequality deceased the effectiveness of poverty reduction. Furthermore, he also reported that poverty reduction needed a combination of economic growth, a sort of “pro-poor” pattern of economic growth, and income inequality reduction.
Warr (2006) found that poverty reduction was closely related to growth of agriculture and services sectors. He used the data of four Southeast Asian countries, i.e. Indonesia, Thailand, Malaysia, and the Philippines.
Hidayat and Patunru (2007) found that in Indonesia economic growth in the provincial level created income inequality, but it also reduced poverty. This phenomenon, however, did not reduce the effectiveness of poverty reduction.
This literature survey can be concluded by three points of research findings, i.e., (1) economic growth is very important for poverty reduction, (2) there is no strong evidence that economic growth creates better or worse income distribution, and (3) improvement of income distribution (decreasing the variance of income) effectively helps poverty reduction.
Methodology
Following Wodon (1999) and Hidayat & Patunru (2007), in this study econometric equations are set to model the relationships (1) between Gini indices (G) and GDRP (Y), and (2) between the number of people under the poverty line (P) and its influencing variables, i.e.,YandG, as follows.
logGit =αi+βilogYit+εit... (1) logPit = ωi+γilogYit+δlogGit+νit ... (2) λ = γ+ (βxδ) ... (3)
In these equations, i and t are indices for districts/municipalities and time, respectively. The error terms are represented by ε and ν. Parameter β is income inequality elasticity of economic growth, where as parameter γ stands for poverty elasticity of economic growth, and parameter δ represents poverty elasticity of income inequality. Parameterλrepresents poverty elasticity of both economic growth and income distribution.
The equations are, respectively, used for identifying the impact of economic growth on income inequality, identifying the impact of of economic growth and income inequality on poverty, and identifying the net impact of economic growth on poverty reduction.
To answer the second research question, this study follows Warr (2006). He assumed that the number of people under the poverty line depends on aggregate income and population size (N). The relationship is represented by the following equation.
logPit = α+bjlogHjitYjit+clogNit+ζit ... (4)
In this EquationHjitstands for the share of j-sector toi-district’s (or municipality’s) GDRP in year-t, where asN represents population size.
All data for this study are from Statistics Indonesia (the BPS, Badan Pusat Statistik), including results of the SUSENAS (the national social and economic survey). GDRP is measured by using constant price. A fixed effect model of panel data analysis (Baltagi, 2007) was applied to estimate the parameters.
Impacts of Economic Growth on Income Inequality
Estimation of the parameter in Equation (1) resulted in statistically very significant value of β = 0.5141 (significance level 1%). It means, an increase in GDRP by 1% would increase income inequality (measured as Gini index) as much as 0.5141%. This result can be interpreted as follows.
Impacts of Economic Growth And Income Inequality on Poverty Reduction
Estimation of the parameters in Equation (2) resulted in statistically very significant value of γ = -0.6353 (significance level 1%). It means, an increase in an increase of GDRP by 1% would decrease poverty rate by 0.75%,ceteris paribus. On the other hand, income inequality measured by Gini index does not apparently effect poverty rate (the parameter,δ= 0.0332, is statistically insignificant).
This finding implies that policy to reduce poverty by promoting economic growth (e.g., developing infrastructures to attract new investments) is likely more effective than that by improving income distribution (e.g., progressive taxation, subsidies for the poor). This can be a dilemma, because in order to reduce poverty, the policy of promoting economic growth (which can worsen income inequality and hence be socially less acceptable) is more effective than that of improving income distribution (that sounds socially more acceptable).
The ineffectiveness of reducing poverty by improving income distribution is probably due to the low Gini index of Riau Province, i.e., 0.306. According to Todaro and Smith (2006), a Gini index within the range of 0.20-0.35 indicates a relatively equal income distribution. The World Bank (2006) asserted that the principal component of poverty alleviation in Indonesia is through economic growth. This is in accordance with an opinion (Perry et al, 2006) that in a country where per capita income is relatively low and the income distribution is relatively equal, to reduce poverty promoting economic growth is more effective than improving income distribution.
Impacts of Economic Growth on Poverty Reduction
Parameter λ in Equation (3) indicates the net impact of economic growth on poverty reduction. The statistical estimation resulted in λ = -0.744 which is slightly less than γ = -0.75, in absolute terms. The gross effect of economic growth on poverty reduction was partly slightly cancelled out by the fact that it worsened income distribution which hampered poverty reduction.
Following Kakwani and Pernia (2000), an index of pro-poor growth can be calculated as φ = λ/ γ = 0.9731. It indicates that, from the point of view of poverty reduction, the positive impacts of economic growth in Riau Province is significantly greater than its negative impacts.
Impacts of Sectoral Growth on Poverty Reduction
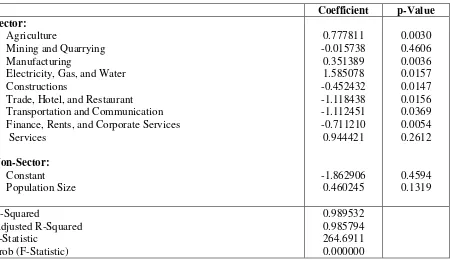
In order to identify the impacts of sectoral growth on poverty reduction, Equation (4) was utilized. Among the nine sectors (see Table 2), there are only four sectors the growths of which reduced poverty, i.e., (1) constructions, (2) trade, hotel, and restaurant, (3) finance, rentals, and corporate services, and (4) transportation and communication. The growths of the other sectors (agriculture, mining & quarrying, manufacturing, electricity-gas-water, transportation & communication, and services) did not reduce poverty. Table 3 reports the results of the statistical analysis.
Surprisingly, the growth of agriculture sector, where poor people are generally employed, did not significantly reduce poverty. A possible explanation relies on the fact that this sector is significantly dominated by forestry (with the share of 36.46%) and big plantations (with the share of 36.19%). These sub-sectors are more capital intensive than labor intensive. Consequently, growths of these sub-sectors do not significantly reduce poverty.
Table 3. Results of the Statistical Analysis of Equation (4):
Impacts of Sectoral Growth on Poverty Reduction
Coefficient p-Value Finance, Rents, and Corporate Services
Services
The results of this study reconfirm the propositon that economic growth effectively reduce poverty. At the same time they also show that economic growth increase income inequality and hence hamper the effort to reduce poverty. However, the positive impact dominates the negative one. These findings may imply that policy of poverty reduction by promoting economic growth is more effective than by improving income distribution. The validity of this implication is yet to be tested within a more specific research design.
This study identifies sectors whose growths effectively reduce poverty. The finding that the growth of agriculture sector does not effectively reduce poverty may be explained by the fact that this sector in Riau Province consists of big plantations and forestry that are more capital intensive rather than labor intensive. Some statistical results in this study to identify the sectors leave several unanswered questions, such as the positive coefficient for the sector of Electricity, Gas, and Water (which means that growth of this sector does increase poverty), and the statistical insignificance of some other coefficients indicating that the corresponding sectors’ growths do not decrease poverty rate. Again, this unclear conclusions should lead to new research questions for the next project.
References
Baltagi, H. 2007. Econometric Analysis of Panel Data. John Wiley, New York.
Bourguignon, F. 2004. The Poverty-Growth-Inequality Triangle. Indian Council for Research on International Economic Relations, New Delhi.
Hidayat, S. and A. A. Patunru. 2007. Pertumbuhan Ekonomi, Ketidakmerataan Pendapatan dan Kemiskinan: Estimasi Parameter Elastisitas Kemiskinan Tingkat Provinsi di Indonesia Tahun 1996-2005. (Economic Growth, Income Inequality, and Poverty: Estimation of Parameter for Provincial Level Poverty Elasticity in Indonesia). Universitas Indonesia, Jakarta.
Kakwani, N. and E. M. Pernia. 2000.What is Pro-poor Growth? Asian Development Review, Vol. 18, No. 1, pp. 1-16.
Lin, Bo Q. 2003. Economic Growth, Income Inequality, and Poverty Reduction in People’s Republic of China. Asian Development Review, Vol. 20, No. 2, pp. 105-124.
Perry, G.E.,et al. 2006. Poverty Reduction and Growth: Virtuous and Vicious Circles. World Bank, Washington. Ravallion, M. 2005. A Poverty-Inequality Trade-off. Journal of Economic Inequality, No. 3., pp. 169-181.
---. 2006. Inequality is Bad for the Poor. World Bank Policy Research Working Paper 3677, August 2006.
Tadjoeddin, M. Z., et al. 2001. Regional Disparity and Center-Regional Conflicts in Indonesia. Working Paper UNSFIR, 01/01-E (Feb., 2001), Jakarta.
Todaro, M. and S.C. Smith, 2006. Economic Development. Addison Wesley Longman, London.
Warr, P., 2006. Poverty and Growth in Southeast Asia. ASEAN Economic Bulletin, Vol. 23, No. 3, pp. 279 – 302. The Asian Development Bank.
Acknowledgements
The authors gratefully acknowledge the financial support from the Statistics Indonesia (Badan Pusat Statistik) and invaluable advices from Dr. Dedi Walujadi during the process of this research. Any errors that may remain are solely the authors’ responsibility.
Endnote