Lampiran 1
Kuesioner Penelitian
Hubungan Faktor Resiko dengan Terjadinya Nyeri Punggung Bawah
(
Low Back Pain)
Pada Tenaga Kerja Bongkar Muat (TKBM) Di Pelabuhan
Belawan Medan Tahun 2015
Nomor Responden
:
I.
Faktor Personal
1. Umur
:
2. BB (berat badan)
:
3. TB (tinggi badan)
:
4. IMT (Indeks Masa Tubuh)
:
5. Masa kerja
:
6. Apakah anda seorang perokok?
a. Ya
b.Tidak
7. Berapa kali anda melakukan kegiatan olahraga dalam seminggu ?
1. Sering ( ≥ 3 kali sering )
2. Kadang ( 1- 2 kali seminggu )
3. Jarang ( 1- 3 kali sebulan )
Lampiran 1
II.
Faktor pekerjaan
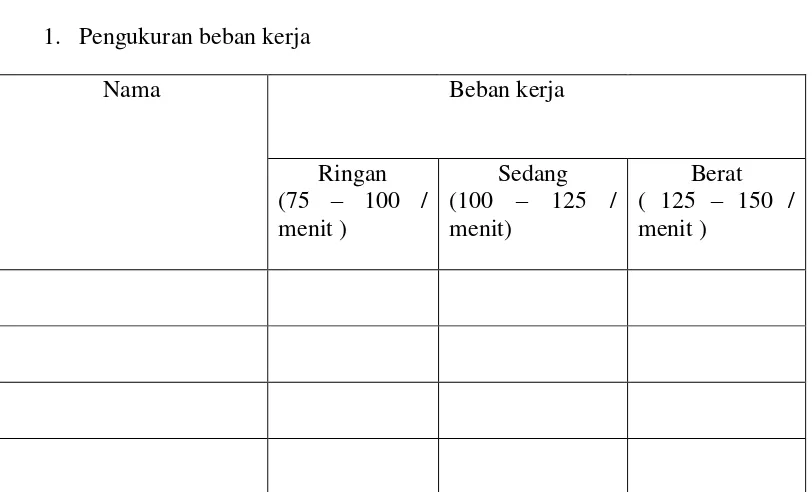
1.
Pengukuran beban kerja
Nama
Beban kerja
2.
Pengukuran Sikap Kerja Dengan Metode REBA
(Rapid Entry Body
Assesment)
Tabel A.
1.
Pergerakan Leher
Lampiran 1
2.
Pergerakan Punggung
Skor :
3.
Pergerakan Kaki
Lampiran 1
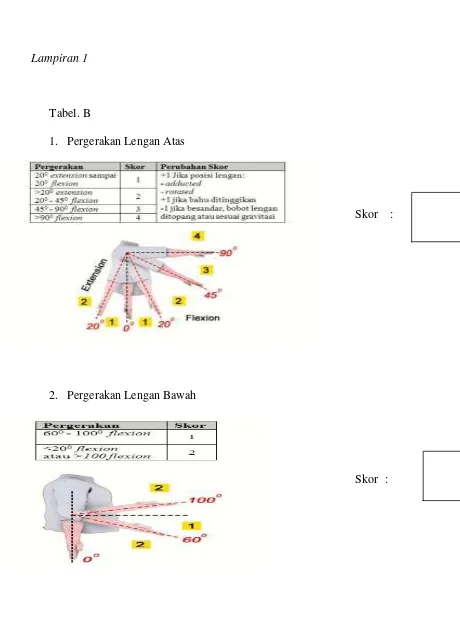
Tabel. B
1.
Pergerakan Lengan Atas
Skor :
2.
Pergerakan Lengan Bawah
Lampiran 1
3.
Pergerakan Pergelangan
Skor
:
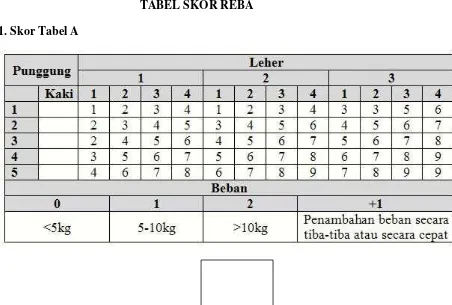
TABEL SKOR REBA
Lampiran 1
Lampiran 1
Sikap Kerja TKBM Pelabuhan Belawan
Keterangan sikap kerja :
1.
Pergerakan leher 12
02.
Pergerakan punggung 80
03.
Pergerakan kaki 40
04.
Pergerakan lengan atas 20
0Keterangan sikap kerja :
1.
Pergerakan punggung 60
02.
Pergerakan kaki 40
03.
Pergelangan lengan atas 20
060
◦
40
Keterangan sikap kerja :
1.
Pergerakan leher 15
02.
Pergerakan punggung 80
03.
Pergerakan kaki 60
04.
Pergerakan lengan bawah 60
05.
Pergerakan pergelangan 15
0MASTER DATA
HUBUNGAN FAKTOR RESIKO DENGAN TERJADINYA NYERI PUNGGUNG BAWAH (
LOW BACK PAIN
) PADA
TENAGA KERJA BONGKAR MUAT ( TKBM ) DI PELABUHAN BELAWAN TAHUN 2015
Umur TKBM * Low Back Pain
Crosstabs
Case Processing Summary
Cases
Valid Missing Total
N Percent N Percent N Percent
Umurk * Low Back Pain 64 54.2% 54 45.8% 118 100.0%
Umurk * Low Back Pain Crosstabulation
Low Back Pain
95% Confidence Interval
Lower Upper
Odds Ratio for Umurk (1 / 2) .259 .090 .750
For cohort Low Back Pain =
For cohort Low Back Pain =
Control 2.053 1.098 3.837
N of Valid Cases 64
IMT TKBM * Low Back Pain
Crosstabs
Case Processing Summary
Cases
Valid Missing Total
N Percent N Percent N Percent
IMTK * Low Back Pain 64 54.2% 54 45.8% 118 100.0%
IMTK * Low Back Pain Crosstabulation
Risk Estimate
Value
95% Confidence Interval
Lower Upper
Odds Ratio for IMTK (< 18.4
/ 18.5 - 25.0) .312 .031 3.170
Masa Kerja TKBM *Low Back Pain
Crosstabs
Case Processing Summary
Cases
Asymp. Sig.
(2-sided)
Exact Sig.
(2-sided)
Exact Sig.
(1-sided) Point Probability
Pearson Chi-Square 1.067a 1 .302 .613 .306
Continuity Correctionb .267 1 .606
Likelihood Ratio 1.113 1 .291 .613 .306
Fisher's Exact Test .613 .306
Linear-by-Linear Association 1.050c 1 .306 .613 .306 .250
N of Valid Cases 64
a. 2 cells (50.0%) have expected count less than 5. The minimum expected count is 2.00.
b. Computed only for a 2x2 table
Masak * Low Back Pain Crosstabulation
Asymp. Sig.
(2-sided)
Exact Sig.
(2-sided)
Exact Sig.
(1-sided) Point Probability
Pearson Chi-Square 6.667a 1 .010 .019 .010
Continuity Correctionb 5.400 1 .020
Likelihood Ratio 6.823 1 .009 .019 .010
Fisher's Exact Test .019 .010
Linear-by-Linear Association 6.562c 1 .010 .019 .010 .008
N of Valid Cases 64
a. 0 cells (.0%) have expected count less than 5. The minimum expected count is 12.00.
b. Computed only for a 2x2 table
Risk Estimate
Value
95% Confidence Interval
Lower Upper
Kebiasaan Merokok TKBM * Low Back Pain
Crosstabs
Case Processing Summary
Cases
Valid Missing Total
N Percent N Percent N Percent
Rokok * Low Back Pain 64 54.2% 54 45.8% 118 100.0%
Rokok * Low Back Pain Crosstabulation
Total Count 32 32 64
95% Confidence Interval
Lower Upper
Asymp. Sig.
(2-sided)
Exact Sig.
(2-sided)
Exact Sig.
(1-sided) Point Probability
Pearson Chi-Square .160a 1 .689 1.000 .500
Continuity Correctionb .000 1 1.000
Likelihood Ratio .161 1 .688 1.000 .500
Fisher's Exact Test 1.000 .500
Linear-by-Linear Association .158c 1 .691 1.000 .500 .287
N of Valid Cases 64
a. 2 cells (50.0%) have expected count less than 5. The minimum expected count is 3.50.
b. Computed only for a 2x2 table
Kebiasaan Olahraga TKBM * Low Back Pain
Crosstabs
Case Processing Summary
Cases
Valid Missing Total
N Percent N Percent N Percent
Olahraga * Low Back Pain 64 54.2% 54 45.8% 118 100.0%
Olahraga * Low Back Pain Crosstabulation
Chi-Square Tests
Value Df
Asymp. Sig.
(2-sided)
Exact Sig.
(2-sided)
Exact Sig.
(1-sided) Point Probability
Pearson Chi-Square 6.478a 1 .011 .021 .011
Continuity Correctionb 5.247 1 .022
Likelihood Ratio 6.610 1 .010 .021 .011
Fisher's Exact Test .021 .011
Linear-by-Linear Association 6.377c 1 .012 .021 .011 .008
N of Valid Cases 64
a. 0 cells (.0%) have expected count less than 5. The minimum expected count is 13.00.
b. Computed only for a 2x2 table
c. The standardized statistic is -2.525.
Risk Estimate
Value
95% Confidence Interval
Lower Upper
Odds Ratio for Olahraga
Lama Kerja TKBM * Low Back Pain
Crosstabs
Case Processing Summary
Cases
Valid Missing Total
N Percent N Percent N Percent
Lama * Low Back Pain 64 54.2% 54 45.8% 118 100.0%
Lama * Low Back Pain Crosstabulation
Risk Estimate
Value
95% Confidence Interval
Lower Upper
Beban Kerja TKBM *Low Back Pain
Crosstabs
Case Processing Summary
Cases
Asymp. Sig.
(2-sided)
Exact Sig.
(2-sided)
Exact Sig.
(1-sided) Point Probability
Pearson Chi-Square .217a 1 .641 1.000 .500
Continuity Correctionb .000 1 1.000
Likelihood Ratio .218 1 .640 1.000 .500
Fisher's Exact Test 1.000 .500
Linear-by-Linear Association .214c 1 .644 1.000 .500 .323
N of Valid Cases 64
a. 2 cells (50.0%) have expected count less than 5. The minimum expected count is 2.50.
b. Computed only for a 2x2 table
bebankerja * Low Back Pain Crosstabulation
Asymp. Sig.
(2-sided)
Exact Sig.
(2-sided)
Exact Sig.
(1-sided) Point Probability
Pearson Chi-Square 5.189a 1 .023 .042 .021
Continuity Correctionb 4.100 1 .043
Likelihood Ratio 5.269 1 .022 .042 .021
Fisher's Exact Test .042 .021
Linear-by-Linear Association 5.108c 1 .024 .042 .021 .016
N of Valid Cases 64
a. 0 cells (.0%) have expected count less than 5. The minimum expected count is 13.50.
b. Computed only for a 2x2 table
Risk Estimate
Value
95% Confidence Interval
Lower Upper
Odds Ratio for bebankerja
(Ringan / sedang) .304 .108 .861
Sikap Kerja TKBM * Low Back Pain
Crosstabs
Case Processing Summary
Cases
Valid Missing Total
N Percent N Percent N Percent
Sikap * Low Back Pain 64 54.2% 54 45.8% 118 100.0%
Sikap * Low Back Pain Crosstabulation
% of Total 26.6% 12.5% 39.1%
95% Confidence Interval
Lower Upper
Odds Ratio for Sikap