Competitive Cities and Climate Change
Lamia Kamal-Chaoui and Alexis Robert (eds.)
JEL Classification: Q54, Q55, Q58, Q42, Q48, R00
Please cite this paper as:
OECD REGIONAL DEVELOPMENT WORKING PAPERS
This series is designed to make available to a wider readership selected studies on regional development issues prepared for use within the OECD. Authorship is usually collective, but principal authors are named.
The papers are generally available only in their original language English or French with a summary in the other if available.
The opinions expressed in these papers are the sole responsibility of the author(s) and do not necessarily reflect those of the OECD or the governments of its member countries.
Comment on the series is welcome, and should be sent to either gov.contact@oecd.org or the Public Governance and Territorial Development Directorate, 2, rue André Pascal, 75775 PARIS CEDEX 16, France.
---
OECD Regional Development Working Papers are published on
www.oecd.org/gov/regional/workingpapers
---
Applications for permission to reproduce or translate all or part of this material should be made to: OECD Publishing, rights@oecd.org or by fax 33 1 45 24 99 30.
ABSTRACT
Cities are part of the climate change problem, but they are also a key part of the solution. This report offers a comprehensive analysis of how cities and metropolitan regions can change the way we think about responding to climate change. Cities consume the vast majority of global energy and are therefore major contributors of greenhouse gas emissions. At the same time, the exposed infrastructure and prevalent coastal location of many cities makes them common targets for climate change impacts such as sea level rise and fiercer storms. This report illustrates how local involvement through “climate-conscious” urban planning and management can help achieve national climate goals and minimise tradeoffs between environmental and economic priorities. Six main chapters analyse the link between urbanisation, energy use and CO2 emissions; assess the potential contribution of local policies in reducing global energy demand and the trade-offs between economic and environmental objectives at the local scale; discuss complementary and mutually reinforcing policies such as the combination of compact growth policies with those that improve mass transit linkages; and evaluate a number of tools, including the “greening” of existing fiscal policies, financing arrangements to combat climate change at the local level, and green innovation and jobs programmes. One of the main messages of this report is that urban policies (e.g.
densification or congestion charges) can complement global climate policies (e.g. a carbon tax) by
reducing global energy demand, CO2 emissions and the overall abatement costs of reducing carbon emissions. To inform the groundswell of local climate change action planning, the report highlights best practices principally from OECD member countries but also from certain non-member countries.
JEL classification: Q54, Q55, Q58, Q42, Q48, R00
Keywords: Climate; Global Warming; Sustainable Development; Government Policy; Planning;
FOREWORD
This working paper is one in a series of OECD Working Papers on Regional Development of the
OECD Public Governance and Territorial Development Directorate.
This report has been produced and coordinated by Lamia Kamal-Chaoui (Head of the Urban Development Unit) and Alexis Robert (Policy Analyst) under the supervision of Joaquim Oliveira Martins (Head of the Regional Competitiveness and Governance Division). It draws on a number of internal contributions, including from Tadashi Matsumuto, Olaf Merk, Javier Reaza, Daniel Sanchez-Serra and Mario Piacentini. Marcos Bonturi (Deputy Chief of Staff of the Secretary-General, former Head of the Regional Competitiveness and Governance Division) provided valuable support in the report’s early stages.
The report has also benefitted from contributions outside the OECD Secretariat, including from Mathias Ruth and Rebecca Gasper (Center for Integrative Environmental Research, University of Maryland, College Park), Benoit Lefevre and Vincent Renard (IDDRI), and Fredrich Kahrl (Energy and Resources Group, University of California, Berkeley). Special thanks are given to Fabio Grazi and Henri Waisman (CIRED) for modelling work with IMACLIM-R and the urban module that incorporates the OECD metropolitan database.
We would also like to acknowledge those who have provided valuable comments on the report and relevant background material. In the OECD, they are Jan Corfee-Morlot, Shardul Agrawala, Jean-Marc Burniaux and Jean Chateau (Environment Directorate), Nigel Jollands and Sara Pasquier (International Energy Agency), Mary Crass and Phlippe Crist (International Transport Forum), Arthur Mickoleit and Tomoo Machiba (Directorate for Science, Technology and Industry), and Hiroshi Kobayashi, Aziza Akhmouch, Michael Donovan and Xiao Wang (Public Governance and Territorial Development Directorate). We are also grateful to Dale Medearis (Northern Virginia Regional Commission), Keith Thorpe (Communities and Local Government, Government of the United Kingdom), and Vincent Fouchier (Institut d’Aménagement et d’Urbanisme de la région d’Île-De-France).
The paper can be downloaded on the OECD website: www.oecd.org/gov/cities
Further enquiries about this work in this area should be addressed to:
• Lamia Kamal-Chaoui (lamia.kamal-chaoui@oecd.org) and Alexis Robert
(Alexis.robert@oecd.org) of the OECD Public Governance and Territorial Development Directorate.
Mario Pezzini, Deputy Director, Directorate for Public Governance and Territorial Development
TABLE OF CONTENTS
EXECUTIVE SUMMARY ... 9
1. Cities and climate change: a two-way relationship ... 9
2. Cities are not to be blamed – Urban form, lifestyles and energy sources are what count ... 9
3. Urban policies can contribute to a global climate agenda ... 10
4. Urban climate actions need a smart mix of policy instruments ... 11
5. Finance is an issue – greening local revenues and financing local green activities ... 13
6. Cities have a key role in fostering a green growth agenda ... 15
INTRODUCTION ... 17
REFERENCES ... 20
1. URBANISATION, ECONOMIC GROWTH AND CLIMATE CHANGE ... 21
1.1. The worldwide urbanisation process ... 21
1.2. Cities and economic concentration ... 30
1.3. Economic growth, energy use and greenhouse gas emissions ... 34
1.4. The urban form matters – the impact of sprawl ... 39
REFERENCES ... 50
2. CLIMATE CHANGE IMPACTS SPECIFIC TO URBAN REGIONS ... 51
2.1 Complex and fixed nature of urban infrastructure ... 51
2.2 Coastal flooding risks ... 52
2.3 Precipitation and storm impacts ... 55
2.4 Heat impacts and heat-island effects ... 56
2.5 Effects of increased drought and water scarcity ... 58
2.6 More acute impacts on health and the poor ... 60
2.7 The costs of urban inaction ... 61
REFERENCES ... 63
3. ECONOMIC BENEFITS OF CLIMATE ACTION: THE URBAN DIMENSION ... 65
3.1. Impact of urban policies on global energy demand and carbon emissions ... 65
3.2. Environment and economic growth at the urban scale: from trade-offs to complementarity ... 67
3.3. Benefits for non-climate policies ... 73
REFERENCES ... 76
4. THE URBAN POLICY PACKAGE ... 78
4.1 Urban governance and policy complementarities ... 78
Land-use zoning policies ... 81
Transportation policies ... 84
Urban utilities ... 95
Key urban policy packages ... 98
4.2 Density and spatial urban form in combating climate change ... 101
Impact on urban amenities and services ... 103
Spatial policy tools for low-carbon development ... 104
4.3 Strategic urban planning for climate change ... 106
REFERENCES ... 110
5. FINANCIAL INSTRUMENTS AND FUNDING NEW EXPENDITURE NEEDS ... 116
5.1 Financial instruments and incentives ... 116
Taxes ... 118
Fees and charges... 123
Grants ... 126
5.2 New urban expenditures and new funding sources ... 128
Carbon finance ... 130
Access to capital markets ... 133
5.3 An optimal mix of revenue sources ... 133
REFERENCES ... 135
6. CONTRIBUTION OF CITIES TO A GREEN GROWTH MODEL ... 138
6.1. Facilitating job creation in the green economy: the role of cities and regions ... 139
Investments in greener infrastructure and greener service provision ... 140
Urban energy management strategies for employment creation ... 145
Greening preferences to raise the size of green markets ... 150
6.2. Systemic changes through regional eco-innovation ... 152
REFERENCES ... 158
ANNEX A: COMPUTABLE GENERAL EQUILIBRIUM MODEL OF CITIES AND CLIMATE CHANGE (IMACLIM-R AND OECD METROPOLITAN DATABASE) ... 162
A.1 The Model and Methodology ... 162
Approach and capabilities of the model ... 162
The model ... 162
Consumption ... 164
Production ... 166
Short-run market equilibrium ... 167
The long-run model ... 169
A. 2 Main results of the model with a climate policy only ... 171
Tables Table 1.1. Categories of Urban Energy Use ... 37
Table 1.2. Total GHG Emissions for Ten World Cities ... 39
Table 2.1. Cities are highly concentrated in coastal zones ... 53
Table 3.1. GDP changes under implementation of alternative climate policy packages ... 71
Table 3.2. Related aims and co-benefits of sector policies to reduce GHGs at urban scale ... 74
Table 4.1. Matrix of interdependence of urban policy sectors ... 80
Table 5.1. Financial instruments in selected city's climate change plans ... 117
Table 5.2. Main urban congestion charges in operation and their environmental outcomes ... 125
Table 6.1. Green Firms and Green Jobs ... 140
Table 6.2. Top innovators in renewable energy ... 154
Figures Figure 1.1 Urban and Rural Population in the World and the OECD ... 22
Figure 1.2 Trends in Urbanisation by Continent... 23
Figure 1.3 Population Growth in OECD Regions... 25
Figure 1.4 Urbanisation in OECD Countries ... 26
Figure 1.5. Urban Concentration in Europe ... 26
Figure 1.6 Urban Concentration in Asian OECD Countries ... 27
Figure 1.7 Urban Concentration in North America ... 27
Figure 1.8 Urbanisation and City Size ... 28
Figure 1.9 Population Growth in OECD Metropolitan areas ... 29
Figure 1.10. Urbanisation and Income ... 31
Figure 1.11. Factors determining per capita GDP Differentials ... 32
Figure 1.12. Economic Concentration in Europe ... 33
Figure 1.13. Economic Concentration in Japan and Korea ... 34
Figure 1.14. US Energy Consumption by Sector, 1949-2008 ... 36
Figure 1.15. Total Energy Consumption in OECD Countries, 2007 ... 38
Figure 1.16. Carbon Emissions in US Cities ... 40
Figure 1.17. Urban Sprawl ... 41
Figure 1.18. Suburbanisation and Gentrification in OECD Metro-regions ... 42
Figure 1.19. Urbanisation and Energy Consumption ... 43
Figure 1.20. Urban Density and Electricity Consumption ... 44
Figure 1.21. Urbanisation and Carbon Emissions... 45
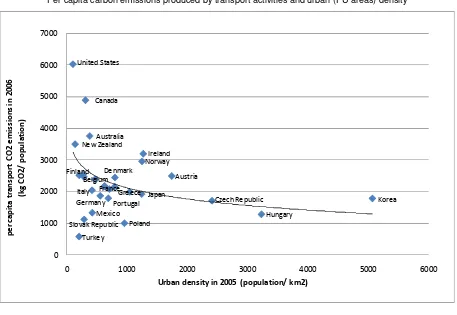
Figure 1.22. Urban Density and Carbon Emissions in Transport ... 46
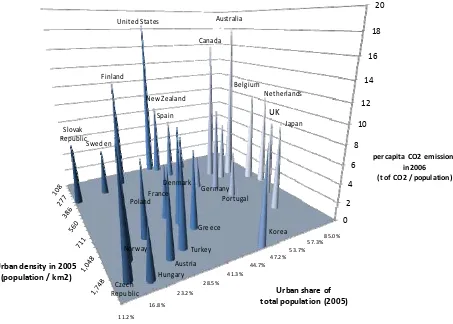
Figure 1.23. Urbanisation, Density and Carbon Emissions ... 47
Figure 1.24. CO2 Emissions in the OECD ... 48
Figure 1.25. Concentration of Carbon Emissions in the USA ... 49
Figure 2.1. Top 20 port cities’ exposed assets (a) and exposed population (b) ... 54
Figure 2.2. Apparent southward shift of European cities due to climate change, 2070-2100 ... 56
Figure 3.1. Energy Demand with a Densification Policy ... 66
Figure 3.2. Carbon Emission Reductions with a Densification Policy ... 67
Figure 3.3. Economic Growth with Local Policies ... 68
Figure 3.4. Trends in carbon emissions under climate policy compared with the baseline ... 70
Figure 3.5. Attractiveness and Carbon Emissions related to Automobiles across Metro-regions ... 72
Figure 3.6. Changes in Attractiveness and Local Pollution Emissions across Metro-regions ... 73
Figure 4.1. Sectoral Complementarities ... 81
Figure 4.2. Wedge Analysis ... 108
Figure 5.1. Main revenue sources of selected cities within the OECD ... 118
Figure 5.2. Main taxes of selected cities within the OECD ... 119
Figure 5.3. National, state and local motor vehicle taxes in unitary OECD countries (2006) ... 122
Figure 5.4. National, state and local fuel taxes in unitary OECD countries (2006) ... 122 Figure 5.5. National and sub-national expenditures on environmental protection in OECD countries
Figure 6.2. Estimated Levelised Cost of Generation, Various Technologies ... 147
Figure A.1. Economic Impact of a Climate Policy Alone using the Baseline Scenario ... 171
Boxes Box 2.1. Climate change, transportation and flood risk ... 52
Box 2.2. The urban heat island effect ... 58
Box 2.3. Barcelona's response to drought ... 59
Box 2.4. The high costs of storms ... 61
Box 3.1. A CGE Model of Metropolitan Economies ... 66
Box 3.2. Emission Targets and Modelling of Climate Policy ... 69
Box 4.1 Integrating adaptation into development planning ... 83
Box 4.2. The United Kingdom Eco-Town Programme ... 84
Box 4.3. Calgary’s electric light rail powered by wind ... 87
Box 4.4. Venice's MOSE flood protection system ... 89
Box 4.5. Multilevel governance building efficiency programmes ... 92
Box 4.6. The Merton Borough initiative ... 94
Box 4.7. Ile-de-France's Regional Master Plan to become first "Eco-Region" ... 105
Box 4.8. The Sustainable Shoreline Community Management in Northern Virginia project ... 107
Box 4.9. The San Francisco Bay Area Metropolitan Transportation Commission Transportation 2035 Plan ... 109
Box 5.1. Carbon tax in the City of Boulder, USA ... 120
Box 5.2. Environmental indicators in tax shares to local governments in Brazil ... 127
Box 5.3. Metropolitan emission trading programmes ... 130
Box 6.1. The new green wave in economic policy ... 139
Box 6.2. Fiscal stimulus for investments in infrastructure, examples from OECD countries ... 141
EXECUTIVE SUMMARY
1. Cities and climate change: a two-way relationship
• Cities are major contributors to CO2 emissions. Roughly half of the world’s population lives in
urban areas, and this share is increasing over time, projected to reach 60% by 2030. Cities consume a great majority – between 60 to 80% – of energy production worldwide and account
for a roughly equal share of global CO2 emissions. In the OECD, countries that are more
urbanised tend to generate higher levels of CO2 emissions. Greenhouse gas (GHG) emissions in
OECD cities are increasingly driven less by industrial activities and more by the energy services required for lighting, heating and cooling, appliance use, electronics use, and mobility. Growing
urbanisation will lead to a significant increase in energy use and CO2 emissions, particularly in
non-OECD countries in Asia and Africa where urban energy use is likely to shift from CO2
-neutral energy sources (biomass and waste) to CO2-intensive energy sources.
• Climate change poses key threats to urban infrastructure and quality of life. The tendency for cities to be located in coastal areas increases their vulnerability to water-related calamities, increasing the risk to property, livelihoods and urban infrastructure. Rising sea levels are a critical issue for major cities – for example, in Europe, 70% of the largest cities have areas that are less than 10 meters above sea level. Port cities most at risk for coastal flooding are located
both in rapidly growing developing countries such as India and China (e.g. Kolkata, Shanghai,
Guangzhou) and in wealthy of countries such as the United States (e.g. Miami, New York City),
the Netherlands (e.g. Rotterdam, Amsterdam) and Japan (e.g. Tokyo, Osaka). Heat waves will be
felt more strongly in urban areas due to urban heat island effects. Due to the large amount of concrete and asphalt in cities, the difference in average annual temperature with rural areas ranges from 3.5 to 4.5°C, and is expected to increase by 1°C per decade (up to a difference of 10°C with large cities). Poor populations in both rich and poor nations are the most vulnerable to climate change, in part because they lack the resources to quickly and effectively protect themselves from extreme weather patterns. The poor are also more vulnerable as they may use cheaper materials to build dwellings, or may reside in floodplain areas where land is cheaper, as was demonstrated during Hurricane Katrina (2005) and Hurricane Mitch (1998).
2. Cities are not to be blamed – Urban form, lifestyles and energy sources are what count
are around five times denser than Canada’s, and the consumption of electricity per capita in the former is around 40% that of the latter. If we take countries in the same geographical context with similar heating needs, such as Denmark and Finland, the proportions are quite similar. Denmark’s urban areas are denser than Finland’s by a factor of four and people there only consume around 40% of the electricity than the Finns.
• Lifestyles, in particular the way in which people commute, are also crucial in the generation of CO2 emissions. Cities’ emissions can vary depending on their lifestyles, spatial form and public
transport availability. In other words, it is not cities, or urbanisation per se, that contribute to GHG emissions, but rather the way in which people move around the city, the sprawl that they produce, the way in which people use energy at home and how buildings are heated that make cities the great consumers of energy and polluters that they are. As urban areas become denser and rely more on public transport, carbon emissions are reduced. Not surprisingly, among OECD member countries, North American countries – characterised by high personal vehicle use –
produce 50% more CO2 emissions than European countries, which in turn pollute twice as much
as Asian countries. Similarly, not all cities in the same country are home to the same lifestyles, nor do they contribute to carbon emissions in the same way. Although the USA is the OECD country with the highest per capita carbon emissions, internally, Los Angeles, with very high
personal vehicle use, displays higher concentration of CO2 emissions than New York, even
though it has the largest population concentration in the country (60% higher than Los Angeles).
• Cities’ energy sources matter. The impact of energy consumption on GHG emissions depends not just on the amount consumed, but also on the GHG emissions generated by the energy source, which in turn depend on the mode of energy production. For example, Cape Town has comparatively low per capital electricity consumption than Geneva, but its consumption has a higher GHG emissions factor, due to South Africa’s use of coal for 92% of its electricity generation whilst Geneva relies on hydropower. Technology also matters: urban areas relying on inefficient or wasteful energy sources contribute more GHG emissions then than those that consume the same amount from more efficient sources.
3. Urban policies can contribute to a global climate agenda
adapt to climate change can only happen incrementally over the long term, which heightens the urgency of implementing land-use zoning, spatial, building and transportation policies now.
• Urban policy can contribute to national CO2 emissions reduction targets. Findings from a
general equilibrium model (CGE model) with an urban module demonstrate that urban policies such as increases in spatial density and congestion charges can lead to a reduction of total OECD
global energy demand and, consequently, of CO2 emissions. Interestingly, overall abatement
costs of meeting Kyoto emissions reduction objectives, generally observed at the macroeconomic
level, can be reduced over time by complementing a global climate policy (e.g., a carbon tax)
with urban densification policies and congestion charges.
• The lower tradeoffs between economic growth and environmental priorities at the urban level may be due to complementarities of policies observed only at the local scale. An example is local pollution, which increasingly impacts city attractiveness and competitiveness. Results from the CGE model shows for instance that if cities continue their current GHG emissions and lifestyles trends, by 2030 cities that could become more attractive will do so while also curbing local
pollution (e.g. Ankara, Auckland, Barcelona, Krakow, Lille, Melbourne, Montreal, Monterrey,
and Toronto). It also highlights that some metro-regions risk losing attractiveness if their current
pollution trends continue (e.g. Chicago, Los Angeles, New York, Osaka, Paris, Philadelphia,
Seoul and Tokyo).
• Some urban climate policies should be considered as no-regret policies as they can provide additional co-benefits. These include public health improvements, cost savings and increased efficiency, energy security and infrastructure improvements, and improved urban quality of life. These additional non-climate benefits may also help to explain the lower tradeoffs between economic growth and GHG emissions reduction on the metropolitan level. For example, GHG emissions reductions may benefit human health to such a degree as to offset in large part the local costs of emissions reductions. Policies to reduce GHG emissions through increasing energy efficiency can result in significant reductions in energy costs, and the energy savings achieved can compensate for the initial investment costs in as little as a few years.
4. Urban climate actions need a smart mix of policy instruments
• Cities serve as policy laboratories for action on climate change. Many cities and metropolitan regions around the world are taking action on climate change – even in the absence of national policies and commitments – not only out of recognition of cities’ contributions to and risks from climate change, but also of the opportunities to lower the potential tradeoffs between economic growth and environmental priorities. While large cities have provided landmark policies – notably Seoul, Stockholm, Toronto, Copenhagen, New York, London, and Tokyo – mid-size and smaller cities have also created innovative climate policies, such as Mannheim and Freiburg in Germany, Toyama, Japan, Nantes, France and Boulder, USA.
• Effective climate policy packages should seek policy complementarities among and within urban sectors to implement policies that enhance each other’s effectiveness. For example, land-use zoning policies that allow for higher densities and greater mixing of residential and commercial uses can enhance transportation climate goals by reducing trip distances and frequency while strategic mass transit linkages can attract development and thus promote compact growth. Long-term growth plans in a number of OECD metropolitan areas aim to
maximise these complementarities (e.g. Paris, New York, London). Natural resource policies to
increase vegetation and green space can reduce emissions and reduce the impacts of heat extremes and flooding – a prime example being São Paulo’s development of linear parks along urban waterways. Within the transportation sector, policies to increase the quality and availability of public transportation, bicycle, and foot travel make policies to discourage or restrict vehicle travel and circulation more politically feasible. For example, congestion fees for driving during peak hours worked well in London because they were combined with improvements in management of the road network and substantial enhancements in bus service. Energy efficiency standards for new buildings are well complemented by projects to retrofit existing buildings with energy efficiency technologies, with models including Berlin’s innovative model for contracting with private companies to meet efficiency targets and Toronto’s Mayor’s Tower Renewal programme. Waste policies to promote waste-to-energy incineration need to be combined with robust support for recycling programmes to enhance the economic viability of recycling
programmes to divert waste from landfills (e.g. Kitakyushu, Japan).
• Action on climate change should optimise existing urban modes of governance. Climate action on the urban level happens through local regulations, urban services, programme administration, city purchasing and property management, and convening of local stakeholders. Activities involving government-owned property or operations are common in part because cities have direct control over them – examples include many cities’ purchase of hybrid or alternative fuel
vehicles and improving the energy efficiency of street and traffic lights (e.g. Los Angeles and
Graz, Austria). Important opportunities exist where cities are service providers – such as Melbourne’s innovative two-tiered water services system providing both drinkable and recycled water, Monterrey and Toronto’s capture of methane gas from landfills for energy, and Copenhagen, Stockholm and Mannheim’s use of district heating. Cities generally are still reluctant to make full use of their regulatory authority to achieve climate goals. Notable exceptions include Barcelona’s Solar Thermal Ordinance and San Francisco’s recent introduction of mandatory recycling.
• Successful compact cities policies rely on well-designed strategic plans. Policies to increase the concentration of urban areas in the long term and manage outward expansion have gained popularity across the OECD, particularly in the Netherlands, United Kingdom and Japan, which has initiated an “Eco-Compact City” policy. While the higher residential densities targeted by these policies have the most direct effect on GHG emissions, transportation linkages – particularly between employment centres and residential zones – are crucial to ensuring that increases in density translate into reductions in personal vehicle use. Increasing the mix of land uses in urban neighbourhoods also reduces travel distances between home, work, and activities and promotes non-motorised travel. High quality urban services and amenities, including open space, are also crucial to the long-term attractiveness and effectiveness of compact cities policies.
intervention that can be used to incorporate climate change responses into long-term growth plans typically analyse urban GHG emissions drivers and urban vulnerabilities. Although many cities have begun to inventory their emissions sources, the need exists for a harmonisation of
tools. Vulnerability assessment models, developed by some cities (e.g. Washington, USA) are
essential but they remain costly and require scientific expertise that may not be relatively available to urban governments. An assessment of local capacity to respond to urban GHG emissions and climate change vulnerabilities is also critical to planning future responses. Wedge analysis and stakeholder mapping, implemented for instance by the Greater London Authority, are two types of tools to assess local capacity to act. Tools to assess costs and benefits and conduct cost-effectiveness planning also play a key role in strategic planning. Few cities worldwide have real knowledge of the impact of new development on their long-term fiscal condition. Decisions are dominated by immediate capital costs, despite the fact that often over 90% of lifecycle costs for typical infrastructure are expended during operational maintenance and rehabilitation. Introducing qualitative assessment in cost-benefit analyses can be challenging; one example is the performance-based planning approach in use in the San Francisco Bay Area, USA.
• National governments can play a role in supporting and removing barriers to greater urban governance and enhance cities’ capacity to act on climate change issues. Key roles include providing funding and technical assistance to cities and regions, such as in Finland and Sweden. Climate mandates in national urban and regional policies in Australia, Austria, Canada, the Czech Republic, France, Germany, Japan, Mexico and the United Kingdom, and in the Korean “Green New Deal”, can advance local climate action. Strong national targets for adaptation and GHG emissions reductions can help prevent regional competition based on environmental regulations and even promote a “race to the top” through incentives, such as Japan’s “Environment-Friendly Model City” award.
5. Finance is an issue – greening local revenues and financing local green activities
• Climate change will call for new urban infrastructure investments and thus will create new challenges for urban finance: it puts additional pressure on city budgets related to adaptation, mitigation and price rises in carbon-related energy sources. New transportation systems, service improvements, building retrofits and protections for the built environment are costly, especially when applied at a citywide scale. Cities are now responsible for a range of sectors that impact environmental sustainability and GHG emissions, sometimes as the sole authority, but more often in partnership with other levels of government. For example, local governments in OECD countries are responsible for 70% of total public investment and amounts of public spending on environmental protection (which includes waste management, waste water management, pollution abatement, protection of biodiversity and landscapes, and research and development (R&D) on environmental protection), which is almost similar to that of their respective national governments.
Several cities in the world depend on land sales for a large part of their revenues, which also can create incentives for urban sprawl: the contribution of land sales to local revenue in Guangzhou (China) has been estimated to be 55% in 2006.
• Cities and metropolitan areas could make more use of fees and charges as instruments to influence behaviour and thus mitigate climate change. As they confront users with the real costs of their choices, these instruments could reduce the inefficient use of resources and limit
sprawl. An example of a financial instrument to mitigate climate changeis the congestion charge,
applied in a growing number of cities, which has proved effective in reducing congestion and
reducing CO2 emissions from transport (reductions between 10% and 20% in London, Stockholm
and Milan). Development charges and value-capture taxes, such as used in Miami, Milan and Bogotá, could finance the construction of new infrastructure needed to serve new surburban developments, whereas transport-related revenue sources (fuel taxes, congestion charges, parking fees) could charge for the use of the infrastructure. Congestion charges will arguably be more appropriate for those cities whose parking fees are already high. Fiscal disincentives for car use will be more effective when alternative traffic solutions, such as public transport, are in place, which is why some metropolitan areas, such as London, use these types of revenues to finance public transit.
• Urban areas need new financial instruments. The budget pressures caused by climate change might require additional financial instruments for cities, which could be provided by carbon
finance mechanisms and increased access to capital markets. Some cities participate in the
cap-and-trade mechanisms established in different countries (e.g. the Chicago Climate Change
Exchange) or at the European level, and have in some cases (Los Angeles, Chicago, Santiago) set up their own urban cap-and-trade mechanisms or are planning to do so (metropolitan Tokyo in 2010). Certain cities, such as London, have explicitly defined emissions trading as a business opportunity that would increase their metropolitan competitiveness. There are several ways in which the use of carbon finance instruments by cities could be increased. If international climate negotiations were to mention transport and buildings as key areas to reduce GHG emissions, this would provide a rationale to involve urban areas. In order to keep transaction costs down and to take systemic dimensions of urban problems into account, these actions should take the form of broad programmes, such as a sectoral crediting mechanism beyond 2012, rather than specific projects. There is a need as well to make sure that future use of these instruments by cities will be integrated within urban planning and financial frameworks to prevent these instruments from financing isolated projects without connection to larger urban sustainability priorities.
contributions to GHG emissions reductions, such as through buildings and transport policies, and provide incentives for channelling funding sources to key urban-level projects.
• National governments could play a key role in greening urban finance, by re-designing sub-national taxes and grants to sub-sub-national governments, especially those that have an impact on the city’s built environment, transport and energy. Re-design of sub-national taxation could include property tax reform to correct for biases towards unsustainable behaviour. For instance, property tax reform favouring compact development could be promoted through a split-rate property tax (Sydney, Hong Kong, Pittsburgh), differential taxation, a special area tax applied on suburban properties, or a set of cascading taxes that gradually increase as one moves away from the city centre towards the periphery (Austin). A relatively simple form of such a tax might be a higher standard property rate for suburban inhabitants or preferential rates for multiple dwellings (Denmark, Sweden). In addition, intergovernmental grants, such as those applied in Germany, Portugal and Brazil, could take environmental indicators into account to compensate local governments for the external benefits of their environmental expenditures. A comprehensive greening of urban finance would also increase the coherence between urban finance and urban planning frameworks to enhance urban sustainability and contain outward urban growth. Carbon
taxes and climate change levies, although occasionally introduced at the local level (e.g. Boulder),
could be considered more suitable instruments for the national or supra-national level rather than the city or regional level, as they could distort competition between regions.
6. Cities have a key role in fostering a green growth agenda
• Cities and regions can promote green growth through many levers, including the creative use of procurement, better screening of investments in infrastructure, transport, communication networks and utilities, financial and tax incentives, partnerships and regulation of energy suppliers, consumer awareness and training programs for green jobs. They also have significant responsibilities in leading by example. An effective green growth strategy for cities should search for employment gains in the short-to-medium term through targeted investments, and should pursue systemic changes in the way cities function and grow through the continuous generation and application of new technologies that increase connectivity and reduce resource use. Public-private partnerships, leveraged for example through green infrastructure funds, have great potential for reducing the burden on local finances and increasing the efficiency of green investments.
• Cities can help create stronger markets for renewable energies and energy-efficient products and services. Feasible options for public investment that can reduce emissions and sustain employment include: improving the energy efficiency of buildings through retrofitting (Freiburg) and selective public purchasing (Berlin, Helsinki); integrating environmental targets in transportation and planning (Toronto, Chennai, India); and increasing the share of renewable
sources in energy supplies, through distributed technologies (e.g. Berkeley’s program for
individual photovoltaic installations) or centralized utilities (e.g. wind farms in Samsǿ,
Denmark). Green jobs can result from smarter management of energy at the urban level, through
regulatory innovations such as local feed-in tariffs for renewable energy (e.g. several German
cities) or strong market support for the deployment of ICT and other energy saving technologies
(e.g. the Gangnam-gu district of Seoul and the Paris suburb of Issy-les-Moulineaux). The
employment benefits of energy efficiency at the local level are largely the result of multiplier effects, as households and businesses shift expenditures from a capital-intensive sector (energy)
• Cities can also be effective in greening industrial production by developing one-stop support services for green industry start-ups (Los Angeles); enabling existing businesses to reach energy conservation goals (the Eco-Efficiency Partnership in British Columbia) or realise profits through energy recycling (Kitakyushu and other Japanese “Eco-Towns”); providing training tailored to local labour market needs (Oakland Apollo Alliance); and by developing awareness programs to raise consumers’ preferences for green products (Blacktown, Australia Solar City project).
• Cities and regions can take the lead on long-term, locally tailored eco-innovation and leverage private investments in energy-saving technological solutions. Green-tech innovation is often highly concentrated in a few dynamic clusters, usually located near cities (urban regions in the OECD produced 73% of green patents in the renewable energy sector over 2004-2006). Cities can play a facilitative role, through the development of networking platforms for enhanced knowledge-sharing in climate change mitigation and adaptation, and an enabling role, through well-designed support for R&D and for industrial and public research collabouration in eco-innovation clusters. Cities can also promote the development of green clusters by facilitating
synergies and by enabling private R&D through joint ventures (e.g. the Lahti Cleantech cluster in
Finland, with 20 new clean-tech companies and more than EUR 30 million in total investment). Finally, local and regional governments can support the activities that follow the research and development of new environmental technologies, for example by sponsoring environmental technology verification schemes or financing and disseminating results of demonstration tests
INTRODUCTION
Climate change has become one of the most pressing issues of our new century. World greenhouse
gas emissions (GHG) have roughly doubled since the early 1970s, reaching about 74 gigatons CO2
equivalent (Gt CO2equ) in 2005 (OECD, 2009a). The OECD projects that if we continue on the present trajectory, global greenhouse gas emissions will increase by more than 50% by mid-century, causing world temperatures to rise from 1.7 to 2.4 degrees Celsius (°C) above pre-industrial levels by 2050, and from 4 to 6 °C or more in the long-term (OECD, 2009a). Even worse, the planet’s natural system to absorb carbon will peak by mid-century and then likely weaken making climate change much more acute (IPCC, 2007a). While there is significantly uncertainty about the costs of inaction, it is generally agreed that failing to tackle climate change will have significant implications for the world economy. Stern (2007) asserts for instance that the total economic and welfare costs of policy inaction could equate to as much as a permanent 14.4% loss in average world consumption per capita, when both market and non-market impacts are included. Even more worrisome, increasing greenhouse gas emissions are likely to lead to massive upheavals: floods and droughts, more violent storms, more intense heat waves, and escalating conflicts over food and water and resources.
Dealing with climate change will require a broad set of instruments. If we want to meet the objective
of cutting emission by at least 30% by 2050, i.e. the level generally agreed on to prevent dangerous
anthropogenic interference, and minimise the costs involved, a number of policy instruments must be put in place or expanded so as to create the proper incentives to ensure that emissions are reduced first where it is cheapest to do so. The OECD stresses that market-based mechanisms such as cap and trade systems, carbon tax, or both, should be key elements of the policy mix to help build a global carbon market (OECD, 2009a). This will need to be complemented by removal of subsidies to fossil fuel energy and reallocation of the financial resources into increased investment in clean energy R&D. Moreover, as market imperfections (monitoring, enforcement, and asymmetric information problems) prevent some emitters
from responding to price signals, complementary instruments, including standards (e.g. building codes,
electrical appliance standards, diffusion of best practices) and information instruments (e.g. eco-labelling)
are necessary.
Cities have a key role to play in the global agenda for addressing the challenge of climate change. Today, approximately half of the world’s population lives in cities; by 2050, that proportion will probably have increased to two-thirds. Cities are responsible for the bulk of national output, innovation and employment, and they constitute the key gateways of transnational capital flows and global supply chains (OECD, 2006).As key engines of the global economy, cities are responsible for the bulk of national output, innovation and employment, and they constitute the key gateways of transnational capital flows and global supply chains (OECD, 2006). It is therefore not surprising that cities consume a great majority – between 60 to 80% – of energy production worldwide and account for a roughly equal share of global greenhouse emissions. All projections indicate that this trend will continue as urban populations grow. If urbanisation
is contributing to the increase in CO2 emissions, many cities are also likely to be affected by climate
warming, a growing number of cities and regions have taken initiatives to reduce their energy use and CO2 emissions. Faced with the two-way relationship between climate change and urban development, cities and regions in many OECD countries have key responsibilities in the urban sectors that can provide valuable strategies for fighting and adapting to climate change, including policies that affect transportation and the built environment.
Yet, in the debate on a global agenda to tackle climate change, the role of cities in addressing the issue has been quite decoupled from national and international policy frameworks (OECD, 2009b). Cities face the challenge of determining the range of local responses that will result in GHG emission reductions, protection against climate change impacts, and economic growth. The effectiveness of local-level policy implementation depends on the potential for policies to meet climate change mitigation and adaptation goals while pursuing economic growth and local fiscal sustainability. Based on statistical data from the OECD regional and metropolitan databases, empirical OECD studies and results from different questionnaires, this report discusses the relationships between cities and climate change, the rationale for taking action at the urban scale, the effectiveness of some local strategic and sectoral policy tools in addressing climate change issues as well as local finance and growth and job opportunities from the green economy.
Section 1 analyzes the relationship between cities and climate change. It shows that concentration of
population is clearly linked with concentration in output and energy use, one of the main drivers of CO2
emissions. However, it is not cities, or urbanisation per se, that contribute to GHG emissions, but rather the way in which people move around the city, the sprawl that they produce, the way in which people use energy at home and how buildings are heated that make cities the great consumers of energy and polluters that they are. Cities’ emissions can vary depending on their lifestyles, spatial form, public transport availability and sources of energy.
Because of the complex and fixed nature of urban infrastructure, cities – especially those located in coastal areas – will be also be impacted by the change in the global temperatures. This is a well known phenomenon, affecting cities in both developed and developing countries, but adaptation policies at the local level have received little attention. Climate impacts specific to urban areas are discussed in Section 2. Adapting to climate change impacts requires significant public investments to address expected increases in flooding, storms, heat extremes, drought and water scarcity. Inaction now can further increase the costs of climate change damage, as well as of future adaptation measures. Disruptions in infrastructure systems can clearly create inefficiencies and slow down economic progress, imposing costs on the local and national economy.
The benefit of implementing urban policies to tackle climate change is demonstrated in Section 3. The traditional trade-off between economic growth and environmental objectives observed at a macroeconomic level, referred to as abatement costs for climate change policies, can be alleviated when urban policies such as densification or congestion charges are introduced. This is the result of a general equilibrium model that incorporates an urban module. Under a baseline global scenario with Kyoto emissions reduction objectives, the overall economic costs can be reduced over time thanks to additional actions taken at the local level. This is due to complementarities with other objectives, such as lower local pollution and the enhancement of city attractiveness and competitiveness through lower local pollution. The section also discusses other types of local co-benefits of climate change policies, including health improvements and quality of life, cost savings and increased efficiency, energy security, and infrastructure improvements.
individual urban regions and be tailored to local energy consumption patterns, it is essential to identify the impact and benefits that policy sectors can have on each other to promote the cost-effectiveness of public actions. The question of effective urban policy packages intersects with the concept of urban density, a
major driver of CO2 emissions. This section also assesses different characteristics of densification policies
and their effectiveness in meeting environmental goals whilst remaining attractive in the long term.
Measures to reduce GHG emissions and adapt to expected climate change impacts will put additional pressure on city budgets and increase the need for additional resources. Section 5 discusses the different forms of upward pressures on city budgets that can be anticipated to respond to climate change issues. Although investment in climate change and urban sustainability policies can produce co-benefits, such as increased accessibility and greater city attractiveness, these investments will present an additional burden on most cities’ budgets. A number of existing fiscal instruments and incentives already at cities’ disposal could be considered as instruments for achieving climate change and urban sustainability goals. Carbon markets and access to financial capital may emerge as promising new funding sources.
REFERENCES
IPCC (Intergovernmental Panel on Climate Change) (2007a), Climate Change 2007: The Physical Science
Basis, Contribution of Working Group II to the Fourth Assessment Report of the Intergovernmental
Panel on Climate Change, S. Solomon,, D. Qin, M. Manning, Z. Chen, M. Marquis, K.B. Averyt, M. Tignor and H.L. Miller (eds.), Cambridge University Press, Cambridge.
OECD (2006), Competitive Cities in the Global Economy, OECD, Paris.
OECD (2009a) The Economics of Climate Change Mitigation: Policies and Options for Global Act ion
beyond 2012, OECD, Paris.
OECD (2009b), “Cities, Climate Change and Multilevel Governance”, Environment Working Papers, OECD, Paris.
1. URBANISATION, ECONOMIC GROWTH AND CLIMATE CHANGE
There is an increasing recognition of cities and urban regions’ role as key engines of economic growth, job creation and innovation – as well as their role as the major contributors to global warming. Higher concentrations of population are generally linked with higher energy use, which is one of the main drivers
of greenhouse gas (GHG) emissions, particularly carbon dioxide (CO2) emissions. This worldwide trend
will only be reinforced as growing urbanisation – particularly in non-OECD countries – results in increased overall energy demand, and therefore increased GHG emissions. However, cities present great opportunities for reducing countries’ contributions to climate change. In OECD countries, where urbanisation is already well advanced, the main drivers of GHG emissions are energy consumption patterns, including how people move around metropolitan regions and the amount of energy they consume for daily home and work activities. Urban density and spatial organization are key factors that influence energy consumption, especially in the transportation and building sectors. This section discusses the relationships between urbanisation, economic concentration, energy use and GHG emissions in OECD countries and provides the main rationale for taking action at the urban scale: urban structure and form do matter for climate change.
1.1. The worldwide urbanisation process
Urbanisation is a global phenomenon and is expected to continue for decades to come (OECD 2006;
UN 2008). According to the United Nations, roughly half of the world’s population lives in urban areas,1
and this share is increasing over time, projected to reach 60% by 2030 (Figure 1.1). However, although urbanisation growth within the OECD is still ongoing, most of the urban population growth up to 2030 will occur in developing countries (Figure 1.2). Developing countries are projected to have urban growth rates roughly double those of OECD countries in the 2005-2030 timeframe (UN, 2008). China, for instance, which is already the largest urban nation in the world, will see its current urban population rising from 600 to 900 million by 2030. As of 2015, the newly added urban population will be larger than the total population of many OECD countries such as Germany, Japan, Mexico, France (Kamal-Chaoui in OECD, 2008a). Though the pace of urban growth will be highest in smaller towns and cities in countries in Africa and Asia, the proportion of the world’s population living in so-called megacities, or urban centres with more than 10 million people, is also predicted to rise to 12% in 2025, from about 9% today, and the number of megacities will rise from 19 to 27 (United Nations, 2008).
World urbanisation trends are currently catching up with the transformations that already took place in OECD countries over the last century. Urbanisation is a process that the OECD has already experienced: by 1950, urban population was already greater than rural (Figure 1.1). That same milestone occurred in global urban population in 2006. In a way, the challenges that are brought about by an increasing urban population have already been faced by OECD countries for more than half a century. If global urbanisation in the first half of the 20th century took place predominantly in European cities, population size has made Asia the continent with the highest urban population in the world today (Figure 1.2). Africa is also experiencing important transformations, as it is home to some of the fastest-growing cities. The UN forecasts a decline in rural population after 2020, while in the OECD shrinking rural population has been a
trend throughout the second half of the 20th century. The UN expects urban population to steadily grow both worldwide and in the OECD, though at a slower pace in the OECD. By 2050, 70% of world population – and 86% for OECD countries—will live in urban areas.
Figure 1.1 Urban and Rural Population in the World and the OECD
Absolute population numbers
0.0 0.5 1.0 1.5 2.0 2.5 3.0 3.5
0.0 1.0 2.0 3.0 4.0 5.0 6.0 7.0
1950 1960 1970 1980 1990 2000 2010 2020 2030 2040 2050
Po
pul
a
ti
o
n
in
OE
C
D
co
unt
ri
e
s
(b
il
lions
)
Wo
rl
d
po
pula
tio
n
(b
illion
s)
World urban population
OECD urban population
OECD rural population World rural population
Figure 1.2 Trends in Urbanisation by Continent
Urban population and growth (1950-2050)
Africa
Asia
Europe Latin America
North America Oceania 0.0% 0.5% 1.0% 1.5% 2.0% 2.5% 3.0% 3.5% 4.0% 4.5%
0 50 100 150 200 250 300 350
Annua l av e rag e ur ba n popul a ti o n gr owt h rat e (1950 ‐ 2050)
Urban population in 1950 (millions)
Notes:
Urban areas are defined according to the UN Population Database which takes into account each country’s own definition of urban. Bubble size depicts population size in 2010.
Source: Own calculations based on UN Population Database (2009).
There is no agreed-upon definition of an urban area; therefore a number of methods exist to analyse trends in urban areas. In this report, three units of analysis referring to urban areas are used:
• Urban areas. These refer to urban areas as they are defined by the national authorities of each
country. In particular, this is used when referring to UN data. As this unit of analysis refers to single county or municipality-level areas they have the advantage that national statistical institutes frequently make data available at that level. However, often these urban areas are too small or too large to account for a city.
• Predominantly urban areas (PU). These are defined by the OECD Regional Typology and used
• Metropolitan areas (functional areas). These refer to commuting areas as defined by the OECD Metropolitan Database, which takes into account population density, net commuting rates and type of region. These are typically large cities comprised by a number of administrative and adjacent areas where economic relations are intense. Metropolitan areas are typically defined as concentrations of population and economic activity that constitute functional economic areas covering a large number of authorities (OECD, 2006).
In the OECD, urbanisation is on the increase in almost every country. Taking into account
predominantly urban areas (PU) in the OECD as defined by the OECD regional typology2, today more
than 53% of the total population is living in urban areas; this number rises to almost 83% if we include
intermediate regions (IR) 3, less densely populated areas characterised by systems of medium-sized cities.
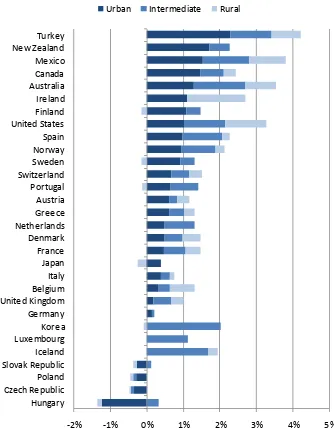
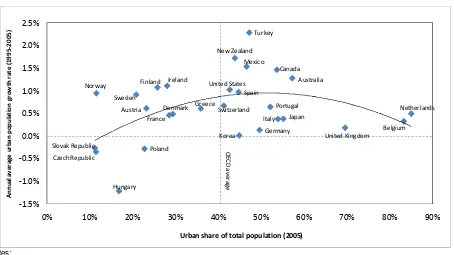
Over 1995-2005, population growth in OECD countries has been more dynamic in urban (PU) areas and intermediate (IR) areas than in rural areas. Only two countries (Belgium and Ireland) show stronger demographic expansion in rural areas (Figure 1.3). What is more, with a few exceptions in Eastern European countries, all OECD member countries have positive urbanisation growth rates between 1995 and 2005. If PU areas are taken into account, all countries with urbanisation shares higher to the OECD average are becoming increasingly urbanised (Figure 1.4, see quadrant 1 located above right). As a result, the OECD population is becoming increasingly concentrated in a few places (Figures 1.5, 1.6 and 1.7).
2. Throughout the document OECD definition of urban and rural refers to predominantly urban (PU) and
Figure 1.3 Population Growth in OECD Regions
Annual population growth rates by types of region (1995-2005) according to PU, IN, PR
‐2% ‐1% 0% 1% 2% 3% 4% 5%
Hungary
Czech Republic
Poland
Slovak Republic
Iceland Luxembourg Korea Germany
United Kingdom
Belgium Italy Japan France Denmark Netherlands Greece Austria Portugal Switzerland Sweden Norway Spain
United States
Finland Ireland Australia Canada Mexico
New Zealand
Turkey
Urban Intermediate Rural
Notes: In some cases like Korea, intermediate regions growth can be accounted by for growth in cities of a smaller size in wider areas that are considered to be intermediate. For instance Gyeonggi-do is an intermediate region that surrounds almost entirely the Seoul area; given that there has been considerable business growth outside the administrative area of Seoul after the deconcentration policy, it is possible that part of that growth has gone to Seoul’s suburbs located in Gyeonggi-do.
Figure 1.4 Urbanisation in OECD Countries
Urbanisation levels and growth according to PU areas (1995-2005)
Australia
Austria
Belgium Canada
Czech Republic
Denmark Finland France Germany Greece Hungary Ireland Italy Japan Korea Mexico Netherlands
New Zealand
Norway
Poland
Portugal
Slovak Republic
Spain Sweden
Switzerland Turkey
United Kingdom
United States
‐1.5% ‐1.0% ‐0.5% 0.0% 0.5% 1.0% 1.5% 2.0% 2.5%
0% 10% 20% 30% 40% 50% 60% 70% 80% 90%
A nnua l av e ra g e ur ba n po pul a ti o n gr o w th ra te (1 9 9 5 ‐ 20 05)
Urban share of total population (2005)
OE C D av e ra g e Notes:
Urban share of total population by country refers to population in urban regions as a proportion of total population.
Iceland and Luxemburg were not included in the sample as the OECD Regional Database identifies no predominantly urban (PU) regions in those countries.
Source: Own calculations based on data from the OECD Regional Database
Figure 1.5. Urban Concentration in Europe
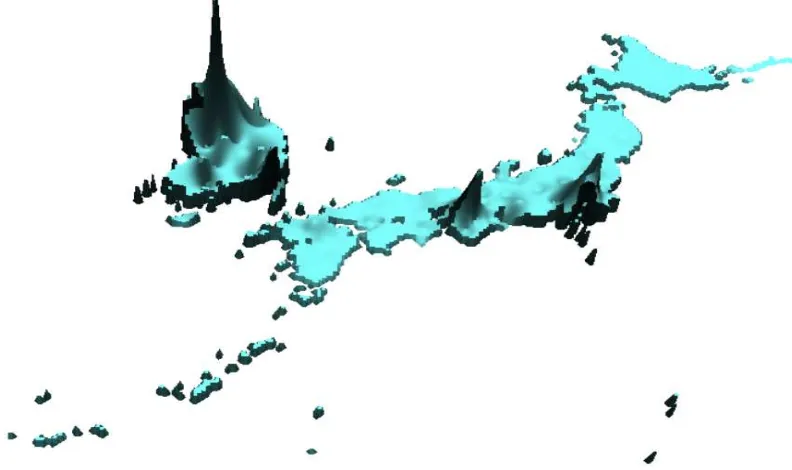
Figure 1.6 Urban Concentration in Asian OECD Countries
Population density at TL3 level (inhabitants per square km) in Japan and Korea in 2005
Note: OECD regions are classified at two levels: Territorial Level 2 (TL2) and Territorial Level 3 (TL3). Source: Own calculations based on data from the OECD Regional Database.
Figure 1.7 Urban Concentration in North America
Over 70% of people in the OECD who live in PU areas are in areas of more than 1.5 million people. In fact, urban populations locate increasingly according to city size. Thus, the share of total urban population living in smaller cities (between 100,000 and 500,000 people) is lower than the population living in any other type of cities and they also grow slower (0.4% annually on average). Medium-sized cities (between 500,000 and 1 million people) grow faster than smaller cities but more slowly than larger cities (Figure 1.8).
Figure 1.8 Urbanisation and City Size
Urban population and growth (1995-2005) according to population size of PUs
0.0% 0.2% 0.4% 0.6% 0.8% 1.0% ‐ 50 100 150 200 250 300 350 400 450
Small Medium Large over 1.5 million Ave ra g e a nnua l ur ba n popul a ti o n gr owt h rat e (1995 ‐ 2005) Ur b a n popul a ti o n in 2005 (m illio n )
Population in 2005 Population growth rate (1990‐2005)
Notes:
This analysis was carried out using only predominantly urban (PU) areas.
Small cities are PUs with population between 100 000 and 500 000 people. Medium-sized cities are PUs with population between 500 000 and 1 million people. Large cities are PUs with population between 1 and 1.5 million people.
Source: Own calculations based on OECD Regional Database.
Figure 1.9 Population Growth in OECD Metropolitan areas
Average annual growth rates 1995-2005
‐1.0% ‐0.5% 0.0% 0.5% 1.0% 1.5% 2.0% 2.5% 3.0% 3.5% 4.0% PittsburghBudapest
BirminghamCleveland ManchesterBerlin PragueBusan Rhine‐RuhrLille Naples WarsawDeagu OsakaTurin Leeds KrakowRome Detroit FrankfurtFukuoka PhiladelphiaStuttgart HanburgBrussels St.LouisAichi CopenhagenParis BostonMilan Tokyo MunichAthens BaltimoreLondon Lisbon Randstad‐HollandLyon San FranciscoNew York ViennaZurich Chicago Montreal BarcelonaHelsinki Stockholm OECDLos averageAngeles ValenciaOslo Sydney MexicoSan Diego City MinneapolisMelbourne SeattleSeoul MadridDublin WashingtonGuadalajara Miami TampaPortland Bay VancouverAnkara MonterreyIzmir AucklandToronto DenverPuebla HoustonDallas IstanbulAtlanta Phoenix
Note: The period of growth in the case of Auckland is 1996-2005.
1.2. Cities and economic concentration
Urban areas are home to concentrations not only of people, but also economic density and, often, productivity. This is often the reason for a pooled labour market that increases the possibility of skills-matching between workers and firms. Firms also agglomerate seeking to reduce risks of contract defaulting, as they have access to a wider set of skills and can establish linkages with suppliers and buyers. Cities are also often places where knowledge spillovers take place, benefiting not only the city but also the wider regional area. Thus, in approximately half of OECD countries, more than 40% of the national GDP is produced in less than 10% of all regions, which account for a small share of the country’s total surface and a high share of the country’s population (OECD, 2009c).
Urbanisation is part of the development process and is generally associated with higher income and productivity levels. In OECD countries, higher urban population shares are associated in most cases with higher per capita GDP than their national average (Figure 1.10). In part, such higher per capita GDP can be attributed to metropolitan areas. In many OECD countries, one single metropolitan area produces one-third
(e.g. Oslo, Auckland, Prague, Tokyo, Stockholm, London, Paris) to one-half of the national GDP
(Budapest, Seoul, Copenhagen, Dublin, Helsinki, Brussels) (Figure 1.11). Thanks to the benefits of agglomeration economies, most OECD metropolitan regions with more than 1.5 million inhabitants feature a higher GDP per capita, a higher labour productivity and higher employment levels than their national average. Disaggregating GDP into four main factors reveals that, for the most part, higher income in metropolitan areas can be attributed to higher labour productivity levels (Figure 1.11).
Figure 1.10. Urbanisation and Income
Urban share of total population (PU) and per capita GDP in OECD countries
Australia
Austria Belgium
Canada
Czech Republic
Denmark Finland France Germany Greece Hungary Ireland Italy Japan Korea Mexico Netherlands
New Zealand
Norway Poland
Portugal
Slovak Republic
Spain
Sweden Turkey
United Kingdom
United States
0% 10% 20% 30% 40% 50% 60% 70% 80% 90%
0 5,000 10,000 15,000 20,000 25,000 30,000 35,000 40,000 45,000 50,000
Urba n sh a re of to ta l po pu la ti on (2 00 5)
per capita GDP in current prices and PPP (2005)
OECD average
OE C D av e rag e Notes:
Urban share of total population by country refers to population in urban regions as a proportion of total population.
Iceland and Luxemburg were not included in the sample as the OECD Regional Database does not identify predominantly urban (PU) regions in those countries.
Switzerland was not included as GDP figures at sub-national level in that country are not available.
Mexico’s per capita GDP data refers to 2004; New Zealand’s per capita GDP data refers to 2003; Turkey’s per capita GDP refers to 2001.
Figure 1.11. Factors determining per capita GDP Differentials
Labour productivity, employment and participation rates, demographic factors among OECD metro-regions with respect to their national average (2005)
‐0.6 ‐0.4 ‐0.2 ‐1E‐15 0.2 0.4 0.6 0.8
Deagu Naples MontrealBerlin VancouverLille ManchesterLeeds
Tampa Bay
BirminghamFukuoka ValenciaSeoul TorontoKrakow PhoenixMiami St.Louis PittsburghOsaka Busan
Rhine‐Ruhr
MelbourneBaltimore Ankara Detroit Auckland CopenhagenPortland Randstad‐HollandSydney Izmir ZurichTurin ClevelandDublin LosHamburg Angeles Puebla Chicago SanAtlanta Diego BarcelonaOslo PhiladelphiaIstanbul Tokyo GuadalajaraAichi Helsinki Brussels FrankfurtLyon StuttgartVienna Dallas DenverMilan Madrid New York MinneapolisRome Munich HoustonSeattle StockholmLisbon MexicoBoston City Athens London San FranciscoPrague Paris WashingtonBudapest MonterreyWarsaw
Productivity Employment Participation Demographic
‐0.6 ‐0.4 ‐0.2 0 0.2 0.4 0.6 0.8
Deagu Naples MontrealBerlin VancouverLille ManchesterLeeds
Tampa Bay
BirminghamFukuoka ValenciaSeoul TorontoKrakow PhoenixMiami St.Louis PittsburghOsaka Busan Rhine‐Ruhr MelbourneBaltimore Ankara Detroit Auckland CopenhagenPortland Randstad‐HollandSydney Izmir ZurichTurin ClevelandDublin LosHamburg Angeles Puebla Chicago SanAtlanta Diego BarcelonaOslo PhiladelphiaIstanbul Tokyo GuadalajaraAichi Helsinki Brussels FrankfurtLyon StuttgartVienna Dallas DenverMilan Madrid New York MinneapolisRome Munich HoustonSeattle StockholmLisbon MexicoBoston City Athens London San FranciscoPrague Paris WashingtonBudapest MonterreyWarsaw
per capita GDP
Notes:
Per capita GDP can be disaggregated into four components: Productivity, Employment, Participation and Demographic.
The Demographic component represents the size of the pooled labour market of each metro region compared to the national average. Labour market pool is calculated as the proportion of the working-age population over the total population.
Australia, Germany and US data refers to 2004; New Zealand data refers to 2003; Switzerland data refers to 2002; Turkey and Mexico data refers to 2000.
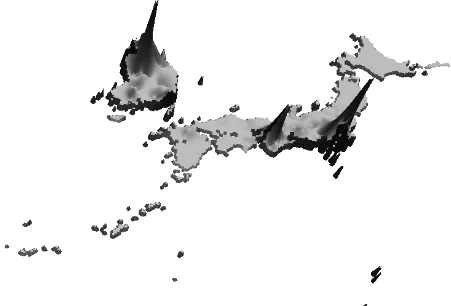
Trends in urbanisation and population concentration are closely linked with concentration of economic activities and production (OECD 2009d). Concentration of population in predominantly urban (PU) regions has also produced economic agglomeration. For instance, in Europe, economic activity concentrates around the same places than population –an area that seems to stretch from London to western Germany (Figure 1.12). In Japan and Korea, economic density is clear in Osaka, Seoul and Tokyo (Figure 1.13). Such agglomeration effects are fuelled by higher wages that can be paid due to higher productivity levels that in turn attract more workers so that centripetal forces are set in motion.
Figure 1.12. Economic Concentration in Europe
Economic density at TL3 level (GDP per square km) in 2005
Figure 1.13. Economic Concentration in Japan and Korea
Economic density at TL3 level (GDP per squared km.) in 2005
Note: OECD regions are classified at two levels: Territorial Level 2 (TL2) and Territorial Level 3 (TL3). Source: Own calculations based on data from the OECD Regional Database.
However, the benefits associated with economies of agglomeration are not unlimited. Cities can reach a point where they no longer provide external economies and become less competitive (OECD 2009d). One of the main explanations of such mixed outcomes is linked with the existence of negative externalities, including congestion and other environmental costs such as high carbon-intensities and/or high vulnerability to climate change (these can be thought of as centrifugal forces). Negative externalities associated with large concentrations in urban areas raise the question of whether the costs borne by society as a whole are becoming unsustainable. As externalities, these negative attributes are not internalised by firms and households, and may only show up as direct costs in the long term. They include, for instance,
high transportation costs (i.e. congested streets) and loss of productivity due long commuting times, higher
health costs, higher carbon emissions and environmental degradation. Taking into account the costs and the benefits of agglomeration, it has been argued that urban concentration may entail a “privatisation of benefits and socialisation of costs” (OECD, 2009c).
1.3. Economic growth, energy use and greenhouse gas emissions
currently emanates from cities (IEA, 2008a). This can be attributed, in part, to changes occurring in urban areas in emerging and developing countries, including increased economic activity. As countries urbanise,
they tend to shift from CO2-neutral energy sources (biomass and waste) to CO2-intensive energy sources,
leading to an increasing proportion of CO2 emissions from cities (Jollands in OECD, 2008a). Cities
(including towns) currently use over two-thirds of the world’s energy, an estimated 7 900 Mtoe in 2006, even though they only account for approximately 50% of the world’s population.
Projections indicate that cities are likely to increase their share in the total world energy consumption. By 2030, cities are expected to account for more than 60% of the world’s population and 73% of the world’s energy use, or more than 12 400 Mtoe in energy (IEA, 2008a). Of the global energy use projected by 2030, 81% is expected to come from non-OECD countries. U.S. cities will likely account for 87% of U.S. energy consumption in 2030, compared with 80% in 2006. Urban areas in the European Union will likely account for 75% of EU energy consumption, up from 69% in 2006. Cities in Australia could experience an increase from 78% to 80% of national energy consumption during the 2006 to 2030 period, and Chinese cities could account for 83% of national energy consumption compared with 80% today (IEA, 2007).
Cities contribute to climate change in three main ways: through direct emissions of GHGs that occur within city boundaries; through the GHG emissions that originate outside of city boundaries but are embodied in civil infrastructure and urban energy consumption; and through city-induced changes to the earth’s atmospheric chemistry and surface albedo.
• Direct GHG emissions include carbon dioxide (CO2), methane (CH4), and nitrous oxide (N2O)
emissions from energy conversion; CH4 emissions from the landfill decomposition of municipal
solid waste, CH4 and N2O from anaerobic decomposition and nitrification-denitrification of
nitrogen during wastewater treatment; CO2 emissions from waste incineration; flurocarbon (HFC,
PFC) and sulfur hexafluoride (SF6) emissions from refrigerants, semiconductor manufacturing
and insulators; and CO2 and N2O emissions from rural-urban land conversion.
• Embodied GHG emissions include GHG emissions embedded in the energy required to produce
the concrete, steel, glass, and other materials used in civil infrastructure; the CH4 and N2O
emissions used to provide the food consumed by urban residents; and the CO2, CH4 and N2O
emissions from rural power plants and refineries that generate energy for urban consumption.
• Changes to atmospheric chemistry and surface albedo include the direct and indirect GHGs that result from changes in atmospheric composition and surface reflectivity. For instance, the
IPCC estimates that tropospheric ozone (O3), a secondary pollutant commonly found in cities, is
the third most important GHG behin