i
in Indonesia Companies
A THESIS
A Thesis Submitted in Fulfilment of the Requirements For the Award of the
Undergraduate Degree Faculty of Economics and Business University of Diponegoro
Submitted by:
HARLINDA SISKA PRADINI C2C009088
FACULTY OF ECONOMICS AND BUSINESS
UNIVERSITY OF DIPONEGORO
SEMARANG
ii
THESIS APPROVAL
Author Name : Harlinda Siska Pradini
Student Number : C2C009088
Faculty/ Department : Economics and Business/Accounting
Thesis Title : The Analysis of Information Content towards Greenhouse Gas Emissions Disclosure in Indonesia Companies
Thesis Supervisor : Dr. Endang Kiswara, S.E, M.Si, Akt.
Semarang, 1 February 2013 Supervisor
iii
Student Number : C2C009088
Faculty/ Department : Economics and Business/Accounting
Thesis Title : The Analysis of Information Content towards Greenhouse Gas Emissions Disclosure in Indonesia Companies
Has been retained and declared in front of the Board of Reviewers on February 20, 2013 for fulfilling the requirement to be accepted.
Reviews Board :
1. Dr. Endang Kiswara S.E,M.Si,Akt ( )
2. Agung Juliarto, S.E,M.Si,Ph.D,Akt ( )
iv Certificate of Originality
I, Harlinda Siska Pradini, hereby certify that this assignment is true and accurate to be my own work specially written for the fulfilment of Under Graduate Program of Accounting and has not initially been presented in any other occasion. I bear full responsibility for my thesis.
v
guidance, I would not able to stand as my own circumstances as right now. I truly feel proud of them. I am precisely unable to count for their extraordinary things which they have been given to me. I am grateful to Allah and thankful to my parents.
For the most wonderful woman that I ever seen, the brightest star who always enlighten my life when it is dark and the source of love and passion in my glorious life. She never let me down with her prayers and support. She also gives me the strength to deal with such kind of obstacles in the rhythm of my life. (My beloved Mother)
For the most amazing hero in all measurements and they stand up for supporting me. He always taught me about the meaning of life very patiently. He is a man who plays the greatest part in my life.
(My beloved Farther)
For my best partners in family, they always stay with me for the most of the time. They are the real meaning of faithfulness. I am quite sure that life is nothing without them. They precisely encourage me to try to become the best sister.
(My beloved Brothers)
For my friends and classmates who are studying at Undergraduate degree in Accounting at University of Diponegoro. Thanks for togetherness, kindness and brotherhood.
I realize that this thesis is still far from perfect, therefore, critics, suggestion, advice in order to improve my thesis are always welcome. I hope that this research can bring benefit for everybody who reads and for me in particular.
vi
ACKNOWLEDGEMENT
In the name of Allah, the most Gracious, the most Merciful. All the Greatest Praises Be to Allah SWT, Lord of the World. Peace and salutation are precisely upon the beloved of Prophet Muhammad SAW, his family, his companions and his followers until the end of the Day.
I would like to thank and give big appreciation to my great supervisor, Ibu Dr. Endang Kiswara, SE., M. Si., Akt., for her constant encouragement, support, guidance, and valuable suggestions which made this thesis finish successfully.
I also want to thank to Dean of Faculty of Economics and Business, Bapak Prof. Drs. Muhammad Nasir, Ph.D., and all of teachers and staffs for their encouragement and support.
vii
companies’ profitability and type of industry to the extent of greenhouse gas emissions disclosure in Indonesia companies. To measure the extent of greenhouse gas emissions disclosure used index that was developed based on Standard Organization (ISO) 14064-1 about specification with guidance at the organization level for quantification and reporting of greenhouse gas emissions and removals.
The population of this study was all companies listed in Indonesia Stock Exchange (ISX) in 2010 and 2011. Sample consists of companies in agriculture, mining and manufacture sectors that disclosed their greenhouse gas emissions. The total sample were 30 companies, with period of observation is two years so the total of company’s report which be checked only 34 reports because there was 19 reports that were outliers. Data analysis was performed with the classical assumption and hypothesis testing used regression analysis. Statistic program in this study used SPSS 20, only normality test used E-views.
The results of this study indicated that the factor of report environment information in accordance with the Global Reporting Initiative version 3.1, the rank of PROPER and firm size significantly influence to the extent of greenhouse gas emissions disclosure. Meanwhile, ISO 14001 certified Environmental Management System, existence of environment function, companies’ leverage, companies’ profitability and type of industry had no significant effect to the extent of greenhouse gas emissions disclosure. Implication of this research showed that practice of greenhouse gas emissions disclosure was still minimize to fulfil ISO 14064-1 guideline.
viii ABSTRAK
Penelitian ini bertujuan untuk memperoleh bukti empiris tentang pengaruh sistem manajemen lingkungan bersertifikasi ISO 14001, keberadaan fungsi lingkungan, kesesuian laporan informasi lingkungan berdasarkan Global Reporting Initiative versi 3.1, peringkat PROPER, ukuran perusahaan, leverage perusahaan, profitabilitas perusahaan dan jenis industri terhadap luas pengungkapan emisi gas rumah kaca pada perusahaan di Indonesia. Pengukuran luas pengungkapan emisi gas rumah kaca menggunakan indeks yang dikembangkan dari ISO 14064-1 tentang Spesifikasi dengan Panduan pada Level Organisasi untuk Kuantifikasi dan Pelaporan dari Emisi dan Penghilangan Gas Rumah Kaca.
Populasi dari penelitian ini adalah semua perusahaan yang terdaftar di Bursa Efek Indonesia tahun 2010 dan 2011. Sampel penelitian terdiri dari perusahaan-perusahaan di sektor pertanian, pertambangan dan manufaktur yang mengungkapkan emisi gas rumah kaca. Total sampel penelitian adalah 30 perusahaan dengan periode pengamatan selama dua tahun sehingga total laporan perusahaan yang dianalisis hanya 34 laporan karena ada 19 laporan yang outlier. Analisis data dilakukan dengan uji asumsi klasik dan pengujian hipotesis dengan analisis regresi. Program statistik dalam penelitian menggunakan SPSS 20, kecuali untuk uji normalitas menggunakan E-views.
Hasil dari penelitian ini menunjukkan bahwa kesesuaian laporan informasi lingkungan dengan GRI versi 3.1, peringkat PROPER dan ukuran perusahaan berpengaruh signifikan terhadap luas pengungkapan emisi gas rumah kaca. Sementara itu, sistem manajemen lingkungan bersertifikasi ISO 14001, keberadaan fungsi lingkungan, leverage perusahaan, profitabilitas perusahaan dan jenis industri tidak berpengaruh signifikan terhadap luas pengungkapan emisi gas rumah kaca. Implikasi dari penelitian ini menunjukkan bahwa praktik pengungkapan emisi gas rumah kaca masih minim untuk memenuhi pedoman ISO 14064-1.
ix
TITLE PAGE ... i
THESIS APPROVAL ... ii
SUBMISSION ... iii
CERTIFICATE OF ORIGINALITY ... iv
DEDICATION ... v
ACKNOWLEDGEMENT ... vi
ABSTRACT ... vii
ABSTRAK ... viii
TABLE OF CONTENTS ... ix
LIST OF TABLES ... xv
LIST OF FIGURES ... xvii
LIST OF APPENDIX ... xviii
CHAPTER I INTRODUCTION 1.1 Bakground ... 1
1.2 Problem Formulation ... 4
1.3 Objectives of the Study ... 5
1.4 Contribution of the Study ... 6
1.5 Structure of the Study... 7
CHAPTER II LITERATURE REVIEW 2.1 Underlying Theories and The Prior Researches... 9
x
2.1.2 Institutional Governance System Theory ... 10
2.1.3 Legitimacy Theory ... 14
2.1.4 International Standards Organization (ISO) 14064 15 2.1.5 International Standards Organization (ISO) 14001 16 2.1.6 Management System ... 18
2.1.7 Global Reporting Initiative (GRI) Version 3.1 ... 18
2.1.8 PROPER ... 19
2.1.9 Firm Size ... 20
2.1.10 Leverage ... 21
2.1.11 Profitability ... 22
2.2 Prior Researches ... 22
2.3 Theoritical Framework ... 26
2.4 Hypothesis Development ... 27
2.4.1 ISO 14001 Certified Environmental Management System (EMS) ... 27
2.4.2 The Existance of Environment Function ... 29
2.4.3 The Report of Environment Information in accordance with Global Reporting Initiative Version 3.1 ... 30
2.4.4 Rank of PROPER ... 31
2.4.5 Firm Size ... 33
2.4.6 Companies’ Leverage ... 33
2.4.7 Companies’ Profitability ... 34
xi
3.1.2 Independent Variable ... 40
3.1.2.1 ISO 14001 Certified Environmental Management System (EMS) ... 40
3.1.2.2 The Existance of Environment Function (ENV_FU) ... 41
3.1.2.3 The Report of Environment Information in accordance with Global Reporting Initiative Version 3.1 (GRI)... 41
3.1.2.4 Rank of PROPER (PROPER) ... 45
3.1.2.5 Firm Size (SIZE) ... 46
3.1.2.6 Companies’ Leverage (LEV) ... 46
3.1.2.7 Companies’ Profitability (ROI) ... 47
3.1.3 Control Variable ... 47
3.2 Population and Sample Determination ... 47
3.2.1 Population ... 47
3.2.2 Sample ... 48
3.3 Types and Sources of the Data ... 48
3.4 Data Collection Method ... 49
3.5 Analysis Method ... 49
xii
3.5.2. Multiple Regression Analysis ... 50
3.5.3. Classical Assumption Test ... 51
3.5.3.1. Normality ... 51
3.5.3.2. Multicollinearity ... 53
3.5.3.3. Autocorrelation ... 53
3.5.3.4. Heteroscedasticity ... 55
3.5.4. Test of Fit Model (Adjusted R Square) ... 55
3.5.5. Test of ANOVA (F-Test) ... 56
3.5.6. Partial Test (T-Test) ... 56
CHAPTER IV RESULT AND ANALYSIS 4.1. Description of Object ... 57
4.2. Data Analysis ... 58
4.2.1. Descriptive Statistic ... 58
4.2.2. Quality Test of the Regression Model ... 62
4.2.2.1 Classical Assumption Test ... 63
4.2.2.1.1 Normality ... 63
4.2.2.1.2 Multicollinearity ... 64
4.2.2.1.3 Autocorrelation ... 65
4.2.2.1.4 Heteroscedasticity ... 66
4.2.3. Result of Hypothesis Test ... 67
4.2.3.1 Result of Regression Test ... 67
4.2.3.2 Test of Fit Model (Adjusted R Square) ... 69
xiii
4.2.3.5.2 The Second Hypothesis Testing .... 72
4.2.3.5.3 The Third Hypothesis Testing ... 73
4.2.3.5.4 The Fourth Hypothesis Testing ... 74
4.2.3.5.5 The Fifth Hypothesis Testing ... 74
4.2.3.5.6 The Sixth Hypothesis Testing ... 75
4.2.3.5.7 The Sevent Hypothesis Testing .... 76
4.2.3.5.8 Test of Control Variable ... 76
4.3. Discussion ... 77
4.3.1 Discussion for Hypothesis 1... 77
4.3.2 Discussion for Hypothesis 2 ... 78
4.3.3 Discussion for Hypothesis 3 ... 79
4.3.4 Discussion for Hypothesis 4 ... 81
4.3.5 Discussion for Hypothesis 5 ... 82
4.3.6 Discussion for Hypothesis 6 ... 83
4.3.7 Discussion for Hypothesis 7 ... ... 84
4.3.8 Discussion for Control Variable Test ... ... 85
CHAPTER V CONCLUSION 5.1 Conclusion ... 87
5.2 Research Implication ... 88
xiv
xv
Table 2.2 List of Prior Researches ... 23
Table 3.1 Variables, Dimensions, Indicators and Measurement Scale ... 37
Table 3.2 Greenhouse Gases Disclosure Index Based on ISO 14064-1 Requirements ... 38
Table 3.3 Environmental Management System ... 40
Table 3.4 The Existance of Environment Function ... 41
Table 3.5 Environment Performance Index Based on GRI Version 3.1 ... 42
Table 3.6 Rank of Colour in PROPER ... 46
Table 4.1 Population and Sample of Research ... 58
Table 4.2 Descriptive Statistic... 58
Table 4.3 Result of Jarque-Berra Test ... 63
Table 4.4 Result of Multicollinearity ... 64
Table 4.5 Result of Durbin Watson Test ... 65
Table 4.6 Result of Run Test ... 66
Table 4.7 Heteroscedasticity- Park Test ... 67
Table 4.8 Regression Test Result ... 68
Table 4.9 Test of Fit Model ... 70
Table 4.10 Test of ANOVA (F-Test) ... 71
Table 4.11 Result of Hypothesis 1 Testing ... 72
xvi
Table 4.13 Result of Hypothesis 3 Testing ... 73
Table 4.14 Result of Hypothesis 4 Testing ... 74
Table 4.15 Result of Hypothesis 5 Testing ... 74
Table 4.16 Result of Hypothesis 6 Testing ... 75
Table 4.17 Result of Hypothesis 7 Testing ... 76
xvii
xviii
LIST OF APPENDIX
CHAPTER I INTRODUCTION
1.1 Background
Indonesia is one of the countries that deal with high risk in the global warming. Intergovernmental Panel on Climate Change (IPCC) predicted that it will happen in Indonesia in 2030 as an impact of the global warming which sea level will rise about 8-29 cm, loss about 2000 islands, the difference level of the ebb and flow of water on the watershed becomes more extremely, and lack of clean water in coastal area. The further impacts are extreme flood and dry season.
Global warming is caused by the increasing of greenhouse gas emissions in atmospheres which is exceeded from normal standard. Greenhouse gas emissions consist of Carbon Dioxide (CO2), Methane (CH4), Nitrous Oxide (N2O), Hydro Fluorocarbons (HFCs), Per Fluorocarbons (PFCs), and Sulphur Hexafluoride (SF6) (Presidential Decree or Peraturan Presiden 71/2011). To overcome the global warming, Indonesia needs national strategy and national policy for reducing greenhouse gas emissions.
Indonesia has ratified Kyoto Protocol on the 3rd of December in 2004 through Undang-Undang 17/2004 by ratifying Kyoto Protocol in the United Nations Framework Convention on Climate Change (KLH, 2009). Moreover, Indonesia would commit for reducing its greenhouse gas emissions in 2020, about 26% when it used for national resource or about 41% when it gets international support (Bappenas, 2010). The policy that was made by Indonesia to support the
2
target of emissions reduction was Peraturan Presiden 61/2011, it was about national action plan to reduce greenhouse gas emissions and Peraturan Presiden 71/2011 about the national inventories of greenhouse gas emissions.
National action plan to reduce greenhouse gas emissions explains that industry is one of the greenhouse gas emitters. Greenhouse gas emissions are produced by industry which is coming from energy and land uses, production process, and industrial waste. Therefore, industries are expected to reduce their greenhouse gas emissions as Corporate Social Responsibility (CSR) realization.
Based on Peraturan Presiden number 61/2011, 71/2011, 47/2012 and Undang-Undang 40/2007 explained that industrial sectors can reduce the greenhouse gas emissions and they also have the obligation to carry out Corporate Social Responsibility (CSR), that are mining, agriculture and manufacture. Therefore in this study, researcher will focus on the analysing factors that affect the extent of greenhouse gas emissions disclosure in mining, agriculture and manufacture sectors. The data was collected from 2010-2011 based on national action plan to reduce greenhouse gas emission recently passed in 2011, and consequently, observing the latest trend of greenhouse gas emissions disclosure was only used companies’ data in 2010 and 2011. This period selection was also supported by other reason that ISO 14064 was recently adopted by Badan Standarisasi Nasional (BSN) in early December 2009.
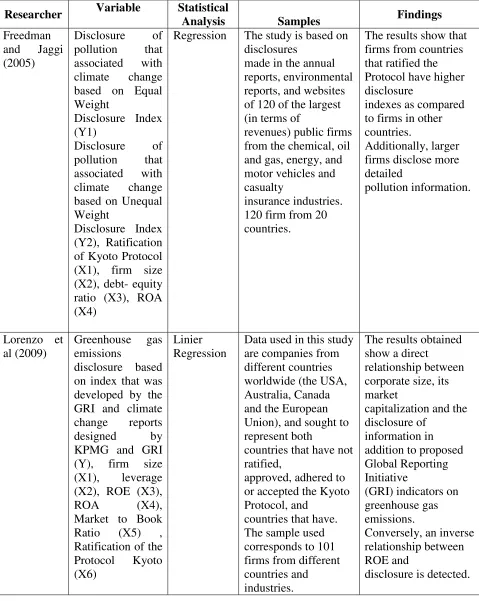
maintain legitimacy, to protect their reputation, to get the good image and to participate in sustainability programs voluntarily. Chu et al (2013), Rankin et al (2011), Lorenzo et al (2009), and Freedman and Jaggi (2005) tried to analyse the factors that influence to the extent and the credibility of voluntary greenhouse gas emissions disclosure. These researches used different indicators to measure the extent and the credibility of voluntary greenhouse gas emissions disclosure. Chu et al (2013) used The Greenhouse Gas Reporting Index based on questionnaire from the Carbon Disclosure Project (CDP), Rankin et al (2011) used International Standard Organization (ISO) 14064-1, while Lorenzo et al (2009) used indicators proposed by the Global Reporting Initiative (GRI) referring to emissions (EN16, EN17, EN18, EN19, EN20) and the climate change reports are designed by KPMG and GRI (2007), and Freedman and Jaggi (2005) used Equal Weight Disclosure Index and Unequal Weight Disclosure Index.
In Indonesia, the researches that specifically examined the disclosure of greenhouse gas emissions are still limited. All this time, researches on the extent of environment disclosure are focused on Corporate Social Responsibility (CSR) disclosure which is measured by Global Reporting Initiative index (Erdanu, 2010 and Waryanto, 2010).
4
This study referred to the research of Rankin et al (2011). Based on this research, the information content in greenhouse gas emissions disclosure was measured by ISO 14064-1.In addition, the theory in this study was also consistent with theory in research of Rankin et al (2011) that is Institutional Governance Systems Theory. Meanwhile, the additional independent variables are described by legitimacy theory. Therefore, researchers took the title:
“The Analysis of Information Content towards Greenhouse Gas Emissions Disclosure in Indonesia Companies”
1.2 Problem Formulation
Based on the background, it can be concluded that companies in agriculture, mining and industrial (manufacturing) sectors have the obligation to carry out Corporate Social Responsibility (CSR), and they also have the important role to reduce greenhouse gas emissions. One of the transparency and accountability form for these responsibilities is disclosure of greenhouse gas emissions. However, not all companies perform their greenhouse gas emissions disclosure because of voluntary (voluntary disclosure classification).
research analysis factors that affect the extent of greenhouse gas emissions disclosure based on ISO 14064-1. According to the above problems, this research intends to find the answers in the following research questions:
1. Does ISO 14001 certified Environmental Management System (EMS) affects the extent of greenhouse gas emissions disclosure based on ISO 14064-1?
2. Does the existence of environment function affects the extent of greenhouse gas emissions disclosure based on ISO 14064-1?
3. Does the report of environment information in accordance with Global Reporting Initiative version 3.1 affects the extent of greenhouse gas emissions disclosure based on ISO 14064-1?
4. Does the rank of PROPER affects the extent of greenhouse gas emissions disclosure based on ISO 14064-1?
5. Does the firm size affects the extent of greenhouse gas emissions disclosure based on ISO 14064-1?
6. Does companies’ leverage affects the extent of greenhouse gas emissions disclosure based on ISO 14064-1?
7. Does companies’ profitability affects the extent of greenhouse gas emissions disclosure based on ISO 14064-1?
8. Do all of independent variables simultaneously affect the extent of greenhouse gas emissions disclosure based on ISO 14064-1?
1.3 Objectives of the Study
6
1. To analyse the effect of ISO 14001 certified Environmental Management System (EMS) to the extent of greenhouse gas emissions disclosure based on ISO 14064-1.
2. To analyse the effect of existence of environment function to extent of greenhouse gas emissions disclosure based on ISO 14064-1.
3. To analyse the effect of report of environment information in accordance with Global Reporting Initiative version 3.1 to extent of greenhouse gas emissions disclosure based on ISO 14064-1.
4. To analyse the effect of rank of PROPER to extent of greenhouse gas emissions disclosure based on ISO 14064-1.
5. To analyse the effect of firm size to the extent of greenhouse gas emissions disclosure based on ISO 14064-1.
6. To analyse the effect of companies’ leverage to the extent of greenhouse gas emissions disclosure based on ISO 14064-1.
7. To analyse the effect of companies’ profitability to the extent of greenhouse gas emissions disclosure based on ISO 14064-1.
8. To analyse the simultaneously effect of independent variables to the extent of greenhouse gas emissions disclosure based on ISO 14064-1.
1.4 Contributions of the Study
1. For researchers, the result of this study is expected to give contribution on environment accounting development, particularly on the disclosure of greenhouse gas emissions.
2. For management of the companies, the result of this study is expected to give motivation and ideas about the importance of greenhouse gas emissions disclosure and the important of company’s policy preparation for reducing greenhouse gas emissions proactively.
3. For government, the result of this study is expected to be the basis for determining the reduction policy of greenhouse gas emissions that should be obeyed by the company to succeed the target of emissions reduction. 4. For society, the result of this study is provides motivation aspect in order
to control the corporate environment behaviour especially to reduce their greenhouse gas emissions progressively.
1.5 Structure of The Study
In order to provide a clear view of the study which is conducted, there are systematic information composing that contain about the material and the things which discussed in each chapter. The study is divided into 5 sections, arranged as follows:
CHAPTER I : INTRODUCTION
8
CHAPTER II : LITERATURE REVIEW
This chapter consists of theories that formed from the basic of this study such as institutional governance system theory, legitimacy theory, and other concepts that relevance with this research. In addition to explain the theory and the relevant concepts, this chapter also explains the previous researches and the hypothesis development.
CHAPTER III : RESEARCH METHODS
This chapter describes about research design, type and source of data, data collect method, research object and data analysis. This research is quantitative approach with regression analysis using SPSS 20.
CHAPTER IV : RESULT AND ANALYSIS
This chapter explains about the research object, data analysis that consists of descriptive statistic, the goodness fit of the model, hypothesis test result and interpretation of results.
CHAPTER V : CONCLUSION
CHAPTER TWO LITERATURE REVIEW
2.1 Underlying Theories and The Prior Researches 2.1.1 Greenhouse Gas Emissions
Peraturan Presiden (precidential decree) number 71/2011 explained that the definition of Greenhouse Gas (GHG) is gases which contains the atmosphere, whether natural or anthropogenic, absorbing and retransmit the infrared radiation. Whereas, the definition of greenhouse gas emissions is release from greenhouse gases into the atmosphere in certain areas within particular period. Greenhouse gas emissions consists of Carbon Dioxide (CO2), Methane (CH4), Nitrous Oxide (N2O), Hydro Fluorocarbons (HFCs), Per Fluorocarbons (PFCs), and Sulphur Hexafluoride (SF6).
A lot of chemical compounds are found in the earth’s atmosphere, which is known as greenhouse gas emissions that allow sunlight fill into the atmosphere freely. When sunlight has struck the earth’s surface, some of it was reflected back in space as infrared radiation (heat). Furthermore, greenhouse gases will absorb this infrared radiation and trapped in the heat of atmosphere. Greenhouse gases in the atmosphere has ability to absorb solar radiation that reflected by the earth, so it causes the earth get warmer. This event is called a greenhouse effect because it the same as the phenomenon which occurs in a greenhouse. Greenhouse phenomenon occurs when the heat came and trapped inside and unable to
10
penetrate in outside, so it can warm up the whole of greenhouses (National Energy Information Centre, 2004).
The increasing of greenhouse gas emissions in atmosphere above of normal standard causes the global warming and other changing in the climate system. Intergovernmental Panel on Climate Change (IPCC) found that over the last 100 years (1906-2005), the average of earth’s temperature was rose about 0.74˚ C. Moreover warming on land was greater than the sea. The average of warming’s rate over the last 50 years was higher than that was occurred in the last 100 years.
2.1.2 Institutional Governance System Theory
Institutional Governance System Theory is configuration between private, the state, and institutional arrangement to create the mechanism and impact on social economic condition in a country’s production system. Strategic management and political economy are the perspective of institutional governance system theory (Griffiths and Zammuto, 2005).
role of government has support and encourage the national competitive advantage (Griffiths and Zammuto, 2005).
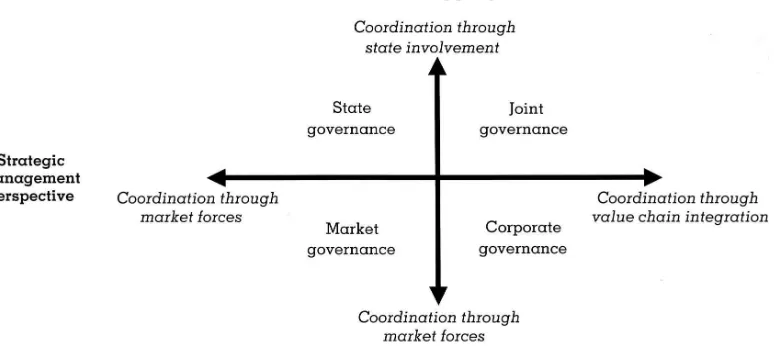
Strategic management literature shows that broad of industry structure, market force and the integration of value chain contribute to the industry and company competitiveness. On the other hand, political economy literature shows that state involvement in industry through the coordination of economic activity is key variable for achieving economic competitiveness. Value chain integration and state involvement are used as framework to explain the distinction of national industrial competitiveness on institutional governance system theory. Figure 2.1 explains the difference in characteristics of institutional governance system (Griffiths and Zammuto, 2005).
Figure 2.1
Four Institutional Governance System
12
Figure 2.1 explains the difference between state governance, joint governance, market governance and corporate governance. The detail explanation of the Figure 2.1 can be seen in Table 2.1
Table 2.1
Comparison of the Four Institutional Governance Systems Institutional
Value chain Fragmented Integrated Fragmented Integrated
State
Low/low Low/Moderate High/high Moderate/high
Institutional
Source: Griffiths and Zammuto (2005)
Based on the comparison of four institutional governance systems, this study used market governance to explain the practice of greenhouse gas emissions disclosure in Indonesia. The characteristics of market governance in accordance with the efforts to reduce greenhouse gas emissions in Indonesia companies. Market governance on approaches to climate change issues has the following characteristic (Griffiths et al, 2007):
14
sustainability initiatives as a cost. Climate change issues and reduction of greenhouse gases is ignored.
2. If corporations pursue individual corporate climate change activities, these are a consequence of managerial choice. In other words, the main part capabilities around climate change and greenhouse gas mitigation are left to the development prerogative of individual managers and corporations.
3. Corporations and industries may engage with climate change activities as a consequence of volunteering to take part in industry or government sponsored sustainability programs.
4. The main focus of corporate and industry may attempt to influence political debate and it focus on costs of adjustment- such as the loss of economic growth and employment as a consequence of addressing greenhouse mitigation issues.
2.1.3 Legitimacy Theory
Legitimacy theory is the most widely used to explain environmental disclosure. Assumption of legitimacy theory is social contract (expressed or implied) between an organisation and society, which is arises from idea about reciprocal responsibilities. Organizations agree to operate within certain bounds imposed by society in order to enjoy continued access to product and resource markets (Campbell et al, 2002).
company must expand its disclosure and reporting. Function of disclosure and reporting are legitimacy devices that realign the stakeholder perceptions and expectations about actual changes in corporate behaviour, highlighting accomplishments in critical areas, justifying intentions, acts and omissions. Since stakeholders start favour to the company, consequently the disclosure and reporting will contribute to make stakeholders aware about fairness of company’s procedures (Vurro and Perrini, 2011).
Lindblom (1994) identified four organizational strategies to close the legitimacy gap consists of changing the organization or changing the public, manipulation and misrepresentation of the organization. Changing the organization refers to providing an impression to the public that organization has changed its behaviour, while change the public symbolize changing the perception of the public without followed by changing of organization’s behaviour. Manipulation refers to diverting the attention of the public. Finally, misrepresentation refers to misinterpretation of fact for getting legitimacy.
2.1.4 International Standards Organization (ISO) 14064
16
Specification with guidance for the validation and verification of greenhouse gas assertions). The standards of ISO 14064 had been adopted by Badan Standarisasi Nasional in early December 2009 (BSN, 2009). ISO 14064 (ISO, 2006) has the below objectives:
1. Enhancement of environmental integrity by promoting consistency, transparency and credibility in greenhouse gases quantification, monitoring, reporting and verification;
2. Enabling organizations and manager to identify greenhouse gases related to liabilities, assets and risks;
3. Facilitating the trade of greenhouse gas allowances or credits; and
4. Supporting design, development and the implementation of comparable and consistent greenhouse gases schemes or programs.
2.1.5 International Standards Organization (ISO) 14001
lowering distribution costs and improving corporate image among regulators, customers, and the public.
ISO 14001: 2004 specifies for requirements an environmental management system that enabling an organization to develop and to implement a policy and objectives which take into account the legal requirements and others in which the organization subscribes and the significant information of environmental aspects. These are applying for the environmental aspects that the organization identifying is those which can control and those which can influence. It does not state to the specific environmental performance criteria itself. The International Standard is applicable to any organizations that wish to:
1. Establish, implement, maintain and improve an environmental management system,
2. Assure the conformation with stated environmental policy itself, 3. Demonstrate the confirmation with this international standard by:
a.Making a self- determination and self- declaration, or
b.Seeking confirmation of its conformance by parties who have an interest in the organization, such as customers, or
c.Seeking confirmation of its self-declaration by an external party to the organization, or
18
2.1.6 Management System
There are two different on legal systems in the board of company, namely Anglo-Saxon and Continental European (FCGI, 2002). Anglo– Saxon model has one-tier system. In one-tier system, the companies have one board of directors, which are generally the combination of senior managers or executives (executive directors) and independent director who works on the principle of part time (non-executive directors). Countries that implement this system are United States and United Kingdom.
Continental European has two-tier systems. In two-tear systems, companies have two separate bodies, namely the board of supervisors (board of commissioners) and board of management (board of directors). The board of directors assign to manage and represent the company under the direction and supervision of board of commissioners. The other task board of directors provide information to board of commissioners and answer the matters that are submitted by board of commissioners. Meanwhile, the board of commissioners have duty to appoint and to dismiss the board of directors and responsible to supervise management’s tasks. Countries that implement this system are Denmark, Germany, Japan, Dutch and Indonesia.
2.1.7 Global Reporting Initiative (GRI) Version 3.1
uptake of GRI’s guidance was boosted in 2006 when launched the current generation of Guidelines, G3. Over 3,000 experts from across businesses, civil society and labour unions were participated in G3’s development.
In March 2011, GRI published the G3.1 Guidelines, an update and the complete result of G3 that expanded guidance on reporting gender, community and human rights, related to the performance. The G3.1 Guidelines were made up by two parts. Part 1 featured guidance on how to report. Part 2 featured guidance on what should be reported in the form of disclosures on management approach and performance indicators.
2.1.8 PROPER
PROPER is monitoring activities and incentive or disincentive programs to the person responsibility for business or activity. PROPER encourages the company’s adherence to the environmental regulations and achieve the environmental excellence through the integration of sustainable development principles in the process of production and service (KLH, 2011). The performance assessment of PROPER can be found on Peraturan Menteri Negara Lingkungan Hidup 5/2011. Generally, the performance of PROPER is in the follows:
20
2. Green is given to the personal responsibility for business or activities that has environmental management more than that is required in regulation (beyond compliance) through the implementation of environmental management system, using the resources efficiently with 4 R (Reduce, Reuse, Recycle and Recovery), and it also performs better social responsibility (CSR or Community Development).
3. Blue is given to the personal responsibility for business or activities that have environmental management efforts in accordance with the rules or regulations.
4. Red is given to the personal responsibility for business or activities that have environmental management efforts which are not accordance with the rules or regulations.
5. Black is given to the personal responsibility for business or activities that have deliberate action or negligence so it causes the pollution, environmental damage and the violation of the laws or the violation of administrative sanctions.
2.1.9 Firm Size
Environmental accounting literature argues that firm size plays an important role in a firm’s abatement performance and pollution-emissions disclosures (Freedman and Jaggi, 2005). This argument based on premise that large companies can be more easily afford the expenditure needed to abate pollution. Moreover Branco and Rodrigues (2008) argued that large companies get more public attention than small companies because they are more openly get monitoring from stakeholder and more vulnerable to adverse reactions. Freedman and Jaggi (2005) argued that the fear for incurring a high political cost provided the motivation of large companies to make detailed disclosures, so that their pollution performance would not be underestimated or ignored by policy makers and regulators.
Measuring the firm size is used to the total of assets. In this research, firm size was measured by total of assets (trillion) at each sample company.
2.1.10 Leverage
A basic measure of the safety of creditors’ claims is the leverage, which states total liabilities as a percentage of total assets. A company’s debt ratio or leverage is computed by dividing total liabilities by total assets. Leverage is not a measure of short-term liquidity. Rather, it is a measure of creditors’ long term risk. The smaller the portion of total assets financed by creditors, the smaller the risk that the business may become unable to pay its debts. From the creditors’ point of view, the lower the debt ratio, the safer their position.
22
hand, indicates that the business is making little use of leverage (Williams et al, 2010). Increasing of leverage ratio has positive impact to the company’s financial risk (Horne and Wachowicz, 2009).
2.1.11 Profitability
Profitability ratio consists of net profit margin, Return on Assets (ROA), Return on Investment (ROI) and Return on Equity (ROE). In this study, ROI is used to measured profitability. In several literatures, ROI is often equated with ROA (Horne and Wachowicz, 2009). In other literatures, Riyanto (2008) explains the difference between ROA and ROI. ROA is ability of capital that invested in overall assets to make profit for investors (shareholders and bondholders), while ROI is the ability of capital that be invested in overall assets to make net profit. Positive ROI indicates total asset that is used in operating activities capable to create the company’s profit.
Company with better operating performance is more likely to make detailed environmental disclosure, because they are able to spend more on environmental abatement than others (Freedman and Jaggi, 2005). Therefore, companies which have better economic performance can be expected to perform good job environment (Porter and Van der Linde, 1995).
2.2 Prior Researches
Table 2.2
List of Prior Researches
Researcher Variable Statistical
Analysis Samples Findings
Freedman
Regression The study is based on disclosures
24
Researcher Variable(s) Statistical Analysis and publicly report to the CDP, tend to be large and in the energy and
mining and industrial sectors. The credibility and extent of disclosures are related to the existence of a
certificate EMS, public reporting to the CDP, and use of the GRI. Firms that
disclose more credible
Researcher Variable Statistical
Analysis Samples Findings
Chu et al neutral and good news. The results also
indicate larger companies operating in an industry which has higher level of carbon dioxide emissions tend to have higher levels of greenhouse gas disclosures,
26
directors or board of commissioners but it will be extended according to condition in Indonesia. Furthermore, additional independent variable that adjusted with research context in Indonesia was PROPER.
Study of Rankin et al (2011) used firm size, companies’ profitability and companies’ leverage as control variables, but this study using the control variables as independent variables. It referred to study of Chu et al (2013) Lorenzo et al (2009) and Freedman and Jaggi (2005) that used firm size, profitability and leverage ratio as independent variables.
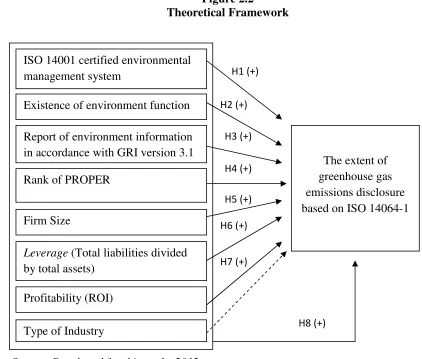
2.3 Theoretical Framework
In this study, researcher takes seven independent variables, these are consist of ISO 14001 certified Environmental Management System (EMS), the existence of environment function, the report of environment information in accordance with Global Reporting Initiative (GRI), the rank of PROPER, firm size, companies’ leverage, and companies’ profitability, and one control variable from type of industry.
Figure 2.2
Theoretical Framework
Source: Developed for this study, 2012
2.4 Hypothesis Development
2.4.1 ISO 14001 Certified Environmental Management System
Institutional governance system theory explains that market governance declares if corporations individually execute on climate change activities as the consequence of managerial choice (company’s prerogative). The lack of public policy guidelines causes the several companies in Indonesia in implementing the guidelines of non-government organizations such as ISO for demonstrating their proactive approach on climate change issue. One of the organizational
ISO 14001 certified environmental management system
Existence of environment function Report of environment information in accordance with GRI version 3.1 Rank of PROPER
28
management aspects based on ISO guidelines is implementation of environmental management system. The implementation of environmental management system shows the company’s commitment to monitor, manage, measure and report their environmental performance, including greenhouse gas emissions disclosure. Environment management system is a tool that designed to manage greenhouse gas emissions in organization for overcoming the climate change.
ISO published ISO 14001: 2004 (Mello, 2006) for facilitating, organizing, monitoring, verifying and reporting the implementation of environmental management system in organization. Herremans et al (2009) used environmental management system as proxy to determine whether strategy of the company has conformity with GRI’s visions or has internal control system to support the truth of financial statement. The existence of environmental management system indicates that environmental management accounting system serves managerial process and external reporting as response to internal issues to increasing social environment attention, including attention from investors.
credibility of greenhouse gas emissions disclosure. Based on the description, this study proposes hypothesis as follows:
H1: ISO 14001 certified environmental management system has a positive effect to the extent of greenhouse gas emissions disclosure based on ISO 14064-1.
2.4.2 The Existence of Environment Function
According to institutional governance system theory, market governance gives permission to companies for determining their policy on climate change. The initiatives for overcoming climate change can be demonstrated by the response of internal governance such as the existence of environment committee in company.
The existence of environment committee shows the company’s greenhouse gas emissions management attention to improving their environmental reputation (Neu, et al, 1998), especially to the stakeholders. The existence of environment committee proves that company’s governance realize in the long term organization strategy into the future which capable to minimize the carbon footprint proactively. Therefore, the main purpose of environment committee motivates companies to adopt policy, to measure, to practice and to report the greenhouse gas emissions.
30
and provides more credible information (Ash forth and Gibbs, 1990). The study of Rankin et al (2011) showed that the existence of environment committee did not find significant effect to the extent and the credibility of greenhouse gas emissions disclosure.
The research context in Indonesia shows that the existence of environment committee on the structure of organization either the board of directors or board of commissioners is rarely found. Therefore, this study tries to expand the scope of environment committee to the environment function. The existence of environment function is not only limited in formal organization’s structure (management hierarchy) but also to the person responsibility in environment programs (such as corporate social responsibility). The environment function with higher position would increase their authority. The environment function with higher authority enable the companies to be formulated into their greenhouse gas emissions policies, included reporting to the public. Based on the description, this study proposes hypothesis as follows:
H2: The existence of environment function has a positive effect to extent of greenhouse gas emissions disclosure based on ISO 14064-1.
2.4.3 The Report of Environment Information in accordance with Global Reporting Initiative (GRI) version 3.1
non-government organizations such as GRI which is demonstrating their proactive approach on climate change issued to the stakeholders.
GRI reporting framework has globally been accepted for improving the quality of sustainability report in order to increase transparency, comparability, clarity and other principles. Rankin et al (2011) explained that companies are using GRI guidelines to generate sustainability information in private regulation and it can be used to disclose their greenhouse gas emission in annual report. The adoption of GRI guidelines demonstrated the company’s commitment for overcoming the climate change. The study of Rankin et al (2011) found that sustainability information had the significant effect to the extent and credibility of greenhouse gas emissions disclosure. Based on the description, this study proposes hypothesis as follows:
H3: The Report of environment information in accordance with Global Reporting Initiative (GRI) version 3.1 has a positive effect to extent of greenhouse gas emissions disclosure based on ISO 14064-1
2.4.4 Rank of PROPER
32
Social responsibility perspective emphasizes the importance of relation between environmental performance and environmental disclosure for developing positive relation and credible validation (Al-Tuwaijri, 2004). Verrocchio (1983) assume that good environmental performance reduces the firm’s exposure to future environmental costs, then disclosure of this information should be perceived as good news by investors. Therefore, firms with good environmental performance should disclose more environmental information both in quantity and in quality than firms with poorer environmental performance.
Companies with superior environmental performance have more incentives to inform their proactive environmental strategy by voluntarily disclosing to investors and other stakeholders. They seek to disclose their performance type that is not directly observed by investors and other stakeholders, through direct voluntary disclosures that cannot be easily imitated by poor environmental performers. Consequently, they potentially increase investor’s valuation towards company’s positive performance (Clarkson et al, 2006).
Al-Tuwaijri (2004) found a significantly positive relation between good environmental performance and more extensive quantifiable disclosure of environmental information. Its result is similar to study of Suratno et al (2006) and Rakhiemah and Agustia (2009), whom also found that environmental performance (Rank of PROPER) had significantly positive effect to the environmental disclosure. Based on the description, this study propose hypothesis as follows:
2.4.5 Firm Size
Firm size is often used in previous studies to explain the publication of environment information (Lorenzo et al, 2009). Large companies get more public attention, so they disclose more environmental information to prevent and to resolve the conflicts (Lorenzo et al, 2009). Liu and Anbumozhi (2009) argued that large company get more public monitoring and they also have superiority resource in environmental management efforts.
Corporate social reporting (CSR) is a strategy adopted by companies to achieve legitimacy and survive in society. Legitimacy theory suggests that visible companies which face higher public pressure need to be involved in socially responsible activities and tend to report more information to the public to maintain legitimacy and protect their reputation (Chu et al, 2013).
By analysing 120 large companies both countries which ratified the Kyoto Protocol and countries which not ratified the Kyoto Protocol. Freedman and Jaggi (2005) found that greenhouse gas emissions disclosure is positively related to the firm size. Their results are similar to study of Rankin et al (2011), Lorenzo et al (2009) and Chu et al (2013), whom also found that firm size was significant effect to the extent of greenhouse gas emissions disclosure. Based on the description, this study proposes hypothesis as follows:
H5: The Firm Size has a positive effect to extent of greenhouse gas emissions disclosure based on ISO 14064-1
2.4.6 Companies’ Leverage
34
increase the amount of information disclosure, companies can construct their legitimacy and minimise their potential conflicts of interest between owners and creditors. Legitimacy theory suggests that companies with higher risk tend to report more information to grow company’s good image and legitimacy.
According to Freedman and Jaggi (2005), the absence of detailed pollution disclosure causes investors and creditors are not capable to evaluate the default risks of company. Therefore, the investors and creditors can’t avoid investment in company. Freedman and Jaggi (2005) did not find significant effect between leverage and greenhouse gas emissions disclosure. Same as Freedman and Jaggi (2005), Lorenzo et al (2009) also did not find significant effect between leverage and disclosure of greenhouse gas emissions. In contrast, the research of Rankin et al (2011) found that leverage is positively associated with the extent and credibility of greenhouse gas emissions disclosure. Based on the description, this study proposes hypothesis as follows:
H6: Companies’ Leverage has a positive effect to the extent of greenhouse gas emissions disclosure based on ISO 14064-1
2.4.7 Companies’ Profitability
environment disclosure. On the other hand, Neu et al (1998) explains that firms with unfavourable profitability take the advantage of environmental disclosure for legitimacy purpose.
The research of Freedman and Jaggi (2005) and Chu (2013) did not find significant effect between profitability and greenhouse gas emissions disclosure. Meanwhile, the research of Lorenzo et al (2009) found that ROA had no significant effect to the disclosure of greenhouse gas emissions, but ROE had significantly negative effect to the disclosure of greenhouse gas emissions. The study of Lorenzo et al (2009) was using ROA and ROE to measure profitability because ROA was used to reflect the technical characteristics and associated with the efficiency of company, while ROE provided that the financial perspective was according to stakeholders’ demands.
In this study, ROA and ROE are not used as the proxy of profitability, but Return on Investment (ROI) is used to measure profitability. In this study, ROI is more appropriate to explain the extent of greenhouse gas emissions disclosure because the cost of disclosure is indirect investment that will be expected increasing the company’s net profit. Based on the description, this study proposes hypothesis as follows:
H7: Companies’ Profitability has a positive effect to the extent of greenhouse gas emissions disclosure based on ISO 14064-1
2.4.8 Simultaneous Test to the Independent Variables
36
Global Reporting Initiative (GRI) version 3.1, and company’s profitability have positive effect to the extent of greenhouse gas emissions disclosure based on ISO 14064-1. Besides, legitimacy theory explains that rank of PROPER, firm size and companies’ leverage have positive effect to the extent of greenhouse gas emissions disclosure. Combination of the theories explain that ISO 14001 certified Environmental Management System (EMS), the existence of environment function, the report of environment information in accordance with Global Reporting Initiative (GRI) version 3.1, the rank of PROPER, firm size, companies’ leverage, and companies’ profitability have positive effect to the extent of greenhouse gas emissions disclosure.
This study is not only examines the effect of independent variables to dependent variable partially, but also simultaneously. Simultaneous test is used for comparing statistical models that have been fitted into a data set in order to identify the best model that suitable with the population from which the simplicity of data. Based on the description, this study proposes hypothesis as follows: H8: Independent variables have simultaneous effect to the extent of
CHAPTER III RESEARCH METHODS
3.1 Research Variables and Operational Definition
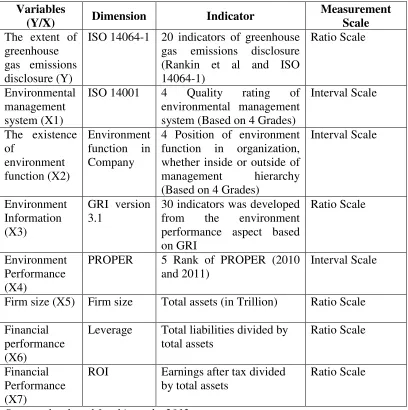
The summary of research variables, dimensions, indicators and measurement scales in this study are presented in below table,
Table 3.1
Variables, Dimensions, Indicators and Measurement Scale Variables
ISO 14064-1 20 indicators of greenhouse gas emissions disclosure (Rankin et al and ISO system (Based on 4 Grades)
Interval Scale function in organization, whether inside or outside of from the environment performance aspect based on GRI
Firm size (X5) Firm size Total assets (in Trillion) Ratio Scale Financial
performance (X6)
Leverage Total liabilities divided by total assets
Ratio Scale
Financial Performance (X7)
ROI Earnings after tax divided
by total assets
Ratio Scale
Source: developed for this study, 2012
38
3.1.1 Dependent Variable
The dependent variable is the variable of primary interest to the researcher (Sekaran, 2006). Dependent variable in this study was to the extent of greenhouse gas emissions disclosure based on ISO 14064-1 (EMD).
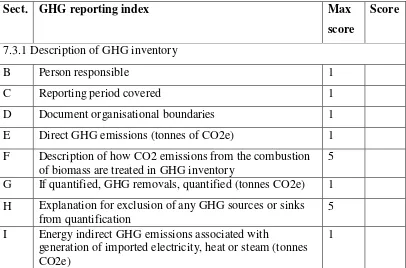
The extent of greenhouse gas emissions disclosure was measured by index based on ISO 14064-1. The developing of index is consistent with study of Rankin et al (2011). The score of index was given to the information that contained in annual report or sustainability report as the measurement of greenhouse gas emissions disclosure. Measurement was determined by the score of company’s information disclosure that compared with the score of disclosures which was developed from ISO 14064-1. Index the extent of greenhouse gases is as follows:
Table 3.2
Greenhouse Gases Disclosure Index Based on ISO 14064-1 Requirements
Sect. GHG reporting index Max
score
Score
7.3.1 Description of GHG inventory
B Person responsible 1
C Reporting period covered 1
D Document organisational boundaries 1
E Direct GHG emissions (tonnes of CO2e) 1
F Description of how CO2 emissions from the combustion of biomass are treated in GHG inventory
5 G If quantified, GHG removals, quantified (tonnes CO2e) 1 H Explanation for exclusion of any GHG sources or sinks
from quantification
5 I Energy indirect GHG emissions associated with
generation of imported electricity, heat or steam (tonnes CO2e)
Sect. GHG reporting index Max score
Score
j and k Historical base year selected and base-year GHG inventory
1
l and m Reference to or description of quantification methodologies
1
N Reference to or documentation of GHG emission or removal factors used
1 O Description of impact of uncertainties on accuracy of
GHG emissions & removals data
1 P Statement that prepared in accordance with ISO 14064 1 Q Statement describing GHG inventory, report or assertion
has been verified
1
Subtotal 22
7.3.2 Other issues to be considered
A Description of policies, strategies and programs 5
F GHG emissions or removals disaggregated by facility 1 H Uncertainty assessment description and results (incl.
measures to manage or reduce uncertainties)
1 I Description of and presentation of additional indicators
(e.g. efficiency or GHG emission intensity)
1 J Assessment of performance against internal and/or
external benchmarks
1 K Description of GHG info management and monitoring
procedures greenhouse gas emissions disclosure was done with the following steps:
40
3. The formed index calculation of greenhouse gas emissions disclosure as follow:
3.1.2 Independent Variables
An independent variable is influences the dependent variable in either positive or negative way (Sekaran, 2006). In this study, there are seven independent variables. In previous chapter is explained each of independent variable. The independent variables in this study are consists of:
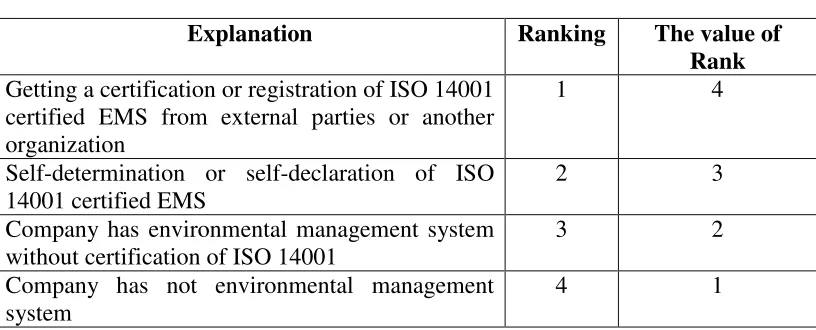
3.1.2.1ISO 14001 certified Environmental Management System (EMS)
Measurement was determined by the quality of environmental management system. The rank of environmental management system and the value of each rank were classified into 4 categories,
Table 3.3
Environmental Management System
Explanation Ranking The value of
Rank Getting a certification or registration of ISO 14001
certified EMS from external parties or another organization
1 4
Self-determination or self-declaration of ISO 14001 certified EMS
2 3
Company has environmental management system without certification of ISO 14001
3 2
Company has not environmental management system
4 1
3.1.2.2The Existence of Environment Function (ENV_FU)
Measurement was performed by assessing on how the position of environment functions in a company. The indicator is the existence of environment function, either inside position in management hierarchy or outside the management hierarchy (person responsible of environment activity). The detailed explanation about the existence of environment function is in below table:
Table 3.4
The Existence of Environment Function
Explanation Ranking The value of
Rank The person responsibility of environment issues
at top management
1 4
The person responsibility of environment issues at middle management
2 3
The person responsibility of environment issues at low management
3 2
The person responsibility of CSR (outside the management hierarchy)
4 1
Source: developed for this study, 2012
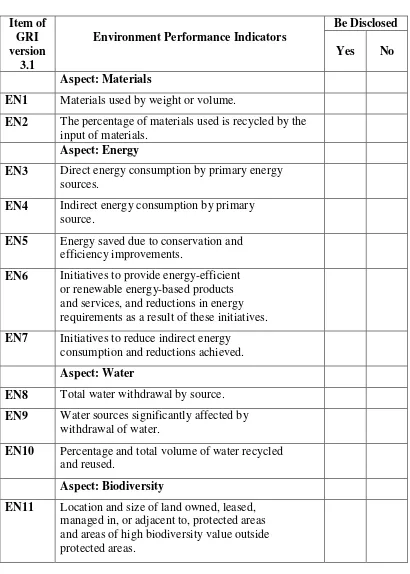
3.1.2.3The Report of Environment Information in accordance with Global Reporting Initiative Version 3.1 (GRI)
42
Table 3.5
Environment Performance Indicator Based on GRI Version 3.1 Item of
EN1 Materials used by weight or volume.
EN2 The percentage of materials used is recycled by the input of materials.
Aspect: Energy
EN3 Direct energy consumption by primary energy sources.
EN4 Indirect energy consumption by primary source.
EN5 Energy saved due to conservation and efficiency improvements.
EN6 Initiatives to provide energy-efficient or renewable energy-based products and services, and reductions in energy requirements as a result of these initiatives. EN7 Initiatives to reduce indirect energy
consumption and reductions achieved. Aspect: Water
EN8 Total water withdrawal by source. EN9 Water sources significantly affected by
withdrawal of water.
EN10 Percentage and total volume of water recycled and reused.
Aspect: Biodiversity
Item of EN12 Description of significant impacts of activities,
products, and services on biodiversity in protected areas and areas of high biodiversity value outside protected areas.
EN13 Habitats protected or restored
EN14 Strategies, current actions, and future plans for managing impacts on biodiversity.
EN15 Number of IUCN Red List species and national conservation list species with habitats in areas affected by operations, by level of extinction risk.
Aspect: Emissions, Effluents, and Waste EN16 Total direct and indirect greenhouse gas
emissions by weight.
EN17 Other relevant indirect greenhouse gas emissions by weight.
EN18 Initiatives to reduce greenhouse gas emissions and reductions achieved.
EN19 Emissions of ozone-depleting substances by weight.
EN20 NOx, SOx, and other significant air emissions by type and weight.
EN21 Total water discharge by quality and destination.
EN22 Total weight of waste by type and disposal method.
EN23 Total number and volume of significant spills. EN24 Weight of transported, imported, exported, or
44 EN25 Identity, size, protected status, and
biodiversity value of water bodies and related habitats significantly affected by the reporting organization’s discharges of water and runoff. Aspect: Products and Services
EN26 Initiatives to mitigate environmental impacts of products and services, and extent of impact mitigation.
EN27 Percentage of products sold and their packaging materials that are reclaimed by category.
Aspect: Compliance
EN28 Monetary value of significant fines and total number of non-monetary sanctions for noncompliance
with environmental laws and regulations.
Aspect: Transport
EN29 Significant environmental impacts of transporting products and other goods and materials used for the organization’s operations, and transporting the member of workforce.
Aspect: Overall
EN30 Total environmental protection expenditures and investments by type.
TOTAL
Source: Global Reporting Initiative, 2011
1. Gave score for each item of disclosure by dichotomy. The companies were given score 1 if they disclosed the item of information and score 0 if they did not disclose the item of information.
2. Score that was obtained by each company was summed for getting the total score.
3. Score calculation the report of environment information in accordance with GRI version 3.1 had the following formula:
3.1.2.4Rank of PROPER
In the PROPER rating system, performance appraisal result is demonstrated with colour according to the rate of performance. There are 5 ratings with 5 colours categories: gold, green, blue, red, and black. Gold indicates the highest ranking, whereas black indicates the lowest ranking.
46
Table 3.6
Rank of Colour in PROPER
Explanation Ranking The Value of Ranking
Gold 1 5
Green 2 4
Blue 3 3
Red 4 2
Black 5 1
Companies will get score 0 if they have no publication of PROPER. The absence of PROPER has several possible reasons, such as companies are not become the target participant of PROPER, currently undergoing the law enforcement, currently running the mandatory audit and force majeure (KLH, 2011).
3.1.2.5Companies’ Firm Size (SIZE)
Firm size indicates the total assets of company at the year ended. Firm size was obtained from data of total assets in Trillion rupiah. Formulation of firm size is as follows:
Firm size = Total assets in Trillion Rupiah.
3.1.2.6Companies’ Leverage (LEV)
Leverage measured how much assets were financed by debt. Leverage was calculated by (Horne and Wachowicz, 2009):
3.1.2.7Profitability (ROI)
ROI measured profitability of the company. ROI was calculated by (Riyanto, 2008):
3.1.3 Control Variable
Control variable in this study is a type of industry. Some industries are more likely to get public attention, especially in industries with operating activity which produced the higher greenhouse gas emissions (Rankin et al, 2011). Controlling of greenhouse gas emissions directly effect on energy and extractive industries, other industries that rely on fossil fuels, including coal, oil, motor vehicle, power stations and airlines (Rankin et al, 2011). Industrial emitters of greenhouse gases have the greater business risk because companies potential to face the demands of stakeholders in environmental issues. In this study, type of industry was classified into 5 types that are agriculture, mining, basic industry and chemicals, miscellaneous industries, and consumer goods industries.
3.2 Population and Sample Determination 3.2.1 Population