A B S T R A C T
In this study we analyze whether immigrant mothers in Norway can infl uence their mode of delivery. Patient preferences were measured as the rate of Caesarean section from their home country, and by a survey question measuring the extent to which people believe they have freedom of choice and control over their lives in their home country. Preferences have a causal effect on the likelihood of Caesarean section. Medical risk factors are still the most important reasons for having a Caesarean section, but our regression estimates show that a substantial share of Caesarean sections is due to preferences as well.
I. Introduction
Almost nothing is known about the infl uence that patients have on medical treatment. For many types of treatment, physicians are expected to discuss op-tions with their patients, and allow patients to infl uence choice of procedure. Assessing the infl uence of patients is methodologically challenging. Our interest was triggered by the current debate about the position of mothers in maternity care, and whether they can request a Caesarean section in the absence of clinical indications (Wax et al. 2004, Young 2006).
This topic has received a great deal of attention, partly because it highlights the
Jostein Grytten is professor in community dentistry at the Faculty of Dentistry, University of Oslo, and a researcher in the Department of Gynecology and Obstetrics, Akershus University Hospital. Irene Skau is a researcher in community dentistry at the Faculty of Dentistry, University of Oslo. Rune Sørensen is profes-sor of political economy at BI Norwegian Business School, Oslo. This study received fi nancial support from the South- Eastern Norway Regional Health Authority (research grant number 2709002), and was approved by the Regional Committee for Medical and Health Research Ethics. The authors wish to thank Linda Grytten for translation and language correction, and the Medical Birth Registry of Norway and Statistics Norway for providing the data. The data used in this article can be obtained beginning July 2013 through June 2016 from Jostein Grytten, josteing@odont.uio.no.
[Submitted July 2011; accepted March 2012]
SSN 022 166X E ISSN 1548 8004 8 2013 2 by the Board of Regents of the University of Wisconsin System
Grytten, Skau, and Sørensen 143
tension between “mothers’ rights to autonomous decision and obstetricians’ right to autonomy in operating in accordance with accepted medical practice” (Amu, Rajend-ram, and Bolaji 1998). Ethical, judicial and economic issues are involved. For ex-ample, what right does a woman have to decide on her mode of delivery, and on what basis does she make this decision? Is she well enough informed, and does she have the ability to assess the short- term and long- term consequences of her choice? Who should pay for the extra cost if she chooses a Caesarean delivery—the woman or the insur-ance company? These are questions that have been widely discussed, for example, see: Amu, Rajendram, and Bolaji (1998); Hall (1987); Harris (2001); Hemminki (1997); MacKenzie (1999); Paterson- Brown (1998); Tranquilli and Garzetti (1997); Wagner (2000). However, the main question—do women’s preferences have any role to play in the choice of mode of delivery?—is still not answered. We exploit the fact that there has been a great increase in the number of immigrants in Norway from 1970 and up to the present day. Data for almost 94,000 immigrant mothers, from 133 countries form the basis for our analyses.
Immigrants come from countries with a wide range of Caesarean section rates. We
fi nd that immigrant mothers’ mode of delivery in Norway is determined by the rate of Caesarean section in their home country. We assume that the rate of Caesarean section is a proxy variable for their preferences for mode of delivery in Norway. The extent to which immigrant mothers have the possibility to express, or are used to expressing, their preferences varies with the cultural values in their home country. Immigrants who come from countries where women believe they have freedom of choice and con-trol over their lives are more likely to deliver by Caesarean section. These effects are stronger for elective than for emergency Caesarean sections. The infl uence of home country background appears to fade out after residing 25 to 40 years in Norway. The rationale for our empirical approach is outlined below.
II. Background and Methodological Considerations
Clinical uncertainty and lack of clear diagnostic criteria for assessing the medical condition of the mother and child before and during the birth can make it diffi cult for the obstetrician to decide whether a Caesarean section is indicated or not. The obstetrician’s decision is not always based on objective observation of symp-toms, but also on the mother’s subjective interpretation and assessment of the situa-tion (Habiba et al. 2006). This allows the mother to infl uence the choice of delivery, particularly when complications arise. She can either express her wishes directly, or she can adapt her description of her symptoms to her preferred choice of delivery. For example, she can describe her symptoms as worse than they actually are if she wants to have a Caesarean delivery. If the obstetrician takes the mother’s preference into account, this can explain why the rate of Caesarean section for immigrant mothers is different from the rate for nonimmigrant mothers.
We believe that the estimated effects are causal, indicating that mothers’ preferences have an impact on the behavior of obstetricians. There are several reasons.
First, our study was performed within a standardized institutional healthcare setting with public funding. In Norway, all health services (Caesarean sections included) are
When studying preferences, the standardized institutional healthcare environment is a major advantage compared to other settings. For example, identifi cation problems arise in market- based systems with private health insurance. The type of insurance, and the level of insurance that the mothers have, will be correlated with their prefer-ences for mode of delivery. This makes it diffi cult to distinguish between the effect of insurance and the effect of preferences. Further, in market- based healthcare systems, obstetricians may have economic incentives for carrying out a Caesarean section. Within reasonable limits, they may suppress or misinterpret the results of diagnostic tests in order to justify the mode of delivery—usually Caesarean section—that gives the highest income (Gruber, Kim, and Mayzlin 1999; Stafford 1990). In the current analyses, private health insurance or incentive- based payment systems do not bias our results.
Second, we used fi xed effects for hospitals, which cancel out the effect of the hospi-tals’ practice styles that are likely to be confounded with the mothers’ preferences for mode of delivery.1 For example, there might be a positive correlation between the
Cae-sarean section rate from the mother’s home country and the CaeCae-sarean section rate for the hospital in Norway. This would be the case if mothers from a country with a high
(low) Caesarean section rate systematically give birth in Norwegian hospitals where the rate is also high (low). A positive correlation between the Caesarean section rate from the immigrants’ home country and the likelihood of having a Caesarean section in Norway is then due to the hospitals’ practice style, and not an effect of the mothers’ preferences. To discard the variation between hospitals’ practice style, we used fi xed effects for hospitals. This implies that we estimated the effect of mothers’ preferences for given hospital practice styles.
Third, medical risk factors can be correlated with preferences. Unless these factors are properly controlled for, it is diffi cult to distinguish the effect of preferences from an effect of risk factors and health status. We handle this type of bias by including in the regressions a large set of variables that measured the health status and the risk factors of the mothers and babies. Additional analyses confi rmed that the medical risk factors were properly controlled for.
Fourth, reversed causality is unlikely. When people migrate to a new country, it resembles a natural experiment. The Caesarean section rates in the immigrants’ home country are not determined by Norwegian obstetricians and their preferred mode of delivery. This implies that Caesarean section rates in the immigrants’ countries of ori-gins are likely to exert an exogenous infl uence on the individual mothers’ mode of delivery in Norway.
Grytten, Skau, and Sørensen 145
III. The Source of the Data and Analyses
A. The Medical Birth Registry and Data from Statistics Norway
The analyses were carried out on data from the Medical Birth Registry of Norway (MBRN) for the period 1970 to 2005, for approximately two million births (www .fhi.no). All maternity units must report all births to MBRN (Irgens 2000). On the reg-istration form, the personal identifi cation numbers of the child and the parents are re-corded. This made it possible to merge the data from MBRN with two data registers in Statistics Norway. The fi rst register contains information about home country and length of residence in Norway for all fi rst generation immigrants (Statistics Norway 2009). The second register, the Norwegian Standard Classifi cation of Education (Statistics Norway 2000), contains information about the highest education for all Norwegians.
B. The Caesarean Section Rate for the Home Country
In the MBRN, 179 countries (not including Norway) were represented, with a total of 133,011 births. By carrying out an extensive search of the literature, we found the rate of Caesarean section for 133 of the countries. There were 93,823 births for women from these countries, which amounts to 70.5 percent of all the births for immigrant women for the period 1970–2005. A detailed overview of the rate of Caesarean section for each home country for each year data was available is given in Table 1. Below, we give some brief comments about the most important sources for these rates.2
For the European countries, we found most of the Caesarean section rates in the European Health for All Data base. The data base is maintained by the WHO European Regional Offi ce. These data are compiled from different sources: “from a network of country experts, WHO / Europe’s technical programs and from partner organizations such as the United Nations, EUROSTAT and the Organization for Economic Coop-eration and Development” (World Health Organization 2011a). The European Health for All Data base has annual Caesarean section rates for most countries back to 1980. For the Nordic countries, Greece and Portugal, the rates are given right back to the 1970s. For the countries for which information was not available about Caesarean sec-tion rates before 1980 in the European Health for All Data base, we obtained fi gures from Bergsjø, Schmidt, and Pusch (1983), Notzon, Placek, and Taffel (1987), and Stephenson et al. (1993). These are representative fi gures, collected from different sources: The data “were based on either a complete count of births or a nationally rep-resentative sample of births” (Notzon, Placek, and Taffel 1987). Notzon, Placek, and Taffel (1987) is also the main source for Caesarean section rates for the United States, Canada, Australia, and New Zealand before 1983. For later years, we used fi gures from the Organization for Economic Cooperation and Development (OECD 2010).
Our primary source for Caesarean section rates for the developing countries is De-mographic and Health Surveys (Measure DHS 2011). These surveys are funded by the United States Agency for International Development, and they “represent the largest
an Re
sourc
es
Mother’s home country
Number of deliveries in Norway
rate from the mother’s home country known
immigrants are represented
in the data
data for Caesarean section rate
from the mother’s home
country
data from World Value
Survey
Mean index scorea
Western Europe
Austria 318 66.0 36 24 0.127 2 7.45
Belgium 387 77.0 36 27 0.123 3 6.55
Denmark 9,845 100.0 36 36 0.119 3 7.37
Finland 3,585 100.0 36 36 0.131 4 7.80
France 1,207 95.9 36 34 0.129 3 6.36
Germany 4,228 79.4 36 29 0.165 4 7.12
Greece 120 95.8 35 34 0.216 1 6.97
Iceland 1,729 100.0 36 36 0.112 3 7.57
Ireland 342 90.9 36 34 0.112 3 7.28
Italy 374 75.7 36 26 0.245 4 6.63
Luxembourg 11 72.7 9 6 0.204 1 6.94
Malta 27 18.5 20 4 0.227 1 7.53
Monaco 4 25.0 4 1 0.035 — —
Netherlands 2,097 100.0 36 36 0.070 3 6.56
Norway 1,909,168 100.0 36 36 0.103 3 7.33
Portugal 297 100.0 36 36 0.162 2 6.76
Spain 670 70.9 36 23 0.173 4 6.74
G
ryt
te
n, S
ka
u, a
nd S
øre
ns
en
147
Switzerland 584 52.6 36 18 0.203 1 7.18
United Kingdom 5,192 100.0 36 36 0.131 4 7.03
Central and Eastern Europe
Albania 76 94.7 18 14 0.124 2 5.55
Belarus 82 100.0 10 10 0.148 2 5.81
Bosnia-Herzegovina 2,205 100.0 14 14 0.152 2 6.43
Bulgaria 258 96.9 28 23 0.102 3 5.85
Croatia 299 100.0 14 14 0.108 2 6.93
Czech Republic 101 100.0 14 14 0.125 4 6.77
Estonia 206 100.0 13 13 0.127 2 6.49
Hungary 674 86.1 36 31 0.125 3 6.73
Latvia 183 100.0 14 14 0.141 2 6.19
Lithuania 243 100.0 13 13 0.125 2 6.53
Poland 3,199 54.7 36 14 0.155 4 6.64
Republic of Moldova 31 100.0 9 9 0.070 2 6.15
Romania 511 88.3 36 18 0.113 4 6.95
Russia 1,794 100.0 14 14 0.127 3 6.06
Serbia and Montenegro
3,634 73.1 14 9 0.116 2 6.26
Slovac Republic 71 100.0 11 11 0.149 2 6.47
Slovenia 14 100.0 10 10 0.114 4 7.30
TFYR Macedonia 329 93.6 12 10 0.097 2 6.10
Ukraine 232 100.0 12 12 0.097 2 5.76
Central Asia
Armenia 14 100.0 5 5 0.066 1 5.91
Azerbaijan 36 100.0 10 10 0.028 1 5.49
Georgia 11 100.0 7 7 0.094 1 6.40
an Re
sourc
es
Mother’s home country
Number of deliveries in Norway
rate from the mother’s home country known
immigrants are represented
in the data
data for Caesarean section rate
from the mother’s home
country
data from World Value
Survey
Mean index scorea
Kazakhstan 59 100.0 9 9 0.067 — —
Kyrgyzstan 12 100.0 5 5 0.039 1 7.29
Tajikistan 10 100.0 6 6 0.016 — —
Turkmenistan 7 71.4 5 3 0.027 — —
Uzbekistan 21 95.2 7 6 0.031 — —
Middle East
Bahrain 6 16.7 6 1 0.16 — —
Iraq 3,796 0.0 25 0 — — —
Israel 274 91.6 35 28 0.112 — —
Jordan 106 92.5 27 20 0.119 1 6.97
Kuwait 43 18.6 19 4 0.103 — —
Lebanon 846 50.4 29 9 0.191 — —
Palestine 82 37.8 19 4 0.101 — —
Saudi Arabia 23 56.5 10 6 0.108 1 6.60
Syria 468 43.8 27 6 0.144 — —
Turkey 5,454 87.4 35 21 0.139 3 5.30
United Arab Emirates 21 28.6 9 4 0.099 — —
G
ryt
te
n, S
ka
u, a
nd S
øre
ns
en
149
Southeast Asia
Afghanistan 655 10.8 19 1 0.016 — —
Bangladesh 258 53.1 30 10 0.038 2 5.92
Cambodia 117 52.1 22 10 0.015 — —
China 1,312 96.2 36 28 0.317 3 7.00
Hong Kong, China 217 27.2 35 8 0.243 — —
India 3,029 76.8 36 20 0.055 3 6.27
Indonesia 297 72.1 36 20 0.038 1 7.22
Iran 2,554 67.5 33 22 0.157 1 6.67
Japan 429 18.6 36 5 0.069 1 5.94
Malaysia 187 9.6 33 3 0.124 — —
Nepal 49 93.9 16 13 0.013 — —
Pakistan 14,512 40.3 36 10 0.053 1 4.60
Philippines 1,039 85.0 36 20 0.068 2 6.95
Singapore 153 11.8 33 4 0.135 — —
South Korea 301 85.7 36 24 0.255 5 6.75
Sri Lanka 5,008 62.8 35 11 0.176 — —
Thailand 3,356 53.9 35 12 0.216 — —
Vietnam 6,758 40.9 33 8 0.064 1 7.51
North Africa
Algeria 362 21.3 33 4 0.068 — —
Egypt 142 73.9 33 20 0.110 1 5.61
Morocco 3,022 81.8 35 18 0.043 1 6.27
Tunisia 233 64.8 31 12 0.207 — —
Sub-Saharan Africa
Angola 65 16.9 19 1 0.011 — —
Benin 2 100.0 2 2 0.028 — —
an Re
sourc
es
Mother’s home country
Number of deliveries in Norway
rate from the mother’s home country known
immigrants are represented
in the data
data for Caesarean section rate
from the mother’s home
country
data from World Value
Survey
Mean index scorea
Burkino Faso 1 100.0 1 1 0.010 — —
Cameroon 54 92.6 15 11 0.023 — —
Eritrea 411 14.8 22 3 0.020 — —
Ethiopia 1,068 19.8 28 3 0.007 — —
Gambia 391 29.9 30 6 0.006 — —
Ghana 731 97.1 28 20 0.045 — —
Ivory Coast 31 80.6 16 14 0.024 — —
Kenya 370 87.0 34 20 0.049 — —
Madagascar 74 63.5 28 15 0.008 — —
Malawi 3 100.0 3 3 0.031 — —
Mali 9 100.0 8 8 0.011 — —
Mauritania 2 100.0 2 2 0.027 — —
Mozambique 36 13.9 24 3 0.025 — —
Namibia 23 47.8 14 5 0.091 — —
Niger 3 100.0 2 2 0.008 — —
Nigeria 279 86.7 33 21 0.025 3 6.86
Rwanda 75 100.0 12 12 0.022 — —
G
ryt
te
n, S
ka
u, a
nd S
øre
ns
en
151
Somalia 5,343 0.0 27 0 — — —
South Africa 233 76.0 36 28 0.135 3 6.70
Sudan 201 18.9 23 3 0.040 — —
Togo 26 15.4 17 3 0.019 — —
Tanzania 197 87.3 33 20 0.029 1 5.66
Uganda 196 87.8 29 20 0.027 1 6.85
Zambia 67 91.0 23 18 0.024 — —
Zaire 151 27.8 26 9 0.086 — —
Zimbabwe 39 92.3 18 15 0.060 1 5.64
North America
Canada 638 100.0 36 36 0.168 3 7.57
USA 4,104 100.0 36 36 0.182 4 7.70
Latin America/Caribbean
Argentina 223 37.2 36 13 0.215 3 7.25
Bolivia 60 98.3 20 19 0.142 — —
Brazil 680 100.0 36 36 0.294 2 7.26
Chile 2,355 97.7 36 28 0.245 4 7.15
Colombia 320 89.4 36 25 0.203 3 7.92
Costa Rica 28 35.7 20 6 0.186 — —
Cuba 181 30.9 19 9 0.204 — —
Dominican Republic 162 98.8 22 20 0.295 1 7.43
Ecuador 115 86.1 33 24 0.201 — —
El Salvador 42 95.2 18 17 0.150 1 7.48
Guatemala 41 82.9 23 17 0.101 1 7.47
Haiti 4 100.0 3 3 0.020 — —
Honduras 37 86.5 23 20 0.083 — —
Jamaica 53 15.1 28 5 0.055 — —
an Re
Mexico 247 89.5 36 25 0.286 4 7.83
Nicaragua 50 92.0 23 19 0.140 — —
Panama 14 7.1 10 1 0.180 — —
Paraguay 22 81.8 17 14 0.166 — —
Peru 278 97.5 30 25 0.124 2 6.98
Trinidad and Tobago 124 59.7 36 21 0.059 — —
Uruguay 68 52.9 25 11 0.195 1 7.01
Venezuela 114 36.8 26 13 0.156 — —
Oceania
Australia 332 100.0 36 36 0.163 3 7.40
New Zealand 162 75.3 36 26 0.132 2 7.87
Rest
44 small countries from different continents
856 0.0 — 0 — — —
Grytten, Skau, and Sørensen 153
worldwide effort to obtain demographic and health data from national representative households surveys in developing countries” (Betrán et al. 2007). They use standard-ized questionnaires and methods for training the interviewers, collecting the data, and processing the data. The surveys have been carried out in over 75 developing countries from the middle of the 1980s (Measure DHS 2011). The samples are large—between 3,000 and 30,000 respondents from each country. This ensures representativeness and precise estimates of the Caesarean section rates (Holtz and Stanton 2007; Stanton et al. 2005).
For some years, and for some countries, Caesarean section rates were not given in the Demographic and Health Surveys. We then supplemented with data from other sources. The two most important of these sources were: First, the WHO Global Sur-veys on Maternal and Perinatal Health (World Health Organization 2011b). These surveys are large, representative studies from 54 developing countries (Shah et al. 2008). For example, the samples included about 100,000 women from the Latin American countries and 80,000 women from African countries of fertile age.3 Second,
overviews by Jurdi and Khawaja (2004) and Khawaja, Choueiry, and Jurdi (2009) for countries in the Middle East and for North African countries. They have collated data from different sources—mainly from national surveys and from hospital records— from almost 20 countries.
Data that are lacking in the MBRN are mainly for mothers from two groups of countries. The fi rst group contains countries that Norway has received many asylum seekers and refugees from: Somalia, Algeria, Eritrea, Ethiopia, Gambia, Sudan, Af-ghanistan, Iraq, Lebanon, Syria, Vietnam, and Sri Lanka. These countries are charac-terized by long- lasting war, unrest, and / or famine. We lacked Caesarean section rates for Somalia and Iraq for all years.4 For the other countries we had rates only for some
individual years (Table 1). For the 12 countries given above, we had data for 25,307 births in the MBRN. We had data for the Caesarean section rates for the mothers’ countries of origin for only 7,117 of these births. The second group of countries con-tains countries for which there has been high employment immigration to Norway— primarily Poland and Pakistan. For these countries, we had data for 17,711 births in the MBRN. We had data for the Caesarean section rates for the mothers’ countries of origin for 7,597 of these births. For other countries with high employment immigra-tion—mainly the other European countries—we had reliable Caesarean section rates for almost all years.
In Table 1, we present descriptive statistics according to mothers’ home country for the period 1970–2005. Mothers from Western Europe and Southeast Asia make up most of the immigrants in the MBRN—61.9 percent. Mothers from Central Asia make up a small proportion—only 0.13 percent. Mothers from the other regions make up from 0.37 percent (Oceania) to 10.6 percent (Central and Eastern Europe).
The Caesarean section rate varies a lot both between regions and between countries within each region. The rate is highest in several countries in Latin America (for
ex-3. For most Latin American and African countries, there is little information on Caesarean section rates for the years before 1980. However, this is not a problem because there were few immigrants in Norway from these countries before that time.
1970 to 2005 were by Caesarean section. This is similar to the rate in the other Nordic countries. For the countries in the Middle East, the rate varied from 9.9 percent (Ye-men) to 19.1 percent (Lebanon).
C. Data from the World Value Survey
We believe that women are more likely to give birth by Caesarean section when they come from cultures that appreciate and encourage women’s right to make their own decisions and take control over their own lives.5 To test this conjecture, we used the
following survey question from the World Value Survey (WVS): “Some people feel they have completely free choice and control over their lives, while other people feel that what they do has no real effect on what happens to them. Please use this scale where 1 means “none at all” and 10 means “a great deal” to indicate how much free-dom of choice and control you feel you have over the way your life turns out.”
We used the fi rst four waves of the WVS, and they include 76 countries (152 country- years covered by survey data).6 In Table 1, we present the average score
within each country for men and women aged 40 years and younger. Countries in Latin America such as Colombia and Mexico have high scores. These countries also have high rates of Caesarean section. Women in countries such as Azerbaijan and Pakistan have low scores, and in these countries the Caesarean section rate is low.
In Table 2, we present a country- level analysis with the Caesarean section rate as a response variable and the index measuring freedom of choice and control over their lives as an explanatory variable. Data from MBRN and WVS were merged with country- survey year as a matching variable, so the number of observations corre-sponds to the number of surveys conducted. The ordinary least squares regressions are estimated with fi xed effects for country; that is, we analyze how changes over time in cultural values pertaining to women’s autonomy in society are related to the way they give birth.
The estimates in Table 2 indicate that a one- point increase in the index measur-ing freedom of choice and control produces a four percent increase in the Caesarean section rate. A culture in which the inhabitants feel they have freedom of choice and control over their lives correlates positively with the rate of Caesarean section. We do not claim that these estimates represent causal effects.
5. It has been argued that individual choice orientation, socioeconomic development, and democratization evolve together as a “modernization syndrome” (Welzel, Inglehart, and Klingemann 2003). Modernization is related to increasing affl uence and to a shift from traditional and survival- oriented values to secular and self- expression values (Inglehart and Welzel 2010).
Grytten, Skau, and Sørensen 155
D. The Model Specifi cations
All control variables in our analyses were discrete—hence a linear probability model can be used for estimation (Angrist 2001). A simplifi ed way of writing the main re-gression equation is:
(1) Pr(Caesarean section in Norway) = α0 + α1 Caesarean section rate in the home country + medical control variables + fi xed
effects for maternity unit+ fi xed effects for
year + fi xed effects for home country
We used fi xed effects for maternity units, years, and home country in the analyses. The models were estimated using multilevel regression to take into account the clus-tering of mothers into home countries.
If the mother’s preferred mode of delivery in Norway is determined by the Cae-sarean section rate in her home country, and if her preference is met, the regression coeffi cient α1 is expected to be positive and signifi cant. We used the home country Caesarean section rate for the year the mother gave birth in Norway. This is reason-able because immigrants are well updated about current issues in their home country and have close ties with their families there (Blom and Henriksen 2008). Equation 1 includes a dummy variable for whether the mother is an immigrant or not to cancel out the effects of Norwegian mothers.
In supplementary regressions, we replaced the Caesarean section rate in the home country with the variable measuring freedom of choice and control in the immigrants’ home country. We used the mean score of the index for three years: the year the WVS was conducted, and one year before and one year after the survey was conducted. This means that for each country, we applied the same index value for three consecutive
Table 2
The Effect of Freedom of Choice and Control on the Caesarean Section Rate for the Mother’s Home Country.
Country Level Analysis. Fixed Effect for Country and Year. Standard Errors Clustered by Country in Parentheses
Dependent variable
Independent variable
The Caesarean section rate for the mother’s home country
Freedom of choice and controla 0.037*
(0.010)
Number of observations (country-years) 152
* p< 0.05
E. Control Variables
Important control variables are characteristics of the health status of the mother and child (Table 2) (Gregory et al. 2002; Kolås et al. 2003). Older mothers have a Cae-sarean section more often than younger mothers, and small and large babies are more often delivered by Caesarean section than babies of average weight. Measures of health status of the mother that are likely to increase the probability for a Caesarean section are: whether the mother has asthma, diabetes, epilepsy, heart disease, chronic hypertension, chronic kidney failure, rheumatoid arthritis, whether preeclampsia is a complication, and bleeding during pregnancy. The probability for a Caesarean section also increases if the fetus has an abnormal presentation and if the birth is a multiple birth. We included two dummy variables for parents’ education in the regression. Im-migrants who have lived a long time in Norway are probably more integrated than immigrants who have arrived recently. Those who have lived in Norway a long time may therefore give the rate of Caesarean section in their home country less importance than those who have lived in Norway for a short time. We took this into account by including length of residence as a control variable in the analyses.
F. Supplementary Analyses
In order to test the robustness of the estimations based on Equation 1, we performed several additional analyses.
First, we examined whether we had suffi cient control for the medical risk factors of the mother and the baby. An obvious concern is unmeasured health risks. Immigrant mothers and their babies may have health problems that are not explicitly measured and introduced as controls in Equation 1. If preferences are positively correlated with unmeasured health risks, our results would be spurious. We therefore performed supplementary analyses with three infant health outcomes as response variables, and preferences and all the control variables used in Equation 1 as explanatory variables.
Three commonly used indicators of infant health are: neonatal mortality (the fi rst 28 days following birth), postneonatal mortality (the rest of the fi rst year of life) and Apgar score (Gortmaker and Wise 1997). Apgar score has a scale from 0 to 10, where a score above 8 is considered to be a healthy baby. We defi ned the following response for the infant: does not die within the period birth–28 days after birth, does not die within the period 1–12 months after birth, and an Apgar score higher than 8. We expect the medical risk factors (that is, the control variables from Equation 1) to have strong positive effects on each of the response variables. Ideally, we want the preference vari-able to have an insignifi cant effect. This indicates that the preference variable is not contaminated with medical risk factors that are not measured by our control variables.
Grytten, Skau, and Sørensen 157
sections. If preferences have an effect, we expect the rate of Caesarean section in the home country to have a stronger effect on elective than on emergency Cesarean sections. In the MBRN, all Cesarean sections were classifi ed as elective or emergency for the period 1995–2005. These analyses were performed with random effects for country due to insuffi cient longitudinal variation for country fi xed effects.
Third, we specifi ed the rate of the Caesarean section rate from the home country in two different ways. In the fi rst specifi cation, we used the Caesarean section rate for the year the mother came to Norway. In the second specifi cation, we used the mean Caesarean section rate for the years the mother had lived in Norway. Length of resi-dence for mothers in the MBRN is short—mean 6.8 years. As many as 55 percent had lived in Norway for fi ve years or fewer at the time of the birth.7 Over such a short time
period, there have only been small changes in the Caesarean section rate in the home countries. These changes are so small that it is unlikely that they would have had any signifi cant infl uence on the mother. Therefore, we would not expect the results to be affected by these additional analyses.
We have less information on the Caesarean section rate for the year of arrival than for the year of the birth. For example, such information was not available for the years before 1970. This additional analysis could therefore only be carried out on a sample of 72,436 immigrants. The analyses in which we used the mean Caesarean section rate was carried out for 103,702 immigrants. In this analysis, we also included mothers for whom we had information on the rate of Caesarean section for years other than the year of the birth, even though the rate for the year of birth was unknown.
Fourth, we excluded Iran and China from the sample. There are many immigrants in Norway from these two countries (Table 1). The Caesarean section rates for Iran and China are not reliable. The fi gures for Iran are from a teaching hospital (Moini et al. 2007), so they are not necessarily representative for the whole country. The fi gures for China are based on a summary made by Betrán et al. (2007) of 11 Chinese studies. These fi gures are somewhat higher than those of Stanton and Holtz (2006). China has a large population and it is hard to obtain precise estimates of the Caesarean section rate.
Fifth, we checked whether the results were infl uenced by missing values for the education variables. We have no information on the parents’ education from the home country for 9.4 percent of the births. These immigrant mothers were not included in the analysis, even though we have data for the other variables. We reanalyzed the data without including the education variables.
IV. Results
A. The Infl uence of the Caesarean Section Rate in the Home Country
The Caesarean section rate from the home country has a positive and statistically signifi cant effect on the probability of having a Caesarean section in Norway (Table 3, Column 1). The regression coeffi cient was 0.336. This implies that a one percentage
an Re
sourc
es
Ordinary Least Square Regressions. Standard Errors Clustered by Country in Parentheses
Dependent variables
The probability of having a Caesarean section in Norway
Neonatal mortality
Postneonatal mortality
Apgar score > 8b
Independent variables 1 2 3 4 5 6 7
Immigrant mothers’ preferences for Caesarean section:
The Caesarean section rate for the mother’s home country
0.336* 0.366* 0.004 0.002 0.026
(0.022) (0.023) (0.007) (0.009) (0.028) Freedom of choice and controla 0.015* 0.020*
(0.006) (0.006) Length of residence in Norway (in years) –0.0003* –0.0006* 0.0009* 0.005* (0.0001) (0.0002) (0.0003) (0.002) Immigrant mothers’ preferences for
G
ryt
te
n, S
ka
u, a
nd S
øre
ns
en
159
Caesarean section rate for the mother’s home country × length of residence in Norway
–0.009* (0.001)
Freedom of choice and controla ×
length of residence in Norway
–0.0008* (0.0003)
Fixed effect for mother’s home country Yes Yes Yes Yes Yes Random effect for mother’s home
country
Yes Yes
Number of observations 1,965,939 502,520 1,965,939 502,520 1,965,939 1,965,939 1,469,375
Notes: The following fi xed effects were included in all analyses: Maternity unit and year
Whether the mother is an immigrant or not
Mother’s age and parents’ highest level of education (university/college education, upper secondary school education, reference category: compulsory school education) Predisposing factors of the mother: asthma, diabetes, epilepsy, heart disease, chronic hypertension, chronic kidney failure, rheumatoid arthritis, preeclampsia, bleeding during pregnancy
Characteristics of the birth: birthweight ≥ 2,500g, abnormal presentation, single baby birth * p< 0.05
mothers. The current Caesarean section rate in Norway is 0.17. If the home country Caesarean section rate falls from 0.17 to 0, the decrease in the predicted probability of a Caesarean section is 0.06. Taken at face value, this implies that a third of Caesarean sections in Norway are due to mothers’ preferences.
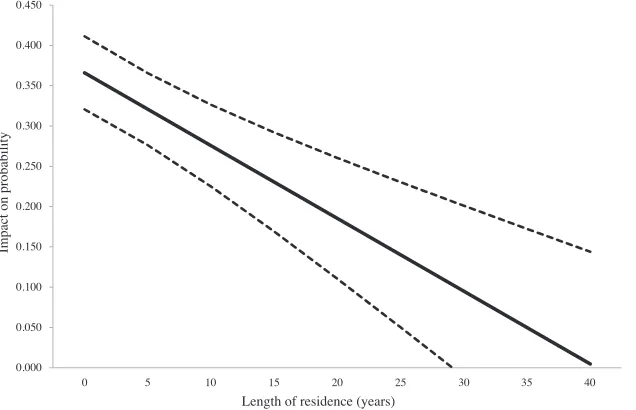
The interaction term between length of residence and the Caesarean section rate from the home country is negative (Table 3, Column 3). This implies that the impact of the Caesarean section rate in the home country decreases with number of years the immigrants have lived in Norway. The home country effect is 0.366 for a newcomer, which is marginally higher than the average effect of 0.336. Figure 1 shows how the probability of Caesarean section varies with length of residence in Norway. The downward sloping line suggests that the practice in the home country fades away after about 40 years.
B. The Infl uence of the Cultural Values of the Home Country
We present the additional analyses based on the data from the WVS in Table 3, Column 2. The estimate for the index that measures freedom of choice and control in the immigrants’ home country is 0.015. This implies that a one- point increase in the index value causes a 1.5 percent increase in the Caesarean section rate in Norway.
Similar to the previous analysis, we included an interaction term that captured length of residence in Norway (Table 3, Column 4). The estimates suggest that the effects of the home country gradually fade in proportion to length of residence (Fig-ure 1). The effect for a newly arrived immigrant is 0.020. The effect of the cultural values of the home country appears to disappear after 25–30 years.
C. Supplementary Analyses
All the variables measuring the medical risk factors of the mother and the baby had strong and statistically signifi cant effects on infant mortality and Apgar score
(coef-fi cients not reported), while the Caesarean section rate in the home country had no statistically signifi cant effects (Table 3, Columns 5–7). Similar analyses with the index measuring freedom of choice and control yield the same results (not reported). This is an important fi nding, as it indicates that the preference variable is not correlated with unmeasured health risks.
Grytten, Skau, and Sørensen 161
0.000 0.050 0.100 0.150 0.200 0.250 0.300 0.350 0.400 0.450
Impact on probability
Length of residence (years)
Impact of the Caesarean section rate from the mother’s home country on the probability of a Caesarean section in Norway
0 5 10 15 20 25 30 35 40
0.000 0.005 0.010 0.015 0.020 0.025 0.030 0.035
0 5 10 15 20 25 30 35 40
Impact on probability
Length of residence (years)
Impact of the index measuring freedom of choice and control on the probability of a Caesarean section in Norway
Figure 1
The Estimated Effect on the Probability for a Caesarean Section for Immigrants according to Length of Residence in Norway.
an Re
sourc
es
Dependent variables
The probability of having an elective Caesarean section
The probability of having an emergency Caesarean section
Independent variables 1 2 3 4
Immigrant mothers’ preferences for Caesarean section
The Caesarean section rate for the mother’s home country
0.051* 0.022
(0.025) (0.036)
Freedom of choice and controla 0.013* 0.009
(0.004) (0.006)
Number of observations 540,697 166,917 560,242 172,833
Notes: The following fi xed effects were included in all analyses: Maternity unit and year
Whether the mother is an immigrant or not
Mother’s age and parents’ highest level of education (university/college education, upper secondary school education, reference category: compulsory school education) Predisposing factors of the mother: asthma, diabetes, epilepsy, heart disease, chronic hypertension, chronic kidney failure, rheumatoid arthritis, preeclampsia, bleeding during pregnancy
Characteristics of the birth: birthweight ≥ 2,500g, abnormal presentation, single baby birth * p< 0.05
Grytten, Skau, and Sørensen 163
measuring freedom of choice and control is about one and a half times higher for elec-tive than for emergency Caesarean sections (Table 4, Columns 2 and 4).
The regression coeffi cient for the mean rate of Caesarean section in the home coun-try from the year the mother arrived in Norway and until she gave birth is 0.339 (Table 5). This is nearly identical to the coeffi cient for our main analysis in which we used the rate for the home country for the year the mother gave birth in Norway (Tables 3 and 5). The coeffi cient for the Caesarean section rate in the home country from the year the mother arrived in Norway is only slightly higher: 0.351 (Table 5).
The exclusion of China and Iran from the material did not lead to signifi cant changes in the results—the coeffi cient for the Caesarean section rate in home country was 0.362 when China and Iran were excluded (Table 5). The sign and the size of the coeffi cients for the effect of the preference variable only changed marginally when the education variables were excluded (Table 5).
V. Discussion
Our results indicate that immigrant mothers bring their preferences about mode of delivery with them to their new country, and that they have their prefer-ences for mode of delivery met in Norway. This is a consistent fi nding, irrespective of whether preferences were measured using the rate of Caesarean section in the home country, or using the index that measured freedom of choice and control. Furthermore, the effect decreased with length of residence in Norway, and the effect was higher for elective than for emergency Caesarean sections.
an Re
sourc
es
Independent variables
Number of observations
The probability of having a Caesarean section in Norway
The Caesarean section rate for the mother’s home country measured at different times
The year the mother gave birth in Norway (as reported in Table 3) 1,965,939 0.336* (0.022) The mean Caesarean section rate from the year the mother arrived and
until she gave birth in Norway
1,974,601 0.339*
(0.022) The year the mother arrived in Norway 1,946,488 0.351* (0.023) Exclusion of Iran and China from the sample 1,963,402 0.362* (0.023) The variable measuring the parents’ education excluded from the analysis 1,979,554 0.313* (0.021)
Notes: The following fi xed effects were included in all analyses: Maternity unit and year
Whether the mother is an immigrant or not
Mother’s age and parents’ highest level of education (university/college education, upper secondary school education, reference category: compulsory school education) Predisposing factors of the mother: asthma, diabetes, epilepsy, heart disease, chronic hypertension, chronic kidney failure, rheumatoid arthritis, preeclampsia, bleeding during pregnancy
Grytten, Skau, and Sørensen 165
are correlated with preferences. If that had been the case, we would have expected the preference variable to have signifi cant effects on infant mortality and Apgar score.
One factor to consider is whether the rate of Caesarean section from each country is reliable and representative. We believe this to be the case for most countries. The reason is that nearly all data are based on national fi gures, which cover the entire population, or surveys, designed to be representative of the population. We also have run separate analyses excluding countries for which the data may not be representa-tive. After Iran and China were excluded, most of the mothers were from countries where there is little uncertainty about the Caesarean section rates (Western Europe, North America, Oceania and partly South America) (Table 1). Because the indicators for immigrant preferences are based on country- level aggregated data, causal effects may be somewhat underestimated (attenuation bias).
The current study has been carried out on a population in which neither the moth-ers nor the obstetricians had economic incentives that could infl uence their choice of mode of delivery. Caution must be used in generalizing the fi ndings to other countries where maternity care is organized differently. This applies particularly to countries where many births take place in private clinics, where obstetricians are remunerated on a fee- for- service basis and where mothers have private insurance for deliveries. For example, if obstetricians are remunerated on a fee- for- service basis, there can be an incentive to carry out a Caesarean section rather than a normal delivery (for a review see: Keeler and Brodie 1993). This is supported by studies that have shown that doctors carry out more Caesarean sections when a Caesarean delivery provides more income than a normal delivery (Gruber, Kim, and Mayzlin 1999; Stafford 1990). Private insurance systems are often designed to allow mothers’ preferences to infl u-ence mode of delivery. The effect of mothers’ preferu-ences in a public healthcare sys-tem is remarkable.
In conclusion, we fi nd that preferences matter. In magnitude, the effect is smaller than the effects of medical risk factors. For example, a 20 percent increase in Caesar-ean section rate from the county of origin implies an increase in CaesarCaesar-ean sections in Norway of 6.7 percent. In comparison, the estimated Caesarean section rate is 13 percent higher for mothers who are 40 years and older as compared to mothers aged 20–30 years. Further, if the mother has preeclampsia, the Caesarean section rate in-creases by 17 percent. For a low birth weight baby (< 2,500g) the Caesarean section rate increases by 19 percent compared to an infant with normal weight. Our fi ndings appear to be robust—the results are fairly similar independent of the way we measured preferences. The effect of preferences decreases with length of residence in Norway and the effect is stronger for elective than for emergency Caesarean sections. Reversed causality is unlikely, and a large number of medical risk factors are uncorrelated with preferences. Patient preferences may play an even greater role in private healthcare systems than in the current setting based on state regulation and public fi nancing.
References
Betrán, Ana P., Mario Merialdi, Jeremy A. Lauer, Wang Bing- Shun, Jane Thomas, Paul Van Look, and Marsden Wagner. 2007. “Rates of Caesarean Section: Analysis of Global, Regional and National Estimates.” Paediatric and Perinatal Epidemiology 21(2):98–113. Baicker, Katherine, Kasey S. Buckles, and Amitabh Chandra. 2006. “Geographic Variation in
the Appropriate Use of Caesarean Delivery.” Health Affairs 25(5):w355–w367.
Blom, Svein, and Kristin Henriksen. 2008. “Levekår Blant Innvandrere i Norge 2005 / 2006.” Report 2008 / 5. Oslo / Kongsvinger: Statistics Norway, pp. 34–39.
Daugstad, Gunnlaug. 2007. “Fakta om Innvandrere og Deres Etterkommere.” Notat 2007 / 56. Oslo / Kongsvinger: Statistics Norway.
Gamble, Jenny A., and Debra K. Creedy. 2000. “Women’s Request for a Cesarean Section: a Critique of the Literature.” Birth 27(4):256–63.
Gortmaker, Steven L., and Paul H. Wise. 1997. “The First Unjustice: Socioeconomic Dispari-ties, Health Services Technology, and Infant Mortality.” Annual Review of Sociology 23:147–70.
Gregory, Kimberly D., Lisa M. Korst, Jeffrey A. Gornbein, and Lawrence D. Platt. 2002. “Using Administrative Data to Identify Indications for Elective Primary Cesarean Delivery.” Health Services Research 37(5):1387– 401.
Gruber, Jon, John Kim, and Dina Mayzlin. 1999. “Physician Fees and Procedure Intensity: the Case of Cesarean Delivery.” Journal of Health Economics 18(4):473–90.
Grytten, Jostein, Lars Monkerud, Terje P. Hagen, Rune Sørensen, Anne Eskild, and Irene Skau. 2011. “The Impact of Hospital Revenue on the Increase in Caesarean Sections in Norway. A Panel Data Analysis of Hospitals 1979–2005.” BMC Health Services Research 11(10):267. Grytten, Jostein, Lars Monkerud, and Rune Sørensen. 2012. “Adoption of Diagnostic
Technol-ogy and Variation in Caesarean Section Rates: a Test of the Practice Style Hypothesis in Norway.” Health Services Research 47(6):2169–89.
Grytten, Jostein, Irene Skau, and Rune Sørensen. 2011. “Do Expert Patients Get Better Treat-ment than Others? Agency Discrimination and Statistical Discrimination in Obstetrics.” Journal of Health Economics 30(1):163–80.
Habiba, Marwan, Monique Kaminski, Monica Da Frè, Karel Marsal, Otto Bleker, Julian Librero, Héléne Grandjean, Paul Gratia, Secondo Guaschino, Wolfgang Heyl, David Taylor, and Marina Cuttini. 2006. “Caesarean Section on Request: a Comparison of Obstetricians’ Attitudes in Eight European Countries.” BJOG An International Journal of Obstetrics and Gynaecology 113(6):647–56.
Hall, Marion H. 1987. “When a Woman Asks for a Caesarean Section.” British Medical Journal 294(6566):201.
Harris, Lisa H. 2001. “Counseling Women about Choice.” Best Practice & Research Clinical Obstetrics & Gynaecology 15(1):93–107.
Hemminki, Elina. 1997. “Cesarean Sections: Women’s Choice for Giving Birth?” Birth 24(2):124– 25.
Holtz, Sara A., and Cynthia K. Stanton. 2007. “Assessing the Quality of Cesarean Birth Data in the Demographic and Health Surveys.” Studies in Family Planning 38(1):47–54. Inglehart, Ronald, and Christian Welzel. 2010. “Changing Mass Priorities: the Link between
Modernization and Democracy.” Perspectives on Politics 8(2):551–67.
Grytten, Skau, and Sørensen 167
Jurdi, Rozzet, and Marwan Khawaja. 2004. “Caesarean Section Rates in the Arab Region: a Cross- National Study.” Health Policy and Planning 19(2):101–10.
Keeler, Emmet B., and Mollyann Brodie. 1993. “Economic Incentives in the Choice between Vaginal Delivery and Cesarean Section.” Milbank Quarterly 71(3):365–404.
Khawaja, Marwan, Nathalie Choueiry, and Rozzet Jurdi. 2009. “Hospital- Based Caesar-ean Section in the Arab Region: an Overview.”Eastern MediterranCaesar-ean Health Journal 15(2):458–69.
Kolås, Toril, Dag Hofoss, Anne K. Daltveit, Stein T. Nilsen, Tore Henriksen, Renate Häger, Ingemar Ingemarsson, and Pål Øian. 2003. “Indications for Cesarean Deliveries in Norway.” American Journal of Obstetrics and Gynecology 188(4):864–70.
Lavender, Tina, G. Justus Hofmeyr, James P. Neilson, Carol Kingdon, and Gillian M. L. Gyte. 2006. “Caesarean Section for NonMedical Reasons at Term (Review).” Cochrane Data base of Systematic Reviews, Issue 3. http: // www2.cochrane.org / reviews / en / ab004660.html (accessed July 11, 2011).
MacKenzie, Ian Z. 1999. “Should Women Who Elect to Have Caesarean Sections Pay for Them?” British Medical Journal 318(7190):1070.
McCourt, Chris, Jane Weaver, Helen Statham, Sarah Beake, Jenny Gamble, and Debra Creedy. 2007. “Elective Cesarean Section and Decision Making: a Critical Review of the Litera-ture.” Birth 34(1):65– 79.
Measure DHS. 2011. “Demographic and Health Surveys.” http: // measuredhs.com / (accessed July 11, 2011).
Ministry of Health. 2002. “Behovsbasert Finansiering av Spesialisthelsetjenesten.” Oslo: Ministry of Health.
Moini, Ashraf, Kiarash Riazi, A. Ebrahimi, and N. Ostovan. 2007. “Caesarean Section Rates in Teaching Hospitals of Tehran: 1999–2003.” Eastern Mediterranean Health Journal 13(2):457–60.
Notzon, Francis C., Paul J. Placek, and Selma M. Taffel. 1987. “Comparisons of National Cesarean Section Rates.” The New England Journal of Medicine 316(7): 386–89. OECD, 2010. “OECD Health Data 2010—Selected Data. Healthcare activities.” http: // stats
.oecd.org / index.aspx?queryid=350 (accessed July 11, 2011).
Paterson- Brown, Sara. 1998. “Controversies in Management. Should Doctors Perform an Elective Caesarean Section on Request? Yes, as Long as the Woman Is Fully Informed.” British Medical Journal 317(7156):462–65.
Shah, Archana, Anibal Faundes, M. Imunya Machoki, Vincente Bataglia, Faouzi Amokrane, Allan Donner, Kidza Mugerwa, Guillermo Carroli, Bukola Fawole, Ana Langer, Jean José Wolomby, Alberto Naravaez, Idi Nafi ou, Marius Kublickas, Eliette Valladares, Alejandro Velasco, Nelly Zavaleta, Isilda Neves, and José Villar. 2008. “Methodological Consider-ations in Implementing the WHO Global Survey for Monitoring Maternal and Perinatal Health.” Bulletin of the World Health Organization 86(2):126–31.
Shearer, Elizabeth Conner. 1983. “How Do Parents Really Feel after Cesarean Birth?” Birth 10(2):91–92.
Stafford, Randall S. 1990. “Cesarean Section Use and Source of Payment: an Analysis of Cali-fornia Hospital Discharge Abstracts.” American Journal of Public Health 80(3): 313– 15. Stanton, Cynthia K., Dominique Dubourg, Vincent De Brouwere, Mar Pujades, and Carine
Ronsmans. 2005. “Reliability of Data on Caesarean Sections in Developing Countries.” Bulletin of the World Health Organization 83(6):449–55.
Stanton, Cynthia K., Sara A. Holtz, 2006. “Levels and Trends in Cesarean Birth in the Devel-oping World.” Studies in Family Planning 37(1):41–48.
Statistics Norway. 2000. “Norwegian Standard Classifi cation of Education. Revised 2000.” Oslo / Kongsvinger: Statistics Norway.
Paediatric and Perinatal Epidemiology 7(1):45–54.
Tranquilli, Andrea Luigi, and Giuseppe Gioele Garzetti. 1997. “A New Ethical and Clinical Dilemma in Obstetric Pratice: Cesarean Section ‘on Maternal Request’.” American Journal of Obstetrics and Gynecology 177(1):245–46.
Wagner, Marsden. 2000. “Choosing Caesarean Section.” Lancet 356(9242):1677–80. Wax, Joseph R., Angelina Cartin, Michael G. Pinette, and Jacquelyn Blackstone. 2004.
“Pa-tient Choice Cesarean: an Eevidence- Based Review.” Obstetrical and Gynecological Survey 59(8):601–16.
Welzel, Christian, Ronald Inglehart, and Hans- Dieter Klingemann. 2003. “The Theory of Human Development: a Cross- Cultural Analysis.” European Journal of Political Research 42(3):341– 79.
World Health Organization. 2011a. “European Health for All Data base (HFA- DB).” http: // www.euro.who.int / en / what- we- do / data- and- evidence / data bases / european- health- for - all- data base- hfa- db2 (accessed July 11, 2011).
———. 2011b. “Making Pregnancy Safer. WHO Global Survey on Maternal and Perinatal Health Observatory (GHO).” http: // www.who.int / making_pregnancy_safer / health _systems / global_survey / en / index.html (accessed July 11, 2011).