Lampiran 1
DAFTAR SAMPEL PENELITIAN
No
Kabupaten/Kota
Lampiran 2
REKAPITULASI KEUANGAN DAERAH
KABUPATEN DAN KOTA DI PROVINSI SUMATERA SELATAN
2009-2012
No Tahun Kabupaten/Kota DBH Pajak DBH Bukan Pajak
DAU Belanja Modal
1 2009 Kab. Banyuasin 122294.5 85481.58 441349.8 198,522,419
2 Kab. Empat
Lawang
23225.17 71407.37 190021.4 138.720741
3 Kab. Lahat 83455.62 117075.1 355790.4 120,213,819
4 Kab.Musi
Banyuasin
231516.4 747496.6 86730.98 527,050,530
5 Kab. Ogan
Komering Ilir
64052.7 71481.51 533734.4 192,740,750
6 Kab. Ogan
Komering Ulu(OKU)
63631.69 71481.61 304457.6 108,920,858
7 Kab. OKU Timur 29436.06 71441.32 361075.6 77,380,866 8 Kab. OKU Selatan 25961.49 71441.43 253291.2 202,290,806
9 Kota Palembang 137922 71711.24 689108.6 209,303,087
No Tahun Kabupaten/Kota DBH Pajak DBH Bukan Pajak
DAU Belanja Modal
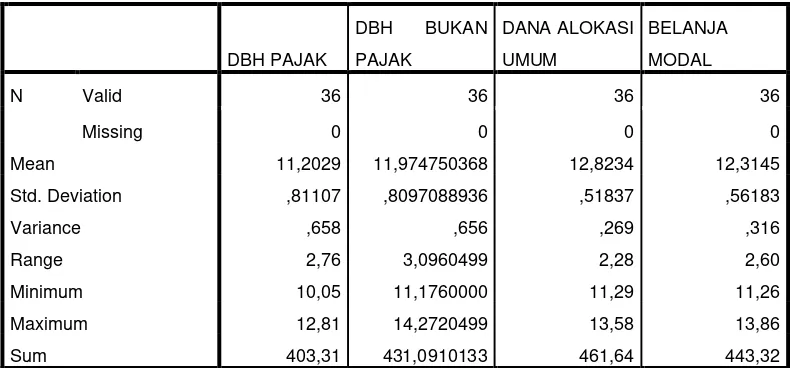
Lampiran 3
Tabel Statistik Deskriptif
Descriptive Statistics
DBH PAJAK
DBH BUKAN
PAJAK
DANA ALOKASI
UMUM
BELANJA
MODAL
N Valid 36 36 36 36
Missing 0 0 0 0
Mean 11,2029 11,974750368 12,8234 12,3145
Std. Deviation ,81107 ,8097088936 ,51837 ,56183
Variance ,658 ,656 ,269 ,316
Range 2,76 3,0960499 2,28 2,60
Minimum 10,05 11,1760000 11,29 11,26
Maximum 12,81 14,2720499 13,58 13,86
Lampiran 4
Hasil Uji Normalitas
Tabel Kolmogorov-Smirnov
One-Sample Kolmogorov-Smirnov Test
Unstandardized
Residual
N 36
Normal Parametersa,b Mean ,0000000 Std. Deviation ,33494981
Most Extreme Differences Absolute ,102
Positive ,102
Negative -,094
Kolmogorov-Smirnov Z ,614
Asymp. Sig. (2-tailed) ,846
a. Test distribution is Normal.
Lampiran 5
Correlations
DBH PAJAK Correlation
Coefficient
Ares Correlation
Coefficient
,037 -,269 ,087 1,000
Sig. (2-tailed) ,832 ,113 ,614 .
Lampiran 6
Hasil Uji Autokorelasi
Model Summaryb
Model R R Square
Adjusted R
Square
Std. Error of the
Estimate Durbin-Watson
1 ,762a ,581 ,533 ,45733 2,075
a. Predictors: (Constant), Dana Alokasi Umum, DBH Pajak, DBH Bukan Pajak
b. Dependent Variable: Belanja Modal
Lampiran 7
Hasil Uji Multikolinearitas
Coefficientsa
Model
Unstandardized
Coefficients
Standardized
Coefficients
T Sig.
Collinearity
Statistics
B Std. Error Beta Tolerance VIF
1 (Constant) 3,109 1,884 1,650 ,109
DBH PAJAK ,056 ,086 ,081 ,658 ,515 ,729 1,372
DBH BUKAN
PAJAK
,534 ,087 ,770 6,136 ,000 ,705 1,419
DANA ALOKASI
UMUM
,170 ,117 ,157 1,449 ,157 ,952 1,050
a. Dependent Variable: BELANJA MODAL
Lampiran 8
Hasil Uji Signifikansi Simultan ( Uji--F)
ANOVAb
Model Sum of Squares Df Mean Square F Sig.
1 Regression 7,121 3 2,374 19,344 ,000a
Residual 3,927 32 ,123
Total 11,048 35
a. Predictors: (Constant), DANA ALOKASI UMUM, DBH PAJAK, DBH BUKAN PAJAK
b. Dependent Variable: BELANJA MODAL
Lampiran 9
Hasil Uji Signifikansi Parsial (Uji-t)
Coefficientsa
Model
Unstandardized
Coefficients
Standardized
Coefficients
t Sig.
Collinearity
Statistics
B Std. Error Beta Tolerance VIF
1 (Constant) 3,109 1,884 1,650 ,109
DBH PAJAK ,056 ,086 ,081 ,658 ,515 ,729 1,372
DBH BUKAN
PAJAK
,534 ,087 ,770 6,136 ,000 ,705 1,419
DANA ALOKASI
UMUM
,170 ,117 ,157 1,449 ,157 ,952 1,050
a. Dependent Variable: BELANJA MODAL