Gadjah Mada International Journal of Business Vol. 17, No. 2 (May-August 2015): 179-198
The Combined Effects of Financial Derivatives and
Discretionary Accruals on the Value Relevance of
Earnings and the Book Value of Equity
Etty Murwaningsari,
a*Sidharta Utama,
band
Hilda Rossieta
b aFaculty of Economics, Universitas Trisakti, IndonesiabFaculty of Economics, University of Indonesia, Indonesia
Abstract: This study aimed to understand (1) the association between the use of discretionary accruals and financial derivatives, taking into consideration the implementation of revised PSAK 55 (1999), which was adopted from SFAS 133; (2) the combined effects of derivatives and discretionary accruals on the value relevance of earnings and equity. The analysis used panel data regressions and the Wald test over the period from 2001-2008. The results showed a positive or complementary association between deriva-tives and discretionary accruals. The positive association implied that managers tended to intensify the use of discretionary accruals to offset a higher use of derivatives. Price and return models demonstrated negative significant effects of derivatives on the value relevance of earnings. The return model showed negative significant effects of discretionary accruals on the value relevance of earnings but negative effects on the value relevance of equity with the price model.
Abstrak: Tujuan penelitian untuk mengetahui (1) hubungan penggunaan derivatif keuangan setelah implementasi PSAK 55 (1999) yang diadopsi dari SFAS 133 terhadap penggunaan discretionary accruals; (2) pengaruh derivatif dan discretionary accrual terhadap relevansi nilai dari laba dan ekuitas. Analisis menggunakan regresi panel data dan uji Wald, periode tahun 2001-2008. Hasil penelitian menunjukkan derivatif dan discretionary accrual memiliki hubungan positif atau komplementer. Pengaruh derivatif terhadap relevansi nilai laba menggunakan model harga dan return menunjukkan arah negatif, namun tidak ada pengaruh terhadap relevansi nilai ekuitas. Pengaruh discretionary accruals terhadap relevansi nilai laba menggunakan model return menunjukkan arah negatip dan model harga menunjukkan arah negatif terhadap relevansi nilai ekuitas.
Keywords: discretionary accruals; financial derivatives; the value relevance of earnings; the value relevance of equity
Introduction
This study extends Barton (2001). His study was conducted during 1994-1996 – a period before the implementation of the Statement of Financial Accounting Standards (SFAS 133) on Accounting for Derivative Instruments and Hedging Activities. Barton (2001) showed a negative and substitutive relationship between financial derivatives and discretionary accruals. This implied that managers decreased the use of discretionary accruals to offset the higher use of deriva-tives, which suggested the adoption of hedg-ing activities by firms. Barton’s study (2001) wasfurther verified in a study conducted in Indonesia using data from 2001-2008 –a pe-riod when SFAS 133 was active, having been adopted by the Indonesian Statement of Fi-nancial Accounting Standards (PSAK 55/ 1999)– with different findings from that found by Barton (2001). In this case, the as-sociation between financial derivatives and discretionary accruals was positive or comple-mentary, which suggested a higher use of dis-cretionary accruals by managers to offset the effects of the higher use of derivatives and showed that firms were engaged in specula-tive activities and hedging that was noncompliant with PSAK 55 (1999).
According to Bank Indonesia’s Indone-sian Banking Accounting Guideline/PAPI (2008: 229), financial derivatives are used for the following purposes: (1) trading/specula-tive activities. Derivatrading/specula-tives transactions for trading purposes fall into the category of fair value through profit and loss: (2) hedging against certain risks, which is defined as fol-lows: (a) if derivatives transactions that are specifically used to manage the risks of the relationship between derivatives instruments and hedged items meet certain criteria, then hedging accounting can be implemented: (b)
if derivatives transactions that are used for hedging do not meet the hedging accounting criteria required by the PSAK, then the de-rivatives transactions are treated in a similar fashion to those for trading purposes.
to earnings volatility that was higher than hedging activities (Aabo 2007). The market, which prefers low earnings volatility, pays little attention to stock prices (Graham et al. 2005), and this leads to earnings management by managers.
The above situation was worsened by the use of speculative activities in subprime mortgage schemes in the United States in mid-2007 which eventually led the nation to a fi-nancial crisis. Indonesia faced a similar situa-tion. An analysis of the notes to the financial statements of public firms during the sample period shows that 54.2 percent of firms re-ported losses from financial derivatives. This would increase the probability of financial distress and debt contract violations (Asquith et al. 2005). Hence, the use of speculative actions, characterized by high earning vola-tility will hinder the value relevance of earn-ings.
Beaver (1998) suggested that account-ing numbers were value-relevant when they were associated with the market value of equity. Therefore, accounting information was value-relevant if the stock price move-ment was associated with the disclosed in-formation. Prior research suggested that ac-counting information played a role in deter-mining the equity values of both an income statement and a balance sheet (Collins and Kothari 1989 ). Accounting information as-sociated with earnings management can be gathered through artificial smoothing, such as abnormal accruals, or through real smoothing, such as financial derivatives (Barton 2001; Moffit 2001; Pincus and Rajgopal 2002). This study, therefore, aimed to extend the use of derivatives and discre-tionary accruals as variables that increase or decrease the value relevance of earnings and equity. As we were aware, no available litera-ture on the value relevance of earnings and
equity book value discussed the difference between the effects of financial derivatives and discretionary accruals on the value rel-evance of earnings and equity book value. Prior research, such as Huang et al. (2008), only discussed the effects of financial deriva-tives and discretionary accruals on the mar-ket value. In Huang et al. (2008), for instance, they maintained that the market value de-creased in proportion to the use of abnormal accruals and increased in proportion to the use of derivatives.
Literature Review and
Hypothesis Development
The Relationship between
Financial Derivatives and
Discretionary Accruals
Barton (2001) noted that earnings were the sum of cash flows. This suggests that an earnings variance is the function of cash flows and accrual variances, with the relationship between cash flows and accruals being as
Managers can therefore manage earn-ings volatility by adjusting cash flows and accrual volatility. Barton (2001) suggested that the relationship between financial deriva-tives and discretionary accruals was likely to be substitutional or complementary. The first argument suggested that derivatives with hedging would decrease the volatility of earn-ings. Thus, the discretionary accruals could be substituted by the use of hedging. In this sense, an increase in the use of financial de-rivatives will decrease discretionary accruals. Meanwhile, the second argument suggested that financial derivatives with speculative actions would increase the volatility of earn-ings. Thus, the discretionary accruals were still needed for income smoothing. Discretionary accrual cannot be replaced by financial de-rivatives, because they complement each other. In this sense, an increase in the use of financial derivatives will be followed by an increase in the discretionary accrual.
Findings by Barton (2001), which used the pre-SFAS-113 1994-1996 data, showed that a substitution relationship existed be-tween financial derivatives and discretionary accruals. The findings find support in Moffitt (2001) and Pincus and Rajgopal (2002). In the later part of his study, Barton (2001) pre-dicted that the implementation of SFAS 133, which was adopted as PSAK 55(1999) in In-donesia, would lead to a more transparent use of derivatives; hence, it would increase costs of reporting. The cost-inefficient criteria in-cludes skillful human resources, up-to-date technologies, and completeness of documents (e.g. assessment of the effectiveness of hedg-ing). This stems from the fact that the crite-ria of financial derivatives reporting for hedg-ing purposes could not be met. Therefore, 150 firms disclosed their hedgings that were noncompliant with PSAK 55 (1999), where unrealized gains/losses were reported in the current year’s income statements, as if they were speculative activities. This gave rise to earnings volatility that was higher than hedg-ing activities (Aabo 2007). Managers step up the use of discretionary accruals to limit an increase in earnings volatility on account of a higher use of speculatives. Based on the argument above, the proposed hypothesis is as follows:
Hypothesis 1 (H1): the use of derivatives is posi-tively associated with discretion-ary accruals.
The Effects of the Use of Financial Derivatives on the Value Relevance of Earnings and the Book Value of Equity
accru-als. The use of financial derivatives entails market risks, such as exchange rate and in-terest rate risks. Market risks, also known as systematic risks or stock’s beta, are non-diversifiable risks (Djohanputro 2008). Sys-tematic risks are negatively associated with the Earnings Response Coefficient, which is the relationship between stock prices and earnings. This suggests that the higher (lower) the risks of an entity the lower (higher) the value relevance of earnings (Collins and Kothari 1989; Kothari and Zimmerman 1995). The use of speculatives, hence, de-creases the value relevance of earnings.
Meanwhile, highly risky earnings vola-tility is likely to give rise to financial distress or violation of debt contracts (Asquith et al. 2005). Barth et al. (1998) noted that a finan-cially less healthy entity or an entity with high volatility gave more importance to cash flows and lower importance to income statements. For that reason, the use of speculatives that give rise to market risks and financial distress decreases the value relevance of earnings and increases the value relevance of equity, as investors transfer to equity (Collins and Kothari 1989; Barth et al. 1998). Accord-ingly, the proposed hypotheses are as follows:
Hypothesis 2.1 (H2.1): the use of derivatives is nega-tively associated with value relevance of earnings Hypothesis 2.2 (H2.2): the use of derivatives is
posi-tively associated with value relevance of equity.
The Effects of Discretionary Accruals on the Value Relevance of Earnings and the Book Value of Equity
Prior studies byWhelan and McNamara (2004) as well as Wiedman and Marquardt (2004) argued that earnings management, as
reflected by high discretionary accruals served as an indicator of low earnings reli-ability (Richardson et al. 2004). Less reliable earnings would drive the market to reduce its reliance on earnings in determining a firm’s value and turn to equity (Burgstahler and Dichev 1997). Consequently, when an entity is engaged in discretionary accruals, the mar-ket is expected to reduce its reliance on earn-ings information in determining a firm’s value, while giving more importance to the book value of equity in communicating stock prices. In contrast, Subramanyam (1996) noted that earnings management was driven by a motivation to efficiently communicate private information about future economic potentials which cannot be accommodated by applicable accounting standards.
Hence, when discretionary accruals are perceived as a credible signal, earnings reli-ability will increase (Subramanyam 1996), which in turn will strengthen the value rel-evance of earnings. On the other hand, less reliable earnings will occur from the use of opportunistic discretionary accruals, which then will reduce the value relevance of earn-ings (Whelan and McNamara 2004). Further-more, when the reliability of earnings (equity book value) is low, the reliability of equity book value (earnings) is high (Burgstahler and Dichev 1997). Accordingly, discretionary ac-cruals or derivatives have positive or nega-tive effects on the value relevance of earn-ings and equity. The proposed hypotheses, thus, are as follows:
Hypothesis 3.1 (H3.1): discretionary accruals are associated with the value relevance of earnings. Hypothesis 3.2 (H3.2): discretionary accruals are
The Contrasting Relationship between Financial Derivatives and Discretionary Accruals with the Value Relevance of Earnings and Equity Book Value
Since earnings consist of components of accruals and cash flows, one needs both components to be able to conduct earnings management. Although both cash flows and accruals will end up as earnings, their effects on the quality of earnings are different. The quality of earnings increases when cash flows increase or accruals decrease (Sloan 1996). Furthermore, Lev and Zarowin (1999) stated that information in accrued earnings had a lower quality compared to information in cash flows. The reason is that accrued earn-ings give more discretion opportunities to the management, indicating low accuracy, valid-ity, and reliability. Consequently, markets will react more strongly to information on earn-ings that comes from cash flows rather than from accruals. On the other hand, informa-tion on cash flows is considered as real earn-ings management, which also includes the use of derivatives. If the use of derivatives leads to an unrealized gain or loss, firms will then recognize them in the equity account. Hence, financial derivatives should have a stronger (weaker) effect than the discretionary accru-als on the value relevance of equity (earn-ings). This argument is based on Whelan and McNamara (2004) as well as Wiedman and Marquardt (2004). They showed that when the reliability of earnings (equity book value) was low, then the reliability of equity book value (earnings) was high. The proposed hy-potheses, thus, are as follows:
Hypothesis 4.1 (H4.1): the use of financial deriva-tives has weaker effects on the value relevance of earnings compared to the use of dis-cretionary accruals
Hypothesis 4.2 (H4.2): the use of financial deriva-tives has stronger effects on the value relevance of equity com-pared to the use of discretion-ary accruals.
Methods
Sample Selection
The research population was all firms that conducted financial derivatives transac-tions and listed their stocks on the Indone-sian Stock Exchange over the period of 2001-2008, which produced 350 observations. However, 20 observations from the 2001-2008 financial statements were not available and therefore were excluded, thus reducing the number to 330. This figure was further reduced to 199 as 131 derivative users had not been actively engaged in derivative trans-actions. The sample excluded 78 banks and non financial institutions due to differences in the accounting practices of specific indus-tries and the use of financial derivatives as stipulated in a special regulation. Moreover, the model used to measure the amount of discretionary accruals in the financial indus-try differs from that used in other industries.
Variables and Measurement
the effects of firms’ performance on accru-als. The measurement is as Equation 2.
Total Accrual
Earnings per Share (EPS) were mea-sured using earnings before extraordinary items deflated by outstanding shares (Whelan and McNamara 2004). Furthermore, the Book Value of Equity per share (EBV) was measured by the total equity divided by the
outstanding shares (Whelan and McNamara
2004), while Derivatives (DERIV) were mea-sured by the notional amount of foreign ex-change derivatives scaled by lagged total as-sets (Barton 2001; Moffitt 2001; Pincus and Rajgopal 2002). A notional amount is an amount in a unit of currency, shares and/or other units stipulated in an agreement (PSAK 55/1999). In this study, Information Asym-metry (IA) was proxied by a bid-ask spread using an eleven-day event window -five days before (-5) and five days after (5+) an ac-counting earnings reporting date (Brown and Warner 1985). A long event window was not preferable because of concern over its po-tential accumulated effects on earnings. Lee
(1993) suggested that the combination of a bid-ask spread and market depth data could signal potential information asymmetry prior to an earnings announcement. Therefore, the information asymmetry of firm i at day t was proxied by ADJSPREADi,t or Residual Spread (i,t), with the Equation 3:
SPREADi,t= [(aski,t – bidi,t)/
{(aski,t + bidi,t)/2}] x 100% ... (3) where, SPREADi,t= spread between ask and bid divided by the amount of ask and bid di-vided by two; ASKi,t= highest ask price of return level over the observation period of firm i’s shares on day t; TRANSi,t= amount of share transactions of firm i, on day t in each event window; DEPTHi,t= an average amount of shares of firm i on all quotes (an available amount during “ask” added by that during “bid” divided by two) in every day t in event windows; ADJSPREADi,t(i,t)=
re-sidual errors used as the adjusted measure of SPREAD and used as the proxy of informa-tion asymmetry for firm i day t.
variables were as follow, (1) capital structure (CS) was measured by the total debt to total asset ratio (Watts and Zimmerman 1986); (2) growth opportunity (GO) was measured by the ratio of market capitalization (closing price multiplied by outstanding shares) to book value of equity (Collins and Kothari 1989); (3) quality of auditor (QA) proxy em-ployed the measurement of a public accoun-tant office, which used a dummy, 1= big four, and 0= non-big four; (4) firm size (SIZE) was measured by the natural logarithm of total assets.
Selection Models
Gujarati (2003) stated that the use of Ordinary Least Squares (OLS) would result in an inconsistent and biased estimation in an estimation model that had several equa-tions interdependent with each other. Accord-ing to Greene (2003), the steps to determine the suitable model were as follows: (1) to test between pooled OLS and a fixed effect model, one should test the correlation be-tween the cross-section specific effect and the dependent variable using the F-test and the Chi-Square test. If a correlation existed, then pooled OLS was inconsistent, hence use the fixed effect model; (2) to test between the fixed effect and random effect models, one could use the Hausmann specification test, which tests the correlation between unob-served individual random effects and a de-pendent variable. If the null hypothesis was rejected, then the random effect model was inconsistent, hence use the fixed effect model.
Research Models
Model for H1
The relationship between financial de-rivatives and discretionary accruals is shown by the Equation 5.
DACit=0 + 1DERIVit + 2CSit + 3GOit
+ 4IAit + 5DACit-1 + 6DPRit +
7QAit + 8DERIV*
Dspeculation + 9Dspeculation +
it
...(5)
The first sensitivity test, was conducted by comparing the effects of financial derivatives on discretionary accruals using the dividend payout ratio measured without negative pre-managed earnings. The dividend payout ra-tio with negative pre-managed earnings showed that there were more discretionary accruals than cash flows in the firms’ earn-ings. This is consistent with Sun and Rath (2010) who found that managers used earn-ings management to boost earnearn-ings when pre-managed earnings were below zero. The sec-ond sensitivity test, namely a classification test, was conducted to support the hypothesis test. According to the notes in the financial state-ments, derivatives could be categorized based on the derivatives motive as follows: (a) nine derivatives were reported as speculative; (b) 150 derivatives were reported as hedging, which were noncompliant with PSAK 55 (1999); (c) 40 derivatives were reported as hedging transactions, that were compliant with PSAK 55 (1999). Hence, the test used a dummy variable as follows: Dspeculation= 1, if the disclosure of the notes to the finan-cial statements were speculative and hedg-ing that was noncompliant with PSAK 55 (1999); 0, if the disclosure of the notes to the financial statements was hedging.
Model for H2 and H3
showed the strengthening and weakening ef-fects of financial derivatives and discretion-ary accruals on the value relevance of earn-ings and equity. The first sensitivity test us-ing a cumulative abnormal return was con-ducted on the assumption that a price model may raise econometric concerns, even though the estimated slope coefficients of the price model is less biased than that of the return model. Moreover, Easton et al. (1998), who carried out a similar observation, suggested that a return specification be adopted. Ab-normal return is estimated using a 12-month event window from April in year t to March in year t+1 (Ali and Zarowin 1992). The sec-ond sensitivity test aimed to see whether the firms in the sample took certain corporate actions such as stock splits or dividend pay-ments, which logically could influence the magnitude and movement of stock prices. Hence, the variables were deflated by the number of outstanding shares, as suggested by prior studies, such as Easton et al. (1998). The model is as Equation 6 and Equation 7.
Pit = 0 + 1EPSit + 2EBVit + 3DERIVit+
4EPSit*DERIVit + 5EBVit*DERIVit
+ 6DACit + ã7EPSit*DACit +
8EBVit*DACit + 9SIZEit + 10CSit +
11GOit + it
…...…………...…(6)
CARit=ß0 + ß1ÄEPSit + ß2ÄEBVit + ß3DERIVit +
ß4EPSit*DERIVit + ß5ÄEBVit*ÄDERIVit
+ ß6DACit +ß7EPSit*DACit + ß8EBVit*DACit + ß9SIZEit + ß10CSit + ß11GOit
…...(7)
n
CARit=
ARiti=1
…...(7) where, ARit is the level of abnormal returns of individual firm i in month t; calculated using the equation: ARit= Rit-RMt (Rit= the level of individual actual returns of firm i in month t, calculated by the closing price of firm i in month t: (Pit-Pit-)/Pit-1; andRMt (Mar-ket return)= the level of mar(Mar-ket returns in month t, calculated by the equation: (IHSGt– IHSGt-1)/IHSGt-1 is the 1DX Composite In-dex).
Model for H4
The difference between the effects of financial derivatives and discretionary accru-als on the value relevance of earnings and equity.
The Wald test was used to test the dif-ference between coefficient estimates. The null hypothesis suggests that there was no difference in coefficients. Two sets of vari-ables were tested: (i) interaction varivari-ables between derivatives and earnings per share and interaction variables between discretion-ary accruals and earnings per share (4 and
7); and (ii) interaction variables between
de-rivatives and equity book value and interac-tion variables between discreinterac-tionary accru-als and equity book value (5 and 8):
Pit=0 + 1EPSit + 2EBVit + 3DERIVit +
4EPSit*DERIVit + 5EBVit*DERIVit
+ 6DACit + 7EPSit*DACit +
8EBVit*DACit + 9SIZEit + 10CSit +
11GOit + it
Results and Discussion
Descriptive Statistics and
Correlation Matrix
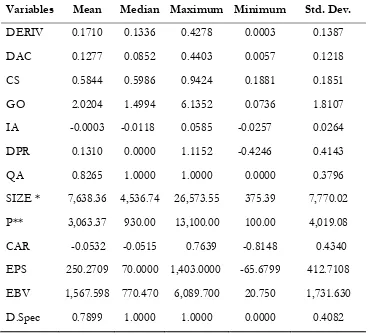
The descriptive statistics in Table 1 show that financial derivatives are bigger than average discretionary accruals; this implies a frequent use of derivatives by firms. Stan-dard deviation derivatives are slightly higher than discretionary accruals, which means that derivatives have dispersed variances. The
Dividend Payout Ratio has a minimum nega-tive score since there were 91 observations that contained negative pre-managed earn-ings. Negative pre-managed earnings show that the firms’ earnings have more discretion-ary accruals compared to cash flows (Sun and Rath 2010). Firm Size has a relatively high standard deviation, almost reaching the mean value, which indicates that the research sample contains various sizes of firms. Au-dit Quality indicates that 80 percent of firms using financial derivatives were audited by
Note: DERIV: derivatives; DAC: discretionary accruals;CS: capital structure; GO: growth opportunity; IA: information assymetry; DPR: dividend payout ratiowithout negative pre-managed earnings; QA: quality of audit; SIZE: firm’s size; P: stock prices; CAR: cumulative abnormal return; EPS: earning per share; EBV: equity book value; D.spec: Dspeculation. * in billions Rupiah. **in Rupiah
Table 1. Descriptive Statistics
Variables Mean Median Maximum Minimum Std. Dev.
DERIV 0.1710 0.1336 0.4278 0.0003 0.1387
DAC 0.1277 0.0852 0.4403 0.0057 0.1218
CS 0.5844 0.5986 0.9424 0.1881 0.1851
GO 2.0204 1.4994 6.1352 0.0736 1.8107
IA -0.0003 -0.0118 0.0585 -0.0257 0.0264
DPR 0.1310 0.0000 1.1152 -0.4246 0.4143
QA 0.8265 1.0000 1.0000 0.0000 0.3796
SIZE * 7,638.36 4,536.74 26,573.55 375.39 7,770.02
P** 3,063.37 930.00 13,100.00 100.00 4,019.08
CAR -0.0532 -0.0515 0.7639 -0.8148 0.4340
EPS 250.2709 70.0000 1,403.0000 -65.6799 412.7108
EBV 1,567.598 770.470 6,089.700 20.750 1,731.630
big-four public accounting firms. Standard deviations from stock prices in this research are higher than the average value, which in-dicates that stock price data in these variables have many variances. Dspeculation (D=1) shows speculative activities (nine observa-tions) and hedging that was noncompliant with PSAK 55/1999 (150 observations) is larger than D= 0, which shows hedging ac-tivities (40 observations ).
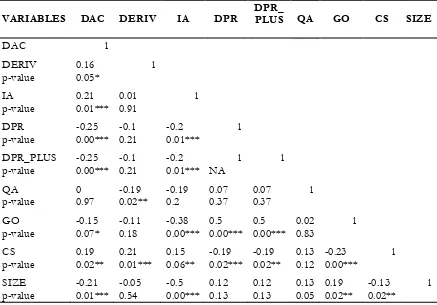
The correlation matrix, as shown in Table 2, reveals that derivatives (DERIV) and discretionary accruals (DAC) have a signifi-cant and positive correlation. This correla-tion suggests that the higher the derivatives the higher the discretionary accruals, or vice versa. In conclusion, a positive correlation between derivatives and discretionary accru-als is complementary in nature.
VARIABLES DAC DERIV IA DPR DPR_ PLUS QA GO CS SIZE
DAC 1
DERIV 0.16 1
p-value 0.05*
IA 0.21 0.01 1
p-value 0.01*** 0.91
DPR -0.25 -0.1 -0.2 1
p-value 0.00*** 0.21 0.01***
DPR_PLUS -0.25 -0.1 -0.2 1 1
p-value 0.00*** 0.21 0.01*** NA
QA 0 -0.19 -0.19 0.07 0.07 1
p-value 0.97 0.02** 0.2 0.37 0.37
GO -0.15 -0.11 -0.38 0.5 0.5 0.02 1
p-value 0.07* 0.18 0.00*** 0.00*** 0.00*** 0.83
CS 0.19 0.21 0.15 -0.19 -0.19 0.13 -0.23 1
p-value 0.02** 0.01*** 0.06** 0.02*** 0.02** 0.12 0.00***
SIZE -0.21 -0.05 -0.5 0.12 0.12 0.13 0.19 -0.13 1
p-value 0.01*** 0.54 0.00*** 0.13 0.13 0.05 0.02** 0.02**
Table 2. Correlation Matrix
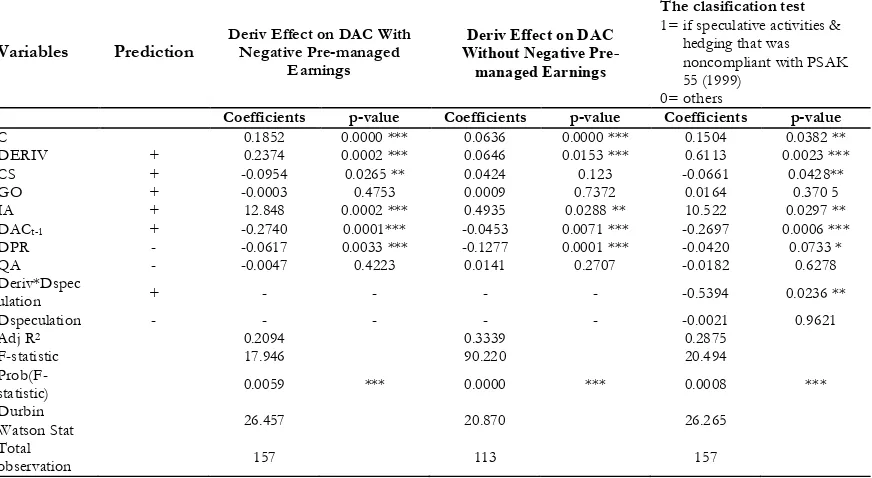
The Results of Hypothesis 1
Test results of the effects of financial derivatives on discretionary accruals using a dividend payout ratio with and without nega-tive pre-managed earnings showed that finan-cial derivatives were positively associated with discretionary accruals as predicted. The main objective of the classification test was to find out whether those engaged in hedging that were noncompliant with PSAK 55 (1999) tended to do so speculatively. Barton (2001) argued that derivatives had a nega-tive or substitution relationship with discre-tionary accruals, which meant derivatives served as a hedging transaction. Meanwhile,derivatives that had a positive or complemen-tary relationship with discretionary accruals served as speculative activities. Speculatives occured when both speculative and hedging actions that were noncompliant with PSAK 55(1999) had a positive relationship with dis-cretionary accruals. The results were as fol-lows: D= 0, if 1DERIVit (0.6113)=
posi-tive significant; andD= 1, if 1DERIVit
(0.6113) + 8DERIV*speculation (-0.5394)
= positive significant. This shows that there is a positive or complementary relationship between financial derivatives (speculative and hedging that was noncompliant with PSAK 55, 1999) and discretionary accruals. This test therefore supports H1.
Variables Prediction Deriv Effect on DAC With Negative Pre-managed Earnings
Deriv Effect on DAC Without Negative Pre-managed Earnings
The clasification test
1= if speculative activities & hedging that was noncompliant with PSAK 55 (1999)
0= others
Coefficients p-value Coefficients p-value Coefficients p-value
C 0.1852 0.0000 *** 0.0636 0.0000 *** 0.1504 0.0382 **
DERIV + 0.2374 0.0002 *** 0.0646 0.0153 *** 0.6113 0.0023 ***
CS + -0.0954 0.0265 ** 0.0424 0.123 -0.0661 0.0428**
GO + -0.0003 0.4753 0.0009 0.7372 0.0164 0.370 5
IA + 12.848 0.0002 *** 0.4935 0.0288 ** 10.522 0.0297 **
DACt-1 + -0.2740 0.0001*** -0.0453 0.0071 *** -0.2697 0.0006 ***
DPR - -0.0617 0.0033 *** -0.1277 0.0001 *** -0.0420 0.0733 *
QA - -0.0047 0.4223 0.0141 0.2707 -0.0182 0.6278
Deriv*Dspec
ulation + - - - - -0.5394 0.0236 **
Dspeculation - - - -0.0021 0.9621
Adj R2 0.2094 0.3339 0.2875
F-statistic 17.946 90.220 20.494
Prob(F-statistic) 0.0059 *** 0.0000 *** 0.0008 ***
Durbin
Watson Stat 26.457 20.870 26.265
Total
observation 157 113 157
Table 3. The Effects of Financial Derivatives on Discretionary Accruals using a Dividend Payout Ration measured with and without Negative Pre-managed Earnings
DACit = α0 + α1DERIVit + α2CSit+ α3GOit + α4IAit + α5 DAC t-1 + α6DPRit + α 8QAit + α8DERIV*Speculation + α 9DSpeculation + εit
***Significant at a level of 1 percent; **Significant at a level of 5 percent; *Significant at a level of 10 percent
The test on the control variables showed that capital structure had a negative and sig-nificant association. This suggested that a higher level of debt leads to lower discretion-ary accruals (Jelinek 2007). This is consis-tent with the agency theory (Jensen dan Meckling 1976) that stated that the larger debt ratio was, the larger the risk of debt cov-enant violation. Therefore, creditors mitigate the risk of debt covenant violation by moni-toring more closely managerial discretion for the reduction of discretionary accruals. Mean-while, prior-year discretionary accruals had negative and significant results. This sug-gested volatile earnings, which may result from speculative activities. The growth vari-able showed significant results, which may be explained by the already mature firms in the sample whose growth opportunities are no longer the dominant factor that affects their discretionary accruals, or they show high growth through means other than dis-cretionary accruals. Quality of Audit yielded insignificant results, which suggested that hiring big-four auditors did not necessarily cut down on the aggressive use of accrual earn-ings.
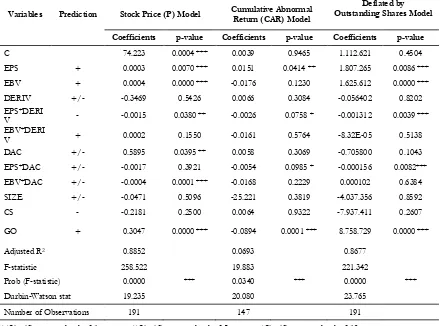
The Results of Hypotheses 2 and
3
The test for the effects of financial de-rivatives on the value relevance of earnings (EPS*DERIV) using the stock price, cumu-lative abnormal return, and deflated by shares outstanding as dependent variables models showed negative and significant results as predicted, while the effects of derivatives on the value relevance of equity (EBV*DERIV) showed insignificant results. Moreover, the tests on the effects of discretionary accruals on the value relevance of earnings (EPS*DAC) using cumulative abnormal re-turns and the deflated by outstanding shares model both showed as being negative and
sig-nificant. However, when using the price model, the effect is insignificant. The effects of discretionary accruals on the value rel-evance of equity book value (EBV*DAC) were significant and negative only in the price model which suggested that discretionary accruals weaken the value relevance of eq-uity.
The earnings per share showed positive and significant results, which were consistent across the three models. This suggests that the market believes that earnings per share is capable of providing information about firms’ operations. The book value of equity was positively and significantly associated as predicted. These findings showed that the market pays heed to earnings and book value of equity (Kothari and Zimmerman 1995; Feltham and Ohlson 1995). The book value of equity with cumulative abnormal return model showed insignificant results.
Variables Prediction Stock Price (P) Model Cumulative Abnormal Return (CAR) Model Outstanding Shares Model Deflated by
Coefficients p-value Coefficients p-value Coefficients p-value
C 74.223 0.0004 *** 0.0039 0.9465 1.112.621 0.4504
EPS + 0.0003 0.0070 *** 0.0151 0.0414 ** 1.807.265 0.0086 ***
EBV + 0.0004 0.0000 *** -0.0176 0.1230 1.625.612 0.0000 ***
DERIV +/- -0.3469 0.5426 0.0066 0.3084 -0.056402 0.8202
EPS*DERI
V - -0.0015 0.0380 ** -0.0026 0.0758 * -0.001312 0.0039 ***
EBV*DERI
V + 0.0002 0.1550 -0.0161 0.5764 -8.32E-05 0.5138
DAC +/- 0.5895 0.0395 ** 0.0058 0.3069 -0.705800 0.1043
EPS*DAC +/- -0.0017 0.3921 -0.0054 0.0985 * -0.000156 0.0082*** EBV*DAC +/- -0.0004 0.0001 *** -0.0168 0.2229 0.000102 0.6384
SIZE +/- -0.0471 0.5096 -25.221 0.3819 -4.037.356 0.8592
CS - -0.2181 0.2500 0.0064 0.9322 -7.937.411 0.2607
GO + 0.3047 0.0000 *** -0.0894 0.0001 *** 8.758.729 0.0000 ***
Adjusted R2 0.8852 0.0693 0.8677
F-statistic 258.522 19.883 221.342
Prob (F-statistic) 0.0000 *** 0.0340 *** 0.0000 ***
Durbin-Watson stat 19.235 20.080 23.765
Number of Observations 191 147 191
Table 4. The effects of Financial Derivatives and Discretionary Accruals on The Value Relevance of Earnings and Equity with Price (P), Cumulative Abnormal Re-turn (CAR), and deflated by outstanding shares model
Pit = γ0 + γ1EPSit + γ2EBVit + γ3DERIVit + γ4EPSit*DERIVit + γ5EBVit*DERIVit+ γ6 DACit + γ7EPSit* DACit + γ8EBVit*DACit + γ9SIZEit+γ10CSit+ γ11GOit+e it
CAR = ß0 + ß1ΔEPSit + ß2ΔEBVit + ß3ΔDERIVit + ß4ΔEPSit*ΔDERIVit + ß5ΔEBVit*ΔDERIVit + ß6ΔDACit +ß7ΔEPSit*ΔDACit + ß6ΔEBVit*ΔDACit + ß7ΔSIZEit + ß8ΔCSt + ß10ΔGOit
***Significant at a level of 1 percent; **Significant at a level of 5 percent; *Significant at a level of 10 percent
Note: CARit: Cumulative Abnormal Return of firm i in year t; EPS: Earning per Share; EBV: Equity Book Value; DERIV: Derivatives; EPS*DERIV: An interaction between EPS and DERIV; EPS*DAC: An interaction between EPS and discretionary accruals; DAC: Discretionary accruals; EPS*DAC : An interaction between EPS and DAC; EBV*DAC: An interaction between EBV and DAC; SIZE: Firm Size; CS: Capital Structure, GO: Growth Opportunity
Ultimately, the test of control variables on firm size showed insignificant results due to the easier availability of non-accounting information that enables the markets to in-terpret financial reports more accurately and reduces markets responses to firms’ earnings announcements. The Capital Structure
Test Results of Hypothesis 4
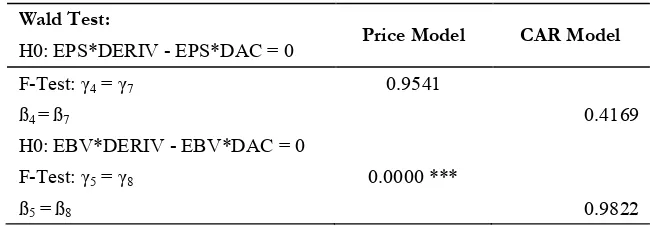
The test on H4.1 (Table 5) about the dif-ference between the effects of derivatives and discretionary accruals on the value rel-evance of earnings showed that both price and return models yielded insignificant re-sults, meaning there were no differences be-tween the effects of derivatives and discre-tionary accruals on the value relevance of earnings. The test result of H4.2 using the price model implied that EBV*DERIV-EBV*DAC> 0, meaning the coefficient of EBV*DERIV was significantly larger (differ-ent) than the coefficient of EBV*DAC. This implied that there was a difference between the effects of financial derivatives and dis-cretionary accruals on the value relevance of equity book value. Financial derivatives had a positive effect and a significantly larger (dif-ferent) effect on the value relevance of eq-uity book value compared to discretionary accruals.
Wald Test:
Price Model CAR Model
H0: EPS*DERIV - EPS*DAC = 0
F-Test: γ4 = γ7 0.9541
ß4 = ß7 0.4169
H0: EBV*DERIV - EBV*DAC = 0
F-Test: γ5 = γ8 0.0000 ***
ß5 = ß8 0.9822
Table 5. Wald Test on the Difference between the Coefficient of Financial Derivatives and Discretionary Accruals and the Relationship between Earnings and Eq-uity Book Value
Pit = γ0 + γ1EPSit + γ2EBVit + γ3DERIVit + γ4EPSit*DERIVit + γ5EBVit*DERIVit + γ6DACit + γ7EPSit*DACit +
γ8EBVit*DACit+ γ9SIZEit+ γ10CSit + γ11GOit + e it
CAR = ß0 + ß1ΔEPSit + ß2ΔEBVit + ß3ΔDERIVit + ß4ΔEPSit*ΔDERIVit + ß5ΔEBVit*ΔDERIVit + ß6ΔDACit +
ß7ΔEPSit*ΔDACit + ß8ΔEBVit*ΔDACit + ß9ΔSIZEit + ß10ΔCSit + ß11ΔGOit
***Significant at a level of 1 percent; **Significant at a level of 5 percent; *Significant at a level of 10 percent H0 : Coeff. EPS*DERIV – Coeff. EPS*DAC = 0; H1 : Coeff. EPS*DERIV – Coeff. EPS*DAC ‘“ 0
Discussion
The correlation matrix test result showed that financial derivatives and discre-tionary accruals had a significant and posi-tive correlation, which meant that they were complementary. Meanwhile, the test on H1 showed that a dividend payout ratio with and without negative pre-managed earnings yielded the same results. The effects of fi-nancial derivatives on discretionary accruals consistently showed a positive and significant association. The result infers that firms di-rectly recognized unrealized gains/losses of derivatives in their income statements, as if they were speculative activities. However, speculative activities increase earnings vola-tility, prompting managers to increase discre-tionary accruals to stabilize earnings. These findings are consistent with Barton (2001) who suggested that the existence of a posi-tive or complementary association between derivatives and discretionary accruals indi-cated that a higher use of speculative activi-ties intensifies the use of discretionary ac-cruals.
The classification test on financial de-rivatives showed that nine financial deriva-tives were reported as speculative and 150 financial derivatives were reported as hedg-ing that were noncompliant with PSAK 55 (1999). It implied that most (79.9%) finan-cial derivatives users were conducting specu-lative actions. Hence, the test result supports H1, namely there is a positive or complemen-tary relationship between financial deriva-tives and discretionary accruals. This result is in line with Wild et al. (2004), who argued that many firms speculate (implicitly), al-though they disclose their derivatives as hedg-ing.
The result of H2 implied that the effects of financial derivatives on the values
This may stem from opportunistic discretion-ary accruals decreasing earnings reliability. This shows that discretionary accruals can potentially decrease the value relevance of earnings.
Interestingly, the test on the effects of discretionary accruals on the value relevance of equity (EBV*DAC) using cumulative ab-normal return and deflated by outstanding shares models showed insignificant results. This was consistent with Feltham and Ohlson (1995) models’ which proposed that earnings were part of the components of book value of equity in the balance sheet. This suggests that the more accurate the book value of equity the more unbiased the value relevance of equity. However, low earnings reliability due to opportunistic discretionary accruals could give rise to errors in normal earnings estimates, resulting in discretionary accruals having no effects on the value relevance of equity. However, when using the price model, the effect is significantly negative, which sug-gests that discretionary accruals weaken the value relevance of equity.
Moreover, the test on the differences between the effects of financial derivatives and discretionary accruals on the value rel-evance of earnings using both price and re-turn models showed statistically insignificant results. The test on the differences between the effects of financial derivatives and dis-cretionary accruals on the value relevance of equity using the price model showed a posi-tively significant result. This implied that derivatives had a positively significant and larger (different) association with the value relevance of equity book value compared to discretionary accruals. Meanwhile, the test using the return model found no significant associations.
Conclusions
posi-tive effect on the value relevance of equity with a price model.
According to Nissim and Penman (2003), there was a change in the instruments used to detect earnings management from accruals activity to real financial activities following the imposition of the Sarbanes-Oxley Act (Cohen et al. 2004). This is con-sistent with what this study found, namely real activities such as financial derivatives are value-relevant, while discretionary accruals are not. Therefore, it is advisable that inves-tors exercise caution against a shift in earn-ings management activities.
Based on the sample data from finan-cial statements, firms used finanfinan-cial deriva-tives that were comprised of, based on types of contract, cross-currency swaps (48%), in-terest rate swaps (25%), cross-currency inter-est rate swaps (9%), forwards (10%) and op-tions (8%). However, this study did not test samples based on those types of financial derivatives because of a lack of sufficient data. Separating the data further would mini-mize the data proportion that may result in inadequate test results. This being the case, it is recommended that future research groups such transactions into swaps, forwards and options.
References
Aabo, T. 2007. The Impact of individual-owners on currency speculation: The case of danish non-financial firms. International Journal of Managerial Finance 3 (1): 92-107.
Ali, Z. P. 1992. The role of earnings levels in annual earnings-returns studies. Journal of Accounting Research 30 (2): 286-296.
Asquith, P., A. Beatty, and J. Weber. 2005. Performance pricing in bank debt contracts. Accounting Review 40: 101-128.
Barth, M. E., W. H. Beaver, and W. R. Landsman. 1998. Relative valuation roles of equity book value and net income as a function of financial health. Journal of Accounting and Economics 25 (1): 1-34. Barton, J. 2001. Does the use of financial derivatives affect earnings management decisions? The
Account-ing Review 76 (1): 1-26.
Beaver. W. H. 1998. Financial Reporting: An Accounting Revolution (3rd ed.). Upper Saddle River, NJ:
Prentice-Hall
Brown, S. J., and J. B. Warner. 1985. Measuring security price performance. Journal of Financial Economics 8: 205-258.
Burgstahler, D., and I. Dichev. 1997. Earnings management to avoid earnings decreases and losses. Journal
of Accounting and Economics 24: 99-126.
Collins, D. W., and S. P. Kothari. 1989. An analysis of intertemporal and cross-sectional determinants of earnings response coefficients. Journal of Accounting Research 11: 143-82.
Cohen, D. A., A. Dey, and T. Z. Lys. 2004. Trends in earnings management and informativeness of earnings announcements in the pre- and post-Sarbanes-Oxley periods. Northwestern University work-ing paper.
Easton, P. D., P. H. Eddey, and T. S. Harris. 1998. An investigation of revaluations of tangible long-lived assets. Journal of Accounting Research 31 (supp): 1-38.
Feltham, G. A., and J. A. Ohlson. 1995. Valuation and clean surplus accounting for operating and financial activities. Contemporary Accounting Research (Spring).
Feltham, G. A., and J. Pae. 2000. Analysis of the impact of accounting accruals on earnings uncertainty and response coefficient. Journal of Accounting Auditing and Finance 15 (3): 199-236.
Financial Accounting Standard Board (FASB) 1998. Accounting for derivative instruments and hedging activities. Statement of Financial Accounting Standard (SFAS) No. 133.
Graham, J. R., H. R. Campbell, and S. Rajgopal. 2005. The economic implications of corporate financial reporting, Journal of Accounting and Economics 40.
Greene, W. H. 2003. Econometric Analysis (5th ed.). New Jersey: Prentice-Hall.
Gujarati, D. N. 2003. Basic Econometrics (3rd ed.). McGraw-Hill Book Co.
Huang, P., T. J. Louwers, J. S. Moffitt, and Y. Zhang. 2008. Ethical management, corporate governance, and abnormal accruals. Journal of Business Ethics 83 (3): 469-487.
Ikatan Akuntan Indonesia. 1999. Pernyataan Standar Akuntansi Keuangan (PSAK) No.55,Instrumen Keuangan:
Pengakuan dan Pengukuran. Jakarta: Salemba Empat.
Ikatan Akuntan Indonesia. 2006. Pernyataan Standar Akuntansi Keuangan (PSAK) No.55, Instrumen Keuangan
:Pengakuan dan Pengukuran. Jakarta: Salemba Empat.
Jelinek, K. 2007. The effect of leverage increases on earnings management. Journal of Business and Economic
Studies 13: 24-46.
Kothari, S. P., A. J. Leone, and C. E. Wasley. 2005. Performance matched discretionary accrual measures.
Journal of Accounting and Economics 39: 163-197.
Kothari, S. P. and J. L. Zimmerman. 1995. Price and return models. Journal of Accounting and Economics 20 (2): 155-192.
Indonesian Bank Accounting Guideline (PAPI). 2008. Jakarta, Indonesia: Bank Indonesia.
Lee, C. M. C. 1993. Market fragmentation and price execution in NYSE-listed securities. Journal of Finance 48: 1009-1038.
Lev, B., and P. Zarowin. 1999. The boundaries of financial reporting and how to extend them. Journal of
Research Accounting 37 (2): 353-383.
Moffitt, J. S. 2001. The effect of derivative use on discretionary accruals. PhD Dissertation. Dept. of Accounting, Florida State University.
Nissim, D., and H. Penman. 2003. The association between changes in interest rates, earnings and equity values. Contemporary Accounting Research 20(4): 775-804.
Pincus, M. and S. Rajgopal. 2002. The interaction between accrual management and hedging: Evidence from oil and gas firms. The Accounting Review 77 (1): 127-160.
Richardson, S. A., R. G. Sloan, M. T. Soliman, and I. Tuna. 2004. Accrual reliability, earnings persistence and stock prices. Working Paper. The Wharton School, University of Pennsylvania.
Sloan, R. D. 1996. Do stock prices fully reflect information in accruals about future earnings? The
Subramanyam, K. R.1996. The pricing of discretionary accruals. Journal of Accounting and Economics 22 (Aug-Dec): 249-281.
Sun, L., and S. Rath. 2010. Ex-ante pre managed earnings benchmarks and earnings management of Australian firms. www.ssrn.com.
Watts, R. L., and J. L. Zimmerman. 1986. Positive Accounting Theory. Eaglewood Cliffs, New Jersey, USA: Prentice Hall Inc.
Whelan, C., and R. McNamara. 2004. The impact of earnings management on the value-relevance of financial statement information. Social Science Research Network (SSRN) (July). www.ssrn.com.
Wiedman, C. I., and C. A. Marquardt. 2004. The effect of earnings management on the value relevance of accounting information. Journal of Business Finance and Accounting 31 (3): 297-332
Wild, J. J., K. R.Subramanyam, and R. F. Halsey. 2004. Financial Statement Analysis (8th ed.). McGraw Hill.