ENVIRONMENTAL HEALTH MANAGEMENT OF CEMENT INDUSTRY
Muslikha Nourma Rhomadhoni1)
, 1)
, Rizka Novembrianto2)
Public Health Program, 1)
Faculty Of Health, Nahdhatul Ulama University Of Surabaya. 2)
UPN Veteran Jawa Timur Email: muslikhanourma@unusa.ac.id
Abstract
Increased development in Indonesia in line with the needs of raw materials for the construction of a building. Operational cement industry is done to meet the need for building materials such as cement. This will be directly proportional to the waste produced by the cement company. This study aims to examine the environmental management aspects of the Cement Company.This study uses qualitative research that is an analytic survey. Potential impacts that arise in the cement industry are: wastewater, noise, and dust. Sources of waste water When the operation comes from the MCK employees. The quality of the waste water showed that the BOD content of 14 mg / L and COD was 35 mg / L. These results on the parameters of BOD and COD have met the quality standards of East Java Governor Decree no. 12 of 2013. Garbage generated is generally waste result of office activity and cement packing of cement damaged or returned by consumer. For B3 waste or B3 waste, cement indsutry has made storage or TPS B3, and in the process of obtaining Permit for temporary storage of B3 Waste. Operational air pollution management uses a bag filter controller that serves as a cement dust prevention so as not to fly anywhere. In addition, there is also a Dust Collector as a dust collector assisted blower in suctioning dust on each production machine that has the potential to produce cement dust. the noise levels occurring at some point do not meet the Permenaker's quality standard. 13 / Menaker / X / 2011. Noise comes from the activities of production machines and packing machines.Waste management cement industry results is: Management and monitoring of wastewater and clean water has meets environmental quality standards, Solid Waste Management and Monitoring differentiated between organic and inorganic waste, Air Pollution Management and Monitoring : Results The ambient air quality in second semester (operational activities) is better than the ambient air quality in first semester (construction activity). The results of ambient air quality in first semester and second semester are still below the quality standard. Chimney emission quality results under environmental quality standards. Noise Management and Monitoring still exceeds the quality standard so that it is necessary to increase noise management effort arising from cement industry operational activities
Keywords: environmental health, management, cement industry.
INTRODUCTION
Cement industry is one of the major contributors of pollutants to air pollution such as gas emissions and dust particles. In the process of producing the cement industry mostly uses fossil fuels, resulting in environmental impact. In addition, in the production process of the cement industry also has a direct physical impact on both the Workers and the
Community, which is the impact of noise level and mechanical vibration of the cement production process.
natural content due to human activities will reduce air quality.
METHOD
This study uses qualitative research that is an analytic survey
RESULT
Potential impacts that arise in the cement industry are: wastewater, noise, and dust. Sources of waste water When the operation comes from the MCK employees. In the processing is done in a temporary container which is then flowed to WWTP. To avoid wastewater pollution, routine monitoring and sampling of drainage channels are conducted. Other waste water (black water) produced is managed with septic tanks. In addition, in the management of liquid waste routinely monitor the sewer so that no deadlock occurs. Other liquid waste other than domestic activities is the handling of used olie. Olie used this is still needed and accommodated in the drum, then olie used for lubrication purposes machine machine located in the factory. The rest is returned to other parties who have authority in handling waste olie waste.
Table 1.1 Results of Quality Analysis of Domestic Wastewater
No. Parameter Result Standard* Units
1 pH 6,86 6-9 pH
unit
2 BOD 14 30 mg/L
3 COD 35 50 mg/L
4 TSS 3 50 mg/L
5 Oil and Grase
<1 10 mg/L
Source: PT. Envilab Indonesia, 2016.
#
Keputusan Gubernur Jawa Timur No. 12 Tahun 2013
The quality of the waste water showed that the BOD content of 14 mg / L and COD was 35 mg / L. These results on the
parameters of BOD and COD have met the quality standards of East Java Governor Decree no. 12 of 2013. BOD shows the amount of oxygen required by microorganisms to decompose dissolved organic matter and some of the organic substances suspended in high water. The predominance of this oxygen demand indicates that domestic wastewater treatment is in accordance with the characteristics of the oraganic load. Monitoring is required every 3 months to know the quality of domestic waste water when operational remains monitored. Garbage generated is generally waste result of office activity and cement packing of cement damaged or returned by consumer. Efforts are made to overcome is separated between organic and non organic, after separated Solid waste due to damaged cement packing specifically collected which will be recycled, reuse and reduce again by parties who use it. For organic waste result of cement industry collected for later taken to the TPS in the Area. For B3 waste or B3 waste, cement indsutry has made storage or TPS B3, and in the process of obtaining Permit for temporary storage of B3 Waste.
Ambient Air Quality Results at the first point that is in the area south can be seen in Table 1.2 and Table 1.3 of meteorological data when sampling the first point as follows:
Table 1.2 Results of Ambient Ambient Air Quality Analysis Area Truck Scale
No Parameter Result Standard* Units
Ambien Air
Source : PT. Envilab Indonesia, 2016.
#
Keputusan Gubernur Jawa Timur No. 10 Tahun 2009
In Table 1.2 Indicates the overall parameters of Ambient Air Quality Analysis Area Truck Scale meets the quality standard. This means that the conditions for working in truck scale areas are safe for human health and the environment.
Table 1.3. Meteorological Data during Ambient Air Quality Analysis Area
Source : PT. Envilab Indonesia, 2016.
In addition to air pollution management is also done the management and monitoring of emissions in some chimneys contained in cement idnsutry. Monitoring is conducted to determine the significant impacts resulting from the chimney on air pollution. Testing is done by taking sampling from the chimney when the production machines operate. For workers'
protection, every worker wears a mask and safety glasses as a protective device from dust. There are 3 stack emission testing points performed. Air Quality Results Emissions at all three points can be seen in Table 1.4 as follows:
Table 1.4 Emision Quality Result Analysis
N
Source: PT. Envilab Indonesia, 2016.
#
Keputusan Gubernur Jawa Timur No. 10 Tahun 2009
controllers such as Bag House. However, regular monitoring and monitoring is necessary to avoid emission test results that exceed the quality standard.
Noise at operation comes from the activities of production machines and packers. In order to avoid the impact of disturbance to the surrounding community and operational on working hours only. Besides also doing the control of the power of noise (desible) in the surrounding environment in cooperation with the Office of Manpower. For workers' protection, workers wear ear plugs when noise levels are over the limit. At the time of noise measurement during the construction process, there is no noise which means / does not exceed the quality standard. Noise monitoring activities are conducted every 6 months.
Data of environmental noise haze during construction by way of noise sampling with Sound Level Meter method. The sampling shall be carried out by the accredited and regulated laboratory environment agency based on the Regulation of the State Minister of Environment Number 6 Year 2009.
Sampling location is done at 4 points as follows:
1. Point 1 Area Packer with a view to know the noise level at the working environment of employees in receiving noise disturbance at PT. X.
2. Point 2 at the location of Cement Silo area PT. X with the intention to know the noise level of work environment of the employees in receiving noise disturbance in PT. X.
3. Point 3 in Proportion area of PT. X with the intention to know the noise level of work environment of the employees in receiving noise disturbance in PT. X.
4. Point 4 in Mill area of PT. X with the intention of knowing the noise
level The working environment in receiving noise interference
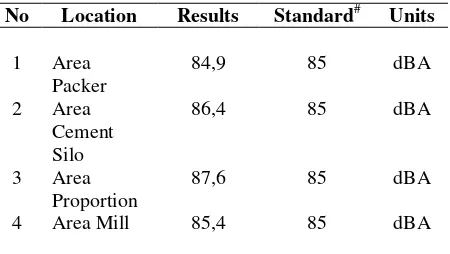
Tabel 1.5. Noise Result Analysis
No Location Results Standard# Units
1 Area Packer
84,9 85 dBA
2 Area Cement Silo
86,4 85 dBA
3 Area Proportion
87,6 85 dBA
4 Area Mill 85,4 85 dBA
Source: PT. Envilab Indonesia, 2016.
#
Permenaker No. 13/Menaker/X/2011
Based on Table 1.5 the noise levels occurring at some point do not meet the Permenaker's quality standard. 13 / Menaker / X / 2011. Noise comes from the activities of production machines and packing machines.
CONCLUSION
Waste management cement industry results is:
1. Management and monitoring of wastewater and clean water has meets environmental quality standards
2. Solid Waste Management and Monitoring differentiated between organic and inorganic waste
3. Air Pollution Management and Monitoring
a. Results The ambient air quality in second semester (operational activities) is better than the ambient air quality in first semester (construction activity).
b. The results of ambient air quality in first semester and second semester are still below the quality standard. c. Chimney emission quality results
under environmental quality standards.
management effort arising from cement industry operational activities
REFERENCES
Alaerts, G. dan Sri Sumestri S.
1987.Metode Penelitian
Air.Cetakan pertama Surabaya.
APHA, 1976.Standart Method for Examination of Water and Waste Water.Fourteenth Edition.PHA-AWWA-WPFC Publishing Co., Washington D.C.
Fardiaz, Srikandi, 1992. Polusi Air dan Udara. Edisi I, Cetakan I, Yogyakarta: YayasanKanisius.
Mukono. J., 2000, Prinsip dasar kesehatan lingkungan, Airlangga University Press, Surabaya
Mukono.J., 2002, Epidemiologi lingkungan, Airlangga University Press, Surabaya
Nunung Prihatining Tias, 2009 Efektivitas Pelaksanaan AMDAL dan UKL
UPL Dalam Pengelolaan
Lingkungan Hidup Di Kabupaten Kudus Tesis Undip
Purba, J. 2002. Pengelolaan Lingkungan Sosial. Jakarta: Kantor MNLH-Obor.
Peraturan Pemerintah nomor 27 Tahun 2012 tentang Izin Lingkungan.
Peraturan Gubernur Jawa Timur Nomor 30 Tahun 2011 tentang Jenis Usaha dan/atau Kegiatan yang Wajib dilengkapi UKL-UPL.
Peraturan Bupati Gresik Nomor 1 Tahun 2013 tentang Jenis Usaha dan/atau Kegiatan Yang Wajib dilengkapi UKL-UPL serta SPPL.
Rump, H.H and H. Kirst. 1992.
Laboratory Manual For The Examination of Water, Waste Water, and Soils. 2 nded, VCH.
Slamet Riyadi, Al. 1992. Pencemaran Udara. PenerbitUsahaNasional.
Supraptini. 2002. Pengaruh Limbah Industri Terhadap Lingkungan di Indosnesia. Jurnal Media Penelitian dan Pengembangan Kesehatan. Vol 12 No. 2 Edisi Juni tahun 2002. http://ejournal.litbang.depkes.go.id/ index.php/MPK/article/view/1063.
Sucipto, C.D dan Asmadi, 2011, Aspek kesehatan masyarakat dalam AMDAL, Gosyen Publishing, Yogyakarta.