Ocean Wave Characteristics in Indonesian
Waters for Sea Transportation
Safety and Planning
Roni Kurniawan1 and Mia Khusnul Khotimah2AbstractThis study was aimed to learn about ocean wave characteristics and to identify times and areas with vulnerability to high waves in Indonesian waters. Significant wave height of Windwaves-05 model output was used to obtain such information, with surface level wind data for 11 years period (2000 to 2010) from NCEP-NOAA as the input. The model output data was then validated using multimission satellite altimeter data obtained from Aviso. Further, the data were used to identify areas of high waves based on the high wave’s classification by WMO. From all of the processing results, the wave characteristics in Indonesian waters were identified, especially on ALKI (Indonesian Archipelagic Sea Lanes). Along with it, which lanes that have high potential for dangerous waves and when it occurred were identified as well. The study concluded that throughout the years, Windwaves-05 model had a magnificent performance in providing ocean wave characteristics information in Indonesian waters. The information of height wave vulnerability needed to make a decision on the safest lanes and the best time before crossing on ALKI when the wave and its vulnerability is likely low. Throughout the years, ALKI II is the safest lanes among others since it has been identified of having lower vulnerability than others. The knowledge of the wave characteristics for a specific location is very important to design, plan and vessels operability including types of ships and shipping lanes before their activities in the sea.
Keywordswindwaves-05, ALKI, wave, sea transportation, validation.
AbstrakPenelitian ini bertujuan untuk mempelajari gelombang laut karakteristik dan untuk mengidentifikasi kali dan daerah dengan kerentanan terhadap gelombang tinggi di perairan Indonesia. tinggi gelombang sig nifikan Angin Waves-05 output model digunakan untuk mendapatkan informasi tersebut, dengan data angin tingkat permukaan selama 11 tahun periode (2000-2010) dari NCEP-NOAA sebagai masukan. Data output model kemudian divalidasi menggunakan data altimeter satelit multimission diperoleh dari Aviso. Selanjutnya, data yang digunakan untuk mengidentifikasi daerah-daerah gelombang tinggi berdasarkan klasifikasi gelombang tinggi oleh WMO. Dari semua hasil pengolahan, karakteristik gelombang di perairan Indonesia diidentifikasi, terutama pada ALKI (Alur Laut Kepulauan Indonesia Lanes). Seiring dengan itu, yang jalur yang memiliki potensi tinggi untuk gelombang berbahaya dan ketika terjadi diidentifikasi juga. Studi ini menyimpulkan bahwa sepanjang tahun, Windwave-05 Model memiliki kinerja yang luar biasa dalam memberikan informasi gelombang laut karakteristik di perairan Indonesia. Informasi kerentanan tinggi gelombang yang dibutuhkan untuk membuat keputusan tentang jalur paling aman dan waktu terbaik sebelum menyeberang di ALKI ketika gelombang dan kerentanan yang mungkin rendah. Sepanjang tahun, ALKI II adalah jalur paling aman antara lain karena telah diidentifikasi memiliki kerentanan yang lebih rendah daripada yang lain. Pengetahuan tentang karakteristik gelombang untuk lokasi tertentu sangat penting untuk merancang, merencanakan dan pembuluh pengoperasian termasuk jenis kapal dan jalur pelayaran sebelum kegiatan mereka di laut.
Kata Kunciwindwave-05, ALKI, gelombang, transportasi laut, validasi.
I.INTRODUCTION1
ndonesia is the world’s biggest archipelagic country consisting of five large islands and thousands of small islands, and 70% of the territorry is ocean. Various activities on seas, either for sea transportation activities, fisheries, marine resources exploration, and also development in marine sector are very sensitive to weather and sea condition changes.
Based on data from Ministry of Transportation, during 2003 – 2008 there are lots of ship accidences with various causes. 260 cases were due to natural factor which increased with years [1]. Among various natural factors, one that greatly influences marine activities is wave, and therefore, in the marine meteorological services, in addition to wind information, wave
1Roni Kurniawan are with Research & Development Center, Indonesia Agency for Meteorology, Climatology, and Geophysics (BMKG), Jakarta, Indonesia. Email: [email protected].
2Mia Khusnul Khotimah are with Center for Public Meteorology, Indonesia Agency for Meteorology, Climatology, and Geophysics (BMKG), Jakarta, Indonesia. Email: [email protected].
information is the most important part that should exist in every kind of marine weather information [2,3]. The existence of extreme high tides could threaten the safety on sea and may result in great losses. Various cases of shipwreck caused by high waves were including the sinking of KM Binama ship around Aru waters (29 January 2010), cargo ship Super Mitra around Sempadeh Island (3 December 2011), KM Berkah Maju in Kebumen waters (8 March 2012) and KM Serunting in Tanjung Belimbang waters, Lampung (5 March 2012). From those conditions, a question was arised, which was when and where the potential of dangerous high waves occur in Indonesian waters.
This study was aimed to answer the question, that is to identify wave characteristics in Indonesian waters and identify times and areas with high vulnerability of high waves in Indonesian waters.
Windwaves-05 Model is a spectral model to produce wind analysis and forecast designed for the operational purposes in providing BMKG’s marine meteorological information [4]. This model is an improvement and development of RJM-Wave which has been tested for
operational use in BMKG from March 1999 to October 2000. Both models were developed based on MRI-II model developed by Marine Research Institute, Japan Meteorological Agency and was firstly introduced for operational wave forecast in 1986. The reseach of application of this model for wave analysis and forecast in Indonesian waters was conducted by Suratno [5,6], in his study, the model was verified by wave data obtained from ship manual observation. After 3 years trial (2000-2003), in the early 2004 this wave model was operated on a regular basis for marine meteorological information services.
Previously, evaluation of Windwaves model was carried out by Suratno [5] and BMKG [4]. In the study, Suratno [5] conducted an evaluation of the first development of Windwaves model by comparing model output with wave data obtained from ship manual observation. The study was conducted for area between 20N to 20S and 90E to 145E in January and August 1996 with 850 mb wind speed and direction data from EMCWF used as the input. The data were processed by Windwaves to produce wave data with 1 degree spatial resolution. Variable evaluated were wave height and wave period. Result of this study revealed that this model had wave distribution pattern following wind distribution pattern, with the main wave direction following the dominant wind direction. The correlation between the forecasts and the observations was quite good. The deviation value of the Wave height in January for 24 and 48 hours prediction is -0.6 m, with RMSE 0.89 m and correlation 0.735, while in August, bias value is -0.3 m with RMSE 0.69 and the correlation 0.736 (Table 1.).
The next study conducted by BMKG [4] compared the Windwave model output with the wave data obtained from ship manual observation. The study was conducted for 42 days spread over July to September 2010 following the ship departure schedule. Of this study, it was known that in general, the correlation of significant wave height (SWH) with observation data is better than that of maximum wave height (MWH) with the observation data. Correlation coefficient for forecast was 0.43 (MWH) and 0.44 (SWH) with RMSE of 115 cm (MWH) and 85 cm (SWH). While correlation coefficient for hindcast was 0.35 (MWH) and 0.47 (SWH) with RMSE of 136 cm (MWH) and 94 cm (SWH).
This study also compared the Windwaves model output with the satellite observation data from Jason. The result showed that the wave height distribution in Indian Ocean and Western Pacific Ocean indicate if the Windwaves model tends to underestimate compared with the satellite observations data, while in Natuna Sea, Java Sea Flores Sea and Banda Sea, the model data tend to over estimate compared with the satellite. It is concluded that this spatial resolution, taken during 2000-2010 period. Modelling process will produce significant wave height
data with 6 hour temporal resolution and 10 minute spatial resolution. Model output data during 2010 will be validated with multimission satellite altimeter data obtained from Aviso, the data were merged data from Jason-1, Envisat, Jason-2 dan Cryosat-2 [8]. The combined use of satellite altimetry is better than only using one satellite in the process [9,10,11,12,13].
Validation will result in maps of correlation coefficient, RMS error and level of confidence. The level of confidence map was obtained by combining the corellation coefficient with the RMS error value using simple formulation:
½*(RMSE+(1-abs(coef.cor))) (1) The value obtained will show the level of confidence of Windwaves-05 output data, where the smaller value means higher level of confidence and vice versa.
The next step was to identify areas of high waves. The identification was based on the classification of high waves by the Marine Meteorological Services Guide of WMO (World Meteorological Organization), Third edition, WMO-No.471, [2]. The document explains that normally the information about waves less than two metres high is not required for ocean-going ships, whilst information about areas where waves are, or are expected to be, two metres or higher is important, since a large number of ships are affected by these waves. So, it means that the definition of high waves is a two meters significant wave height or more.
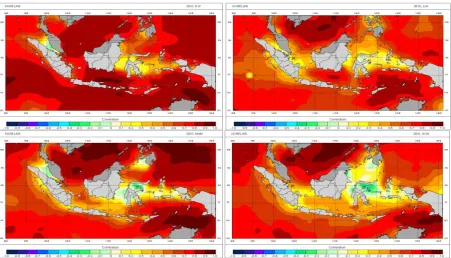
From the processing results, the characteristics of wave in Indonesian waters and on ALKI (Indonesian Archipelagic Sea Lanes) were identified, which lanes and areas has high potential for dangerous waves and correlation value throughout the year which ranged from -0.4 to 0.4. In Asian Monsoon period (December, January, February), the areas with strong correlation (coef. > 0.8) were found in Natuna waters, South China Sea, Java Sea, western waters of Bengkulu to Lampung, Southern waters of Java, Bali, Nusa Tenggara, Timor Sea, Arafuru Sea, Banda Sea, Halmahera Sea, and northern waters of Papua, while Malaka Strait, Makassar Strait, Tomini, Tolo and Bone Bay had low correlation (-0.4 < coef.<(-0.4).
correlation, while in Malaka Strait, Karimata, Sunda and Makassar Strait, Tolo, Bone and Tomini Bay, Maluccas Sea, Seram Sea and Berau Bay have low correlation (Figure 1). And on the period of transition to Asian Monsoon (September, October November), South China Sea and Laut Arafura have the highest correlation though Lampung waters, Sunda Strait, southern Karimata Strait, Tarakan waters, Makassar Strait, Bone, Tomini and Tolo Bay, Maluccas Sea, Seram Sea, Berau Bay, Sulawesi Sea to Minandao Sea have low correllation.
RMS error value of Indonesian waters varied from 0 to 0.8 meters where the majority of Indonesian inter-island waters have RMS error less than 0.3 meters (Figure 2). The best RMS error, the value less than 0.3 throughout the years, was northern waters of Aceh, Java Sea, Makassar Strait, Sulawesi Sea, Flores, Sawu, Timor, west Arafuru, Malacca, Seram, Halmahera Sea and northern waters of Papua. Though the worst RMS error value was found in western waters of Java, Aru Sea and eastern Arafuru Sea at Australian Monsoon period with RMS error reached more than 0.7 meters.
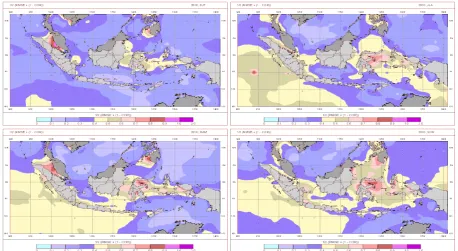
Analysis of confidence level was made by combining the RMSE, and the correlation coefficient value with simple formulation ½ (RMSE+(1-abs (corr.coef.))). Value obtained from the formulation shows level of confidence of Windwaves-05 model in calculating significant wave height where smaller values represent higher level of confidence and vice versa (Figure 3). From RMS error – correlation coefficient combination, it is known that the areas of the highest level of confidence throughout the year covered South China Sea, northern waters of Papua, Arafuru and Timor Sea. Though their RMS error were good, the worst value of RMS error – correlation coefficient combination were found in Malaka Strait, Tomini, Bay and Maluccas Sea. This had happened since the corelations were very poor in the areas.
Significant Wave Height
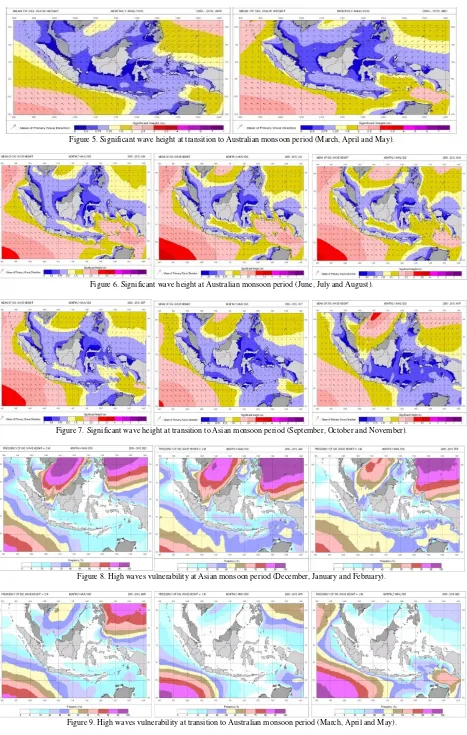
Based on the significant wave height map (Figure 4-7) [15, 16], at the Asian monsoon period (Figure 4), it was known that South China Sea, Nothern waters of Papua to less than 1.2 meters height, and in northern waters of Papua as well. Higher waves in Indian Ocean were stable with more than 2 meters height, and there was a light increase in the wave height in Arafuru Sea. Inter-island waters of Indonesia still had a range between 0.5 to 1.2 meters wave height (Figure 5).
In the Australian Monsoon (Figure 6), enhancement of wave height in Arafuru Sea reaches its peak on June and July, where the height had reached more than 2.5 meters before it decreased again at the next month (August), while high waves in southern Indian Ocean extended to the north to the northern waters of Aceh and the height rose to more than 3 meters, especially in southwestern waters of Lampung. Increase in wave height also occurred in Java Sea reaching 2 meters at the end of this period.
Wave higher than 2 meters in the north and the west of Aceh then started to decrease in September. This condition was accompanied with the increased wave height in South China Sea and northern waters of Papua and wave height decline in Java and Arafuru Sea. In the last month of transition to Asian Monsoon period (September), higher waves than 2 meters occurred only in the northern South China Sea, Indian Ocean south of Java, and Pacific Ocean west of Philippines (Figure 7).
Other research results from Sofian, et al (2010 & 2011) [17,18], which simulates the climatology of the significant wave height in the period of 2000-2008 in Indonesia waters, in general also illustrates the significant wave height conditions which are similar to the results of this research.
High Waves Vulnerability
High waves vulnerability was calculated based on the frequency of > 2 meters of significant wave height. The results were then processed to gain maps of monthy high waves vulnerability as figured below (Figure 8-11) [16].
In December, high wave vulnerability more than 70% is found in South China Sea, northern waters of Papua and Indian Ocean, and the high wave vulnerability decreasing on January and February. At the inter-island waters, like Java sea, Flores Sea, the high wave vulneberility less than 40%, and the vulnerability of high wave at Makasar strait less than 5% (Figure 8).
Based on the map in Figure 8, at the Asian monsoon northern waters of Papua continues. But the vulnerability of high waves on Indian Ocean extends further to north reaching southern waters of Java in May. On April and May almost all Indonesian inter-island waters have less than 5% vulnerability of high wave (Karimata Strait, Java Sea, Makasar Strait, Flores Sea).
Wave Characteristics on ALKI
ALKI (Indonesian Archipelagic Sea Lanes) was defined by Resolution of the Maritime Safety Committee No. 72(69) [14] by the recomendation from Indonesian government (Figure 12). There are three ALKI lanes; ALKI I lies from South China Sea - Natuna Sea - Karimata Strait - Western Java Sea - Sunda Strait - Indian Ocean, ALKI II lies from Sulawesi Sea - Makasar Strait - Lombok Strait – Indian Ocean, and ALKI III which devided into ALKI IIIA Pacific Ocean - Maluccas Sea - Seram Sea - Banda Sea - Ombai Strait - Sawu Sea - Indian Ocean and ALKI IIIB from Pacific Ocean - Maluccas Sea - Seram Sea - Banda Sea - Leti Strait - Timor Sea and ALKI IIIC from Pacific Ocean - Maluccas Sea - Seram Sea - Banda Sea – Arafuru Sea.
Along the lanes, 13 points were selected to identify the average wave height and the peak season of high waves of each point. Among those 13 points, 3 points are located on ALKI I, 4 points are located on ALKI II and the other five are located on ALKI III (Figure 13).
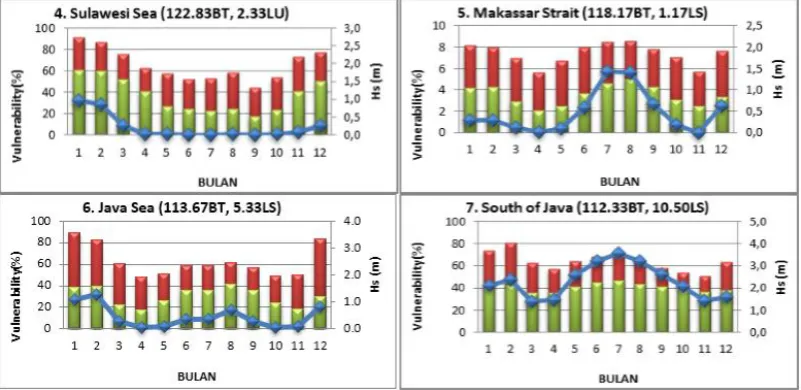
On the first (South China Sea) and second point (Karimata Strait), significant wave height reach its maximum value in Desember and January, and the minimum wave height is in April and May. The frequency of high waves occurance has the same pattern with the average of significant wave height (Figure 14) February. Their minimum values are even almost 0% on April to October on point 4 and April, May, October and November on point 6. The average of maximum significant wave height reached less than 2 meters on both points (Figure 15) [16]. On point 5 (Makassar Strait), vulnerability of high waves reached its maximum on July and August (almost 60%), accompanied by the maximum of average significant wave height of almost 1.5 meters. And on point 7, though the variability in significant wave height is not so much (about 1.7 to 2.2 meters), but the vulnerability fluctuates with the maximum value in July reaching almost 80% (Figure 15).
Point 8 (Pacific Ocean) and point 9 (Maluccas Sea) have almost the same characteristic as point 1 in which the significant wave height reaches its maximum value in January and February, and the minimum wave height is in May to July. The frequency of high waves occurance has the same pattern as the average significant wave height (Figure 16) [16]. Point 10 (Flores Sea) so rarely experiences high wave with only 30% maximum vulnerability in February, 20% vulnerability in January and less than 10% in other months. Point 11 (Sawu Sea) has average significant wave height less than 1.5 meters and very rarely experiences high waves with
From the aforementioned results, comparison on when and where high waves occur in Indonesian waters, and especially on ALKI, was done. If we review the validation analysis over Indonesia and surrounding waters, it will be known that throughout the years, Windwaves-05 model has a magnificent performance in providing significant wave height data of South China Sea, northern waters of Papua, Arafuru and Timor Sea.
From vulnerability maps, it is known that areas often Windwaves-05 data output of those area has also a good accuracy.
CONCLUSION
The result of this study showed that, at the transitional period between monsoons Asian or Australian, most of the territorial waters of Indonesia is not prone to high waves, especially on inter-island waters. at the Asian monsoon period, the highest of high waves vulnerability occur in the northern part of the equator (South China Sea and Pacific Ocean), while in the Australian monsoon period, the highest of high waves vulnerability occur in the Southern part of the equator (Indian Ocean and Arafuru Sea).
The best time for crossing on ALKI I when the wave and its vulnerability is likely low this occurs in April and May. For crossing on ALKI I, warning should be given on December and January to every vessel before shipping, since the height waves on South China Sea and Strait Karimata may reach more than 3 meters, and vulnerability of high waves is also more than 80%. The same vigilance should also be given while crossing south west of Sunda Strait in July to September, since the waves may reach 2.5 meters and the vulnerability of high waves is more than 90%. Java. The vulnerability of high waves is also not so high, where the highest vulnerability is in Makassar Strait Banda Sea and Arafuru Sea is also dangerous in June and July since the waves may reach more than 2.5 meters and the high wave vulnerability may exceed 70% at the most.
From the aforementioned explanation, it can be concluded that throughout the years, ALKI II is the safest lanes among others since it has lower vulnerability of high waves than the others.
characteristics information and succesfully identified the vulnerability of high wave in Indonesian and its surrounding waters, so this information is highly recommended to be used at the sea transportation sectors in order to plan the shipping activities.
REFERENCES
[1] Trans Asia Consultants, "Kajian Analisis Trend Kecelakaan Transportasi Laut Tahun 2003 - 2008," Kementrian Perhubungan Republik Indonesia, Jakarta, 2009.
[2] World Meteorological Organization (WMO), Guide to Marine Meteorological Services Third edition WMO-No. 471, Switzerland: Secretariat of the World Meteorological Organization - Geneva - Switzerland, 2001.
[3] S. Wirjohamidjojo and S. Sugarin, Praktek Meteorologi Kelautan, Jakarta: Badan Meteorologi dan Geofisika (BMKG), 2008. [4] BMKG, "Laporan kegiatan validasi model prakiraan gelombang,"
Badan Metereologi, Klimatologi, dan Geofisika (BMKG), Jakarta, 2011.
[5] S. Suratno, "Model Numerik Prakiraan Gelombang Permukaan Laut untuk Perairan Indonesia dan Sekitarnya," Universitas Indonesia, Jakarta, 1997.
[6] S. Suratno, Panduan Operasional WINDWAVES-04, Pusat Informasi Meteorologi Penerbangan dan Maritim, Jakarta: Badan Meteorologi, Klimatologi dan Geofisika (BMKG), 2004. [7] National Center for Environmental Prediction, "National Center
for Environmental Prediction (NCEP), NOAA, NCEP Operational Data (WRF inputs): 1-degree FNL," 2010. [Online]. Available: http://rda.ucar.edu/datasets/ds083.2/#!description. [Accessed 2010].
[8] AVISO+, "AVISO+," Satellite Altimetry Data, July 2011.
[Online]. Available:
http://www.aviso.altimetry.fr/en/data/products/windwave-products/mswhmwind.html. [Accessed July 2011].
[9] P. Y. Le Traon and G. Dibarboure, "Mesoscale Mapping Capabilities of Multi-Satelite Altimeter Missions," Journal of Atmospheric and Oceanic Technology, vol. 16, pp. 1208-1223, 1999.
[10] P. Y. Le Traon and G. Dibarboure, "Velocity Mapping Capabilities of Present and Future Altimeter Missions: The Role of High-Frequency Signals," Journal of Atmospheric and Oceanic Technology, vol. 19, pp. 2077-2087, 2002.
[11] P. Y. Le Traon and G. Dibarboure, "An Illustration Of The Unique Contribution of The TOPEX/Poseidon – Jason-1 Tandem Mission to mesoscale Variability Studies," Marine Geodesy, vol. 27, no. 1-2, pp. 3-13, 2004.
[12] A. Pascual, Y. Faugère, G. Larnicol and P. Le Traon, "Improved Description of The Ocean Mesoscale Variability by Combining Four Satellite Altimeters," Geophysical Research Letters, vol. 33, no. 2, pp. 1-4, 2006.
[13] P. Queffeulou, F. Ardhuin and J.-M. Lefèvre, "Wave height measurements from altimeters: validation status & applications”, March 19, 2012. IFREMER. http://www.aviso.oceanobs.com," in
Ocean Surface Topography Science Team (OSTST) 2011 Meeting, San Diego, 2011.
[14] International Maritime Organization (IMO), "Resolution MSC.72 (69) Adoption (1998), Designation and Subtitution of Archipelagic Sea Lanes.," [Online]. Available: http://www.navcen.uscg.gov/pdf/marcomms/imo/msc_resolutions /MSC69-22a1-9.pdf.
[15] R. Kurniawan, M. N. Habibie and S. Suratno, "Variasi Bulanan Gelombang Laut Di Indonesia," Jurnal Meteorologi dan Geofisika, vol. 12, no. 3, pp. 221-232, 2011.
[16] R. Kurniawan, "Studi Daerah Rawan Gelombang Tinggi di Indonesia," Fakultas MIPA, Universitas Indonesia, Jakarta, 2012. [17] I. Sofian and A. B. Wijanarto, "Simulation of Significant Wave
Height Climatology using WaveWatch III," International Journal of Geoinformatics, vol. 6, no. 4, pp. 13-19, 2010.
[18] I. Sofian, A. Supangat, M. S. Fitriyanto and R. Kurniawan, "Memahami dan Mengantisipasi Dampak Perubahan Iklim Pada Pesisir dan Laut di Indonesia Bagian Timur," Jurnal Meteorologi dan Geofisika, vol. 12, no. 1, pp. 53-64, 2011.
Figure 2. RMS error of Windwaves-05 model at the period of Asian monsoon, transition to Australian monsoon, Australian monsoon, and transition to Asian monsoon.
Figure 3. Level of confidence (½ (RMSE + (1-cor.coef)) of Windwaves-05 model at the period of Asian monsoon, transition to Australian monsoon, Australian monsoon and transition to Asian monsoon. Smaller values represent higher level of confidence and vice versa.
Figure 5. Significant wave height at transition to Australian monsoon period (March, April and May).
Figure 6. Significant wave height at Australian monsoon period (June, July and August).
Figure 7. Significant wave height at transition to Asian monsoon period (September, October and November).
Figure 8. High waves vulnerability at Asian monsoon period (December, January and February).
Figure10. High waves vulnerability at Australian monsoon period (June, July and August).
Figure 11. High waves vulnerability at transition to Asian monsoon period (September, October and November).
Figure12. ALKI (Indonesian Archipelagic Sea Lanes). Figure13. Points selected on ALKI to define high wave variation.
Figure15. Wave variation on ALKI II