The Association Between Obesity and Low Back Pain and
Disability Is Affected by Mood Disorders
A Population-Based, Cross-Sectional Study of Men
Louisa Chou, MBBS(Hons), FRACP, Sharmayne R.E. Brady, MBBS(Hons),
FRACP, BMedSci(Hons), Donna M. Urquhart, PhD, B.Physio(Hons), Andrew J. Teichtahl, MBBS(Hons),
FRACP, PhD, B.Physio(Hons), Flavia M. Cicuttini, MBBS(Hons), FRACP, PhD,
Julie A. Pasco, PhD, MEpi, BSc(Hons), Sharon L. Brennan-Olsen, PhD, BA(Hons), GCALL,
and Anita E. Wluka, MBBS, FRACP, PhD
Abstract:Low back pain (LBP) and obesity are major public health problems; however, the relationship between body composition and low back pain in men is unknown. This study aims to examine the associ-ation between body composition and LBP and disability in a populassoci-ation- population-based sample of men, as well as the factors that may affect this relationship.
Nine hundred seventy-eight male participants from the Geelong Osteoporosis Study were invited to participate in a follow-up study in 2006. Participants completed questionnaires on sociodemographics and health status. Low back pain was determined using the validated Chronic Back Pain Grade Questionnaire and the presence of an
emotional disorder was assessed using the Hospital Anxiety Depression Scale. Body composition was measured using dual energy x-ray absorptiometry.
Of the 820 respondents (84% response rate), 124 (15%) had high-intensity low back pain and/or disability (back pain). Low back pain was associated with higher body mass index (28.70.4 vs 27.30.2 kg/m2, P¼0.02) and waist–hip ratio (0.970.006 vs 0.960.006,P¼0.04), with increased tendency toward having a higher fat mass index (8.0 vs 7.6 kg/m2, P¼0.08), but not fat-free mass index (P¼0.68). The associations between back pain and measures of obesity were stronger in those with an emotional disorder, particularly for waist–hip ratio (P¼0.05 for interaction) and fat mass index (P¼0.06 for interaction). In a population-based sample of men, high-intensity LBP and/or disability were associated with increased levels of obesity, particularly in those with an emotional disorder. This provides evidence to support a biopsychosocial interaction between emotional disorders and obesity with low back pain.
(Medicine95(15):e3367)
Abbreviations: BMI = body mass index, DXA = bone densitometry, FFM = fat-free mass, FFMI = fat-free mass index, FM = fat mass, FMI = fat mass index, GOS = Geelong Osteoporosis Study, HADS = Hospital Anxiety and Depression Scale, HADS-A = Hospital Anxiety and Depression Scale (anxiety subscale), HADS-D = Hospital Anxiety and Depression Scale (depression subscale), LBP = low back pain.
INTRODUCTION
L
ow back pain is a major public health problem and was identified as the leading cause of disability worldwide in the Global Burden of Disease Study.1,2 Approximately 80% of adults experience at least 1 episode of back pain during their lifetime.3Despite the magnitude of the problem, the structural origin of most episodes of back pain is unknown, with poor correlation between symptoms and structural abnormalities.4 Hence back pain is usually considered ‘‘non-specific.’’ In order to address this problem, research has focused on identifying modifiable risk factors for back pain.Potential risk factors for back pain include older age, female sex, lower educational attainment, increased physical work demands, and emotional disorders.5Obesity has also been linked with low back pain,6 although a previous systematic review concluded obesity was only a weak risk factor.7,8It is estimated that approximately one-third of the world’s adult population is overweight, as defined by body mass index
Editor: Ilke Coskun Benlidayi.
Received: November 18, 2015; revised: February 24, 2016; accepted: March 21, 2016.
From the Department of Epidemiology and Preventative Medicine (LC, SREB, DMU, AJT, FMC, JAP, AEW), School of Public Health and Preventative Medicine, Monash University; Baker IDI Heart and Diabetes Institute (AJT), Melbourne; School of Medicine (JAP, SLB-O), Deakin University, Geelong; North-West Academic Centre (JAP, SLB-O), The University of Melbourne; and Australian Institute of Musculoskeletal Sciences (SLB-O), Melbourne, Victoria, Australia.
Correspondence: Anita E. Wluka, Department of Epidemiology and Preventative Medicine, School of Public Health and Preventative Medicine, Monash University, Alfred Hospital, Commercial Road, Melbourne, VIC 3004, Australia (e-mail: anita.wluka@monash.edu). LC and SREB contributed equally to this work. LC, SREB, AJT, FMC
contributed to data analysis and interpretation of data, drafting and revising the manuscript. DMU contributed to conception and design of study and manuscript revision. JAP, SLB-O contributed to conception and design of study, acquisition of data and manuscript revision. AEW contributed to study conception and design, acquisition of data, analysis and interpretation of data, drafting and revising the manuscript. All authors have approved the final version to be published.
The Geelong Osteoporosis Study is supported by grants from the NHMRC (projects 299831, 628582).
JAP reports receiving grants from NHMRC (projects 299831, 628582) during the conduct of the study. AEW reports receiving grants from Glaxo Smith Kline outside the submitted work. LC is supported by an Australian Postgraduate Award and an Arthritis Foundation Award. SREB is supported by a NHMRC Clinical Postgraduate Research Scholarship (#1074979). SLB-O is supported by an Alfred Deakin Postdoctoral Research Fellowship from Deakin University (2015– 2016). DMU and AEW are recipients of NHMRC Career Development Fellowships (Clinical Level 1 #1011975 and Clinical Level 2 #1063574, respectively). AJT is the recipient of the NHMRC Early Career Fellow-ship (#1073284).
The authors have no conflicts of interest to disclose.
Copyright#2016 Wolters Kluwer Health, Inc. All rights reserved. This is an open access article distributed under the Creative Commons Attribution License 4.0, which permits unrestricted use, distribution, and reproduction in any medium, provided the original work is properly cited. ISSN: 0025-7974
DOI: 10.1097/MD.0000000000003367
(BMI).9 Obesity may have both biomechanical and meta-inflammatory effects on the spine.10 However, obesity measured by BMI is a crude measure of adiposity, as it fails to differentiate fat from fat-free mass. Moreover, body com-position is markedly different between males and females,11,12 with higher fat mass in females compared with males. This may account for the results of a meta-analysis that concluded that the association between being overweight or obese and low back pain is stronger in women compared with men.13 While this gender disparity in the relationship between obesity and back pain may be related to differences in pain perception and hormonal influences,14 differences in the composition of fat and fat-free mass between males and females may also play a role. Fat mass has been shown to be associated with back pain intensity and disability in a cohort of predominantly female adults,15but this has yet to be comprehensively examined in males. This is a particularly pertinent question since the burden of low back pain in men is estimated to be higher than in women, as measured by disability-adjusted life years.16
The aim of this study was to examine the association between body composition and low back pain and disability in a population-based sample of men, as well as the factors that may affect this relationship.
METHODS
Study Population
The GOS is a population-based Australian study, designed to investigate the epidemiology of osteoporosis among adults. During the baseline study conducted from 2001 to 2006, an age-stratified sample of 1540 men was randomly recruited from the Barwon Statistical Division using the Australian electoral roll as a sampling frame. This study evaluated adult male participants (n¼978) aged20 years who participated in the 5-year follow-up of the Geelong Osteoporosis Study (GOS) from 2006 to 2010.17Reasons for loss to follow-up: 141 had died before the follow-up, 41 had left the region, 16 were unable to provide informed consent, 139 were not contactable, and 225 declined to participate.17Thus, the remaining 978 participants (81%) of the potential study population attended a clinical assessment that included measures of body composition, as well as the com-pletion of questionnaires designed to assess demographics, health status, and back pain. The Human Research Ethics Committees of Barwon Health and Monash University approved this study. All participants provided informed consent.
Data Collection
Main Outcome: Low Back Pain and Disability
Low back pain intensity and disability in the past 6 months were evaluated using the Chronic Pain Grade Questionnaire, a validated tool used to grade the severity of chronic pain and disability in population-based studies in primary care set-tings.18,19It includes 7 questions from which a pain intensity score (0–100) and disability points score (0–6) are calculated. Participants are initially classified into 1 of 5 groups based on the Chronic Pain Grade Classification, as the tool was intended; no pain and disability (pain intensity score¼0 and disability points¼0), low intensity pain and low disability (pain intensity score<50 and disability points<3), high intensity pain and low disability (pain intensity score50 and disability points<3), high disability that is moderately limiting (disability points 3 or 4, regardless of pain intensity), and high disability that is severely limiting (disability points 5 or 6, regardless of pain
intensity). Participants were further categorized into 2 groups; no or low back pain intensity and disability (no pain and disability or low intensity pain and low disability) or high back pain intensity and/or disability (high intensity pain and low disability, or high disability that is moderately limiting or high disability that is severely limiting).
Demographics and General Health
Self-reported information was obtained by questionnaires. Education was determined using the question, ‘‘What is your highest completed level of education?’’ with 6 possible answers (no school, primary school, some secondary school, completed secondary school, postsecondary qualification, tertiary qualifi-cation). Secondary school in Australia is education provided for students typically aged between 13 and 18 years of age, there-fore for analyses, participants were categorized as being either completers or noncompleters of secondary school. Mobility was assessed by using the question, ‘‘How would you best describe your activity now?’’ with 7 possible answers, with descriptors, available (very active, active, sedentary, limited, inactive, chair or bedridden, and bedfast). For analyses, the nominal data was were then categorized into 2 groups to differentiate those who were physically mobile (very active or active) and those who had poor mobility (sedentary, limited, inactive, chair or bed-ridden, and bedfast), as previously applied.20‘‘Clinically sig-nificant anxiety and/or depressive symptomatology was determined by use of the validated Hospital Anxiety and Depression Scale (HADS). The self-report HADS tool measures 7 items each for anxiety (HADS-A) and depression (HADS-D), using a 4-point ordinal scale for each to define symptoms from none to most severe (0–3, respectively). Using a cut-point of8 of the total HADS score to indicate high symptomatology, a binary variable was created, as previously employed.21We have not differentiated anxiety from depression, and have utilized, the combined scale (anxiety and/or depression score) to indicate the presence of an emotional disorder.21,22’’
Measures of Body Composition
Weight was measured to the nearest 0.1 kg and height was measured to the nearest 0.001 m using a stadiometer (with shoes and bulky clothing removed). From these data, BMI [weight (kg)/height (m2)] was calculated. Body composition was measured using dual-energy x-ray absorptiometry (DXA; GE Lunar Prodigy, GE Lunar Corp, Madison, WI). Whole body measures of body fat (fat mass¼FM) and lean tissue mass (fat-free mass¼FFM) were determined. Based on these data, fat-mass index (FMI) was calculated as FMI¼fat-mass/height2and
fat-free mass index (FFMI) was calculated as FFMI¼fat-free mass/height2(where fat-free mass¼lean tissue massþ bone mineral content). The ratio between FM and FFM (fat mass/fat-free mass) was also calculated.
Statistical Analysis
Independent-samplettests andx2tests were used to detect
Multivariate analyses included adjustments for age, emotional disorder, education, mobility, and BMI. To examine the multi-variate associations between body composition (FM or FFM) and back pain, adjustment was made for the alternate body composition measure; for example, when fat mass was the exposure of interest, multivariate analyses were also adjusted for fat-free mass. Interactions between risk factors for low back pain and measures of obesity, including measures of body composition, were examined. A P value of less than 0.05 was regarded as statistically significant. All analyses were conducted using SPSS Statistics 22.0 (SPSS Institute, Chicago, IL).
RESULTS
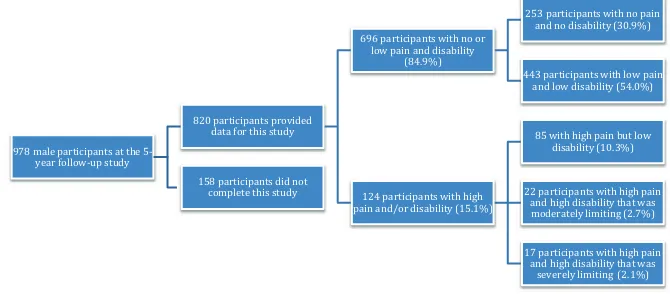
Eight hundred and twenty (83.8%) of the potential 978 male participants provided data for this study. No differences were detected between the 158 men who did not complete this study and those who did in terms of age, emotional disorder, education, mobility, and measures of obesity and body com-position (P>0.07 for all, results not shown). Of the partici-pants, 696 (84.9%) had no or low pain and disability, with 253 (30.9%) having no pain and no disability and 443 (54.0%) having low pain and low disability. There were 124 (15.1%) participants with high pain and/or disability, with 85 (10.3%) having high pain but low disability, 22 (2.7%) having high disability that was moderately limiting, and 17 (2.1%) having high disability that was severely limiting (see Figure 1).
The characteristics of men with versus without high-intensity back pain and/or high disability were compared (Table 1). Participants with high disability and/or high-intensity pain were older, more likely to have an emotional disorder, less likely to have completed secondary school and more likely to have poor mobility than those with no or low back pain and disability (P<0.002 for all). They were also heavier (P¼0.01) and had a higher BMI (P¼0.001) and waist–hip ratio (P¼0.001). In terms of body composition, participants with high-intensity pain and/or disability had higher fat mass and fat mass index (P<0.001 for both) and fat mass/fat-free mass ratio
(0.74 vs 0.66,P0.001). There were no differences detected in fat-free mass and fat-free mass index between those with versus without high pain and/or disability (P>0.34 for both).
The associations between demographic factors and high-intensity back pain and/or high disability were examined, adjusted for potential confounding variables, using estimated
marginal means (Table 2). The presence of an emotional disorder and poor mobility was associated with having high-intensity back pain and/or disability (P<0.001 for both). There was also a trend toward having high-intensity pain and/or disability with increasing age (P¼0.06). Those who had not completed secondary school associated had reduced odds of high pain intensity and/or disability, although this was not statistically significant (P¼0.06).
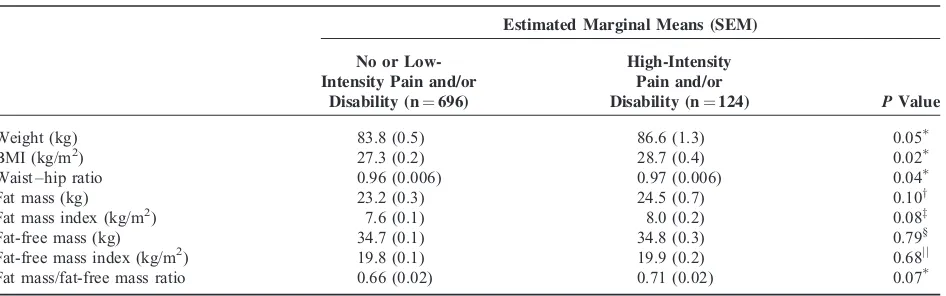
Measures of obesity and body composition were adjusted for age, emotional disorder, education and mobility, and com-pared in men with versus without high-intensity pain and/or disability, as shown in Table 2. Men with high-intensity pain and/or disability had a higher BMI (28.7 vs 27.3 kg/m2, P¼0.02) and waist–hip ratio (0.97 vs 0.96, P¼0.04) and tended to be significantly heavier (86.6 vs 83.8 kg,P¼0.05) after adjustment. There was a tendency for men with high-intensity pain and/or disability to have a higher fat mass (24.5 vs 23.2 kg, P¼0.10) and fat mass index (8.0 vs 7.6 kg/m2, P¼0.08) than men with no or low pain and disability. Fat-free mass and fat-free mass index were not significantly different between those with versus without high pain and/or disability (P>0.68 for both).
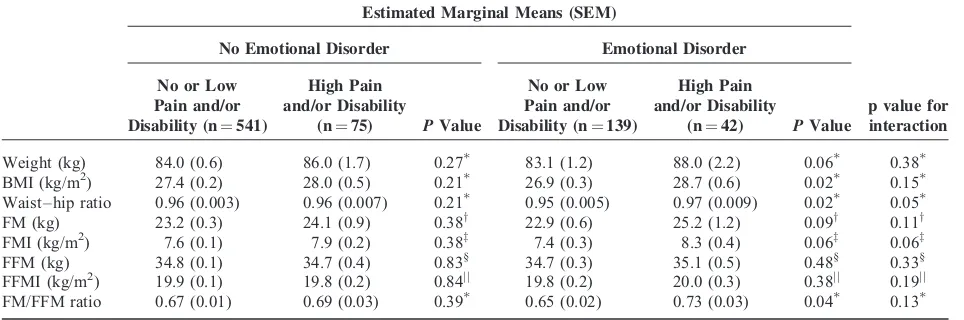
We examined for interactions between risk factors for low back pain and measures of obesity and low back pain. The association between measures of obesity and low back pain tended to be stronger in those with an emotional disorder, than those without (Table 3). There was a trend toward statistically significant interactions between the presence of an emotional disorder with waist–hip ratio (P¼0.05) and fat mass index (P¼0.06). Hence, of the participants who had an emotional disorder, the association between higher waist–hip ratio or fat mass index with low back pain was stronger than in those without an emotional disorder. Participants who had an emotional disorder were similar in terms of mobility, education, and obesity measures (data not shown,P>0.18), compared to those without an emotional disorder. There was no evidence of statistically significant interactions between measures of obesity and age (P>0.13 for all), education (P>0.12 for all), or mobility (P>0.16 for all) and the presence of high-intensity back pain and/or disability.
DISCUSSION
In a population-based cohort of men, higher BMI and waist–hip ratio were associated with high-intensity low back
978 male participants at the 5-year follow-up study
820 participants provided data for this study
696 participants with no or low pain and disability
(84.9%)
253 participants with no pain and no disability (30.9%) 443 participants with low pain
and low disability (54.0%)
124 participants with high pain and/or disability (15.1%)
85 with high pain but low disability (10.3%) 22 participants with high pain
and high disability that was moderately limiting (2.7%) 17 participants with high pain
and high disability that was severely limiting (2.1%) 158 participants did not
complete this study
pain and/or high disability, after adjusting for confounders such as age, emotional disorder, education, and mobility. Other measures of increased adiposity, such as weight, fat mass index, and fat mass/fat-free mass also tended to be associated with high-intensity back pain and/or disability. However, there was no evidence that measures of lean tissue mass, assessed using fat-free mass, and fat-free mass index were similarly associated with back pain. Furthermore, the association between measures of metabolic obesity (waist–hip ratio and fat mass index) and back pain was stronger in those who had an emotional disorder than those who did not have an emotional disorder.
These findings raise the possibility that although biome-chanical factors related to spinal loading are associated with
back pain, a systemic metabolic process associated with excess adipose tissue may also play a role in back pain and disability. Obesity has previously been demonstrated to be a risk factor for back pain.7 Some prior studies used only weight, BMI, and
waist–hip ratio to measure obesity:6,7,13these measures do not provide information on body composition. It is important to consider the role of body composition, as emerging evidence suggests that fat and muscle mass have different roles in the pathogenesis of musculoskeletal pain. For instance, fat mass but not muscle mass was associated with incident foot pain22and musculoskeletal pain at multiple sites has also been associated with fat mass in women but not men.23Similarly, we showed in a smaller population of predominantly women, that fat mass, but TABLE 1. Comparison of Participants With No or Low Pain and Disability Versus Those With High Pain Intensity and/or Disability
No or Low Intensity Pain and/or Disability (n¼696)
High Pain Intensity and/or
Disability (n¼124) Pvalue
Age (years), mean (SD) 58.1 (17.1) 62.9 (14.0) 0.001 Emotional disorder, n (%) 139 (20.4) 52 (35.6) <0.001y
Completed secondary school, n (%) 390 (56.1) 51 (41.1) 0.002y Low mobility, n (%) 171 (24.6) 60 (48.8) <0.001y
Obesity measures [all mean (SD)]
Weight (kg) 83.6 (14.1) 87.1 (15.2) 0.01 BMI (kg/m2) 27.2 (4.1) 28.6 (4.5) 0.001
Waist–hip ratio 0.95 (0.1) 0.97 (0.1) 0.001 Fat mass (kg) 23.0 (8.6) 25.9 (7.9) 0.001 Fat-mass index (kg/m2) 7.5 (2.8) 8.5 (2.6) <0.001
Fat-free mass (kg) 34.7 (3.5) 34.8 (3.6) 0.65 Fat-free mass index (kg/m2) 19.8 (1.8) 20.0 (1.9) 0.34 Fat mass/fat-free mass ratio 0.66 (0.23) 0.74 (0.20) <0.001
BMI¼body mass index.
Independent samples t tests to compare groups.
y
x2test to compare proportions.
TABLE 2. Association Between Obesity and Body Composition and Low Back Pain and/or Disability
Estimated Marginal Means (SEM)
No or Low-Intensity Pain and/or
Disability (n¼696)
High-Intensity Pain and/or
Disability (n¼124) PValue
Weight (kg) 83.8 (0.5) 86.6 (1.3) 0.05 BMI (kg/m2) 27.3 (0.2) 28.7 (0.4) 0.02 Waist–hip ratio 0.96 (0.006) 0.97 (0.006) 0.04 Fat mass (kg) 23.2 (0.3) 24.5 (0.7) 0.10y Fat mass index (kg/m2) 7.6 (0.1) 8.0 (0.2) 0.08z Fat-free mass (kg) 34.7 (0.1) 34.8 (0.3) 0.79§ Fat-free mass index (kg/m2) 19.8 (0.1) 19.9 (0.2) 0.68jj Fat mass/fat-free mass ratio 0.66 (0.02) 0.71 (0.02) 0.07
BMI¼body mass index; SEM¼standard error of the mean. Adjusted for age, emotional disorder, education, and mobility.
yAdjusted for age, emotional disorder, education, mobility and fat-free mass. zAdjusted for age, emotional disorder, education, mobility and fat-free mass index.
§
Adjusted for age, emotional disorder, education, mobility and fat mass.
not lean mass was associated with higher levels of back pain and disability.15Thus, the current study is the first to evaluate the association between obesity measures including body compo-sition and low back pain in a large population-based sample of men. We have demonstrated that in men increased BMI and waist–hip ratio are associated with high levels of back pain and/ or disability. It is possible that the previous studies did not adequately account for potential confounders, such as education and mental health, or it may be that these relationships differ between men and women. It is biologically plausible that a gender disparity in the pathophysiology of back pain would exist. This might be related to the differences in fat distribution, with men typically having an android distribution of fat, which is concentrated around the abdomen and upper body, compared with the gynoid distribution that is common in women where fat is increased around the hips and thighs.24 An android fat distribution may result in a stronger impact of biomechanical factors related to spinal loading causing higher compressive force on lumbar spine structures on the development of low back pain.
When we examined the association between measures of obesity and back pain with regards to mental health, we found that the associations tended to be stronger in those with an emotional disorder. We considered whether this might simply be because those who are obese may be more likely to be depressed and/or anxious and thus more likely to experience back pain. However, we found no differences in degree of obesity between participants with an emotional disorder versus those without. Thus, we need to consider how the combination of obesity and the presence of an emotional disorder may interact and influence the likelihood of having back pain. Obesity, depression and anxiety are now recognized as being inflammatory states.25 – 27 Adipose tissue, particularly when deposited in an androgenic distribution around the torso rather than evenly distributed throughout the body, is considered a
metabolically active organ.28This metabolically active adipose
tissue produces hormones, such as leptin, oestrogen, and resistin and proinflammatory cytokines, such as tumor necrosis factor-alpha and interleukin-6.29 – 31These adipokines have been inde-pendently related to the accelerated onset of depression,32as well as osteoarthritic changes in both the spine33 and the knee.34,35 Higher levels of proinflammatory cytokines have also been shown to have a relationship with the progression to chronic pain36and elevated levels of circulating C-reactive protein, a marker of systemic inflammation, has been identified as a risk factor for depression.37Furthermore, the dysregulation of inflammatory cytokine production in depression and anxiety can also potentiate pain pathways.38,39 People with an emotional disorder may be sensitized to experience pain,40 which may be further exacerbated by meta-inflammation due to increased adiposity, as measured by increased waist–hip ratio and fat mass index. Therefore, the combination of having an emotional disorder and being obese supports a biopsychosocial role of adipose tissue in the pathophysiology of low back pain. This raises the possibility of future strategies for back pain management to specifically target fat loss in those with an emotional disorder.
There are a number of limitations to our study. First, the cross-sectional design of our study precluded the examination of any temporal relationships between fat mass and low back pain: longitudinal studies are needed. Although the Chronic Pain Grade Questionnaire has been shown to be a valid and reliable measure of pain intensity and disability in population-based studies, and has been used in many studies in this context of chronicity,18,15it does not specify how many days of pain and/or disability participants had over the past 6 months. Also, the ability of the HADS to discriminate between anxiety and depression is controversial; therefore, the combined HADS score was used rather than the HADS subscales.41Moreover, data were missing for 16.2% of eligible participants; however, TABLE 3. The Presence of an Emotional Disorder Affects The Association Between Obesity and Body Composition Measures and High-Intensity Back Pain and/or Disability
Estimated Marginal Means (SEM)
No Emotional Disorder Emotional Disorder
No or Low Pain and/or Disability (n¼541)
High Pain and/or Disability
(n¼75) PValue
No or Low Pain and/or Disability (n¼139)
High Pain and/or Disability
(n¼42) PValue
p value for interaction
Weight (kg) 84.0 (0.6) 86.0 (1.7) 0.27 83.1 (1.2) 88.0 (2.2) 0.06 0.38 BMI (kg/m2) 27.4 (0.2) 28.0 (0.5) 0.21 26.9 (0.3) 28.7 (0.6) 0.02 0.15 Waist–hip ratio 0.96 (0.003) 0.96 (0.007) 0.21 0.95 (0.005) 0.97 (0.009) 0.02 0.05 FM (kg) 23.2 (0.3) 24.1 (0.9) 0.38y 22.9 (0.6) 25.2 (1.2) 0.09y 0.11y FMI (kg/m2) 7.6 (0.1) 7.9 (0.2) 0.38z 7.4 (0.3) 8.3 (0.4) 0.06z 0.06z FFM (kg) 34.8 (0.1) 34.7 (0.4) 0.83§ 34.7 (0.3) 35.1 (0.5) 0.48§ 0.33§ FFMI (kg/m2) 19.9 (0.1) 19.8 (0.2) 0.84jj
19.8 (0.2) 20.0 (0.3) 0.38jj 0.19jj FM/FFM ratio 0.67 (0.01) 0.69 (0.03) 0.39 0.65 (0.02) 0.73 (0.03) 0.04 0.13
BMI¼body mass index; FFM¼fat-free mass; FFMI¼fat-free mass index; FM¼fat mass; FMI¼fat mass index; SEM¼standard error of the mean.
Adjusted for age, emotional disorder, education, and mobility.
yAdjusted for age, emotional disorder, education, mobility, and fat-free mass. zAdjusted for age, emotional disorder, education, mobility, and fat-free mass index.
§
Adjusted for age, emotional disorder, education, mobility, and fat mass.
there were no significant differences in age, emotional dis-orders, education, and measures of obesity between those who completed this study and those who did not. While we did not have a measurement of physical activity which is known confounder for low back pain,42 we did take into account a measure of mobility as an indicator of how active the partici-pants were. Also, we did not analyze other variables such as the participants’ occupation or number or type of medical comor-bidities in our analysis; however, we were able to adjust for a broad range of potential confounders such as age, emotional disorders, education, and mobility.
This study had a number of considerable strengths. This study evaluated a large population-based sample of men, whereas previous studies were either small or had a predomi-nance of women in their study.15,43Furthermore, GOS partici-pants were randomly recruited from the Australian electoral roll and the study region has been shown to be representative of the broader Australian population.17We used a validated question-naire to measure back pain intensity and disability18,19whereas some previous studies have not43and we used a number of unique measures of adiposity.
This study demonstrated that obesity was associated with high levels of low back pain and disability in a population-based cohort of men. In particular, for men with a concomitant emotional disorder, back pain was more likely to be associated with increased adiposity (i.e. waist–hip ratio and fat mass index). These findings highlight the importance of obesity as a modifiable risk factor for back pain and suggest a biopsycho-social interaction between and obesity with low back pain. Although these findings will need to be confirmed in longi-tudinal studies, they have important implications for prevention and treatment of back pain and disability in men.
REFERENCES
1. Buchbinder R, Blyth FM, March LM, et al. Placing the global burden of low back pain in context.Best Pract Res Clin Rheumatol. 2013;27:575–589.
2. Vos T, Flaxman AD, Naghavi M, et al. Years lived with disability (YLDs) for 1160 sequelae of 289 diseases and injuries 1990-2010: a systematic analysis for the Global Burden of Disease Study 2010. Lancet.2012;380:2163–2196.
3. Rubin DI. Epidemiology and risk factors for spine pain.Neurol Clin. 2007;25:353–371.
4. Jensen MC, Brant-Zawadzki MN, Obuchowski N, et al. Magnetic resonance imaging of the lumbar spine in people without back pain. N Engl J Med.1994;331:69–73.
5. Hoy D, Brooks P, Blyth F, et al. The epidemiology of low back pain.Best Pract Res Clin Rheumatol.2010;24:769–781.
6. Heuch I, Heuch I, Hagen K, et al. Body mass index as a risk factor for developing chronic low back pain: a follow-up in the Nord-Trondelag Health Study.Spine.2013;38:133–139.
7. Leboeuf-Yde C. Body weight and low back pain. A systematic literature review of 56 journal articles reporting on 65 epidemiologic studies.Spine.2000;25:226–237.
8. Dario AB, Ferreira ML, Refshauge KM, et al. The relationship between obesity, low back pain, and lumbar disc degeneration when genetics and the environment are considered: a systematic review of twin studies.Spine J.2015;15:1106–1117.
9. Lehnert T, Sonntag D, Konnopka A, et al. Economic costs of overweight and obesity.Best Pract Res Clin Endocrinol Metab. 2013;27:105–115.
10. Shiri R, Solovieva S, Husgafvel-Pursiainen K, et al. The role of obesity and physical activity in non-specific and radiating low back pain: the Young Finns study.Semin Arthritis Rheumatism. 2013;42:640–650.
11. Camhi SM, Bray GA, Bouchard C, et al. The relationship of waist circumference and BMI to visceral, subcutaneous, and total body fat: sex and race differences.Obesity (Silver Spring).2011;19:402–408. 12. Pasco JA, Nicholson GC, Brennan SL, et al. Prevalence of obesity
and the relationship between the body mass index and body fat: cross-sectional, population-based data.PLoS One.2012;7:e29580. 13. Shiri R, Karppinen J, Leino-Arjas P, et al. The association between
obesity and low back pain: a meta-analysis.Am J Epidemiol. 2010;171:135–154.
14. Craft RM, Mogil JS, Aloisi AM. Sex differences in pain and analgesia: the role of gonadal hormones.Eur J Pain.2004;8:397–411.
15. Urquhart DM, Berry P, Wluka AE, et al., 2011 Young Investigator Award Winner. Increased fat mass is associated with high levels of low back pain intensity and disability.Spine.2011;36:1320–1325. 16. Hoy D, March L, Brooks P, et al. The global burden of low back
pain: estimates from the Global Burden of Disease 2010 study.Ann Rheum Dis.2014;73:968–974.
17. Pasco JA, Nicholson GC, Kotowicz MA. Cohort profile: Geelong osteoporosis study.Int J Epidemiol Dec.2012;41:1565–1575. 18. Smith BH, Penny KI, Purves AM, et al. The chronic pain grade
questionnaire: validation and reliability in postal research.Pain. 1997;71:141–147.
19. Von Korff M, Ormel J, Keefe FJ, et al. Grading the severity of chronic pain.Pain.1992;50:133–149.
20. Hayley AC, Williams LJ, Kennedy GA, et al. Excessive daytime sleepiness and body composition: a population-based study of adults. PLoS One.2014;9:e112238.
21. Snaith RP. The hospital anxiety and depression scale.Health Quality Life Outcomes.2003;1:29.
22. Butterworth PA, Urquhart DM, Cicuttini FM, et al. Fat mass is a predictor of incident foot pain.Obesity.2013;21:E495–E499. 23. Yoo JJ, Cho NH, Lim SH, et al. Relationships between body mass
index, fat mass, muscle mass, and musculoskeletal pain in commu-nity residents.Arthritis Rheumatol.2014;66:3511–3520.
24. Marcus MA, Wang J, Pi-Sunyer FX, et al. Effects of ethnicity, gender, obesity, and age on central fat distribution: comparison of dual x-ray absorptiometry measurements in white, black, and Puerto Rican adults.Am J Hum Biol.1998;10:361–369.
25. Vogelzangs N, Beekman ATF, de Jonge P, et al. Anxiety disorders and inflammation in a large adult cohort.Transl Psychiatry.2013;3:e249. 26. Liukkonen T, Ra¨sa¨nen P, Jokelainen J, et al. The association
between anxiety and C-reactive protein (CRP) levels: results from the Northern Finland 1966 Birth Cohort Study.Eur Psychiatry. 2011;26:363–369.
27. O’Donovan A, Hughes BM, Slavich GM, et al. Clinical anxiety, cortisol and interleukin-6: evidence for specificity in emotion– biology relationships.Brain Behavior Immunity.2010;24:1074–1077. 28. Liu P, Ma F, Lou H, et al. The utility of fat mass index vs. body
mass index and percentage of body fat in the screening of metabolic syndrome.BMC Public Health.2013;13:629.
29. Ronti T, Lupattelli G, Mannarino E. The endocrine function of adipose tissue: an update.Clin Endocrinol.2006;64:355–365. 30. Galic S, Oakhill JS, Steinberg GR. Adipose tissue as an endocrine
organ.Mol Cell Endocrinol.2010;316:129–139.
32. Pasco JA, Jacka FN, Williams LJ, et al. Leptin in depressed women: cross-sectional and longitudinal data from an epidemiologic study. J Affect Disord.2008;107:221–225.
33. Igarashi A, Kikuchi S, Konno S. Correlation between inflammatory cytokines released from the lumbar facet joint tissue and symptoms in degenerative lumbar spinal disorders.J Orthop Sci.2007;12:154–160. 34. Berry PA, Jones SW, Cicuttini FM, et al. Temporal relationship
between serum adipokines, biomarkers of bone and cartilage turn-over, and cartilage volume loss in a population with clinical knee osteoarthritis.Arthritis Rheum.2011;63:700–707.
35. Stannus OP, Cao Y, Antony B, et al. Cross-sectional and long-itudinal associations between circulating leptin and knee cartilage thickness in older adults.Ann Rheum Dis.2015;74:82–88.
36. Dina OA, Green PG, Levine JD. Role of interleukin-6 in chronic muscle hyperalgesic priming.Neuroscience.2008;152:521–525. 37. Pasco JA, Nicholson GC, Williams LJ, et al. Association of high
sensitivity C-reactive protein with de novo major depression.Br J Psychiatry.2010;197:372–377.
38. Berk M, Williams LJ, Jacka FN, et al. So depression is an inflammatory disease, but where does the inflammation come from? BMC Med.2013;11:200.
39. Hayley S, Poulter MO, Merali Z, et al. The pathogenesis of clinical depression: stressor- and cytokine-induced alterations of neuroplasti-city.Neuroscience.2005;135:659–678.
40. Gerrits MM, Vogelzangs N, van Oppen P, et al. Impact of pain on the course of depressive and anxiety disorders.Pain.2012;153:429– 436.
41. Cosco TD, Doyle F, Ward M, et al. Latent structure of the hospital anxiety and depression scale: a 10-year systematic review.J Psychosomatic Res.2012;72:180–184.
42. Lin C-WC, McAuley JH, Macedo L, et al. Relationship between physical activity and disability in low back pain: a systematic review and meta-analysis.Pain.2011;152:607–613.