LAMPIRAN 1
LAMPIRAN 2
LEMBAR PENJELASAN KEPADA CALON SUBJEK PENELITIAN
Selamatpagi / siangBapak / Ibu, pada hariini, saya, dr.Abida,
akanmelakukanpenelitian yang berjudul “
PROPORSI HIPERURISEMIA
PADAPOPULASI
HIPERTENSI ESSENSIAL SUKU ACEH DI
KABUPATEN ACEH
UTARA”.
Penelitianinibertujuanuntukmengetahuiproporsihiperurisemia
pada
populasihipertensiessensial dan normotensisuku Aceh di kabupaten Aceh Utara.
Bapak /ibu yang
bersediamengikutipenelitianininantinyaakandiharuskanmengisisuratpersetujuanik
utdalampenelitian, mengikutiwawancara,
pemeriksaanlaboratoriumberupapemeriksaandarahsebanyak 10 cc
olehahlinyauntukmenilaidarahrutin dan fungsi.
Setelahituakandibedakanmenjadiduakelompok, yaitukelompoknormotensi dan
hipertensi .
Selanjutnyakepadakeduakelompokdilakukanpemeriksaandarahuntukmeng
etahuikadarasamuratserum dan hasil yang
didapatkandarikeduakelompokkemudiandiambil rata-ratanya dan dibandingkan.
Biayapenelitianmenjaditanggungjawabpeneliti. Bilamasihterdapatpertanyaan,
makaBapak / Ibudapatmenghubungisaya :
Nama : dr. Abida
Alamat : Jl. Gajah No. 39 Medan 20211
No Telp
: 081370541374 ( Hp )
Peneliti
LAMPIRAN 3
SURAT PERSETUJUAN SETELAH PENJELASAN
( INFORMED CONSENT )
Saya yang bertanda tangan di bawah ini :
Nama
: ...
Alamat
: ...
Umur
: ...
Jenis Kelamin : Laki – laki / perempuan
Setelah mendapat penjelasan dari peneliti tentang kebaikan dan keburukan
prosedur penelitian ini dan saya telah memahaminya, menyatakan
bersedia
untuk
ikut dalam penelitian tentang Proporsi Hiperurisemia pada Populasi Hipertensi
Essensial Suku Aceh di Kabupaten Aceh Utara.
Demikianlah surat pernyataan bersedia ikut dalam penelitian ini saya buat untuk
dapat dipergunakan seperlunya.
Lhokseumawe, ...2010
Saksi
LAMPIRAN 4
KERTAS KERJA PROFIL PESERTA PENELITIAN
ANAMNESIS PRIBADI
Nama
:
Usia
:
JenisKelamin
:
Alamat :
No telp/Hp :
Suku :
Status Marital :
BB kg TB cm IMTkg/m
Diagnosis Hipertensisejak :
2
Riwayatpenggunaanobat anti hipertensi :
SilsilahKeturunan
III. RiwayatPenggunaanObat :
o
Kortikosteroid
o
Siklosporin
o
Pirazinamid
o
Ethambutol
o
Aspirin dosis < 2gr/hari
aceh
Buyut
Kakek
aceh
Ayah
aceh
Subjekpenel
itian
IV. Riwayat Penyakit :
o
Hipertensi sekunder karena obat obatan
o
Keganasan
o
Gangguan ginjal (Kadar Creatinin serum >1 .4 mg/dl)
o
Gagal jantung
o
Penyakit Jantung Koroner
o
Diabetes Melitus
o
Pre Eklamsia
o
Penyakit Pembuluh Darah Perifer
o
Alkoholik
o
Penyakit Ginjal Kronis (Cr Cl < 60 ml/mnt)
o
Hipertrigliseridemia (trigliserida darah > 150 mg/dl)
V. Laboratorium dan Pemeriksaan Penunjang
Urin rutin : Protein urin ( )
RFT : Ureum mg/dl Creatinin mg/dl Uric acid
mg/dl
Cr Cl : ml/mnt
EKG
:
Foto Toraks :
VI. PEMERIKSAAN TEKANAN DARAH :
LAMPIRAN 5
DAFTAR RIWAYAT HIDUP
I.
DATA PRIBADI
Nama
: Dr. Abida
Tempat/Tgl Lahir : Medan / 07 September 1976
Suku/Bangsa
: Indonesia
Agama
: Islam
Alamat
: JL Gajah no. 39 A
Medan
No. Handphone
: 081370541374
II.
RIWAYAT PENDIDIKAN
PENDIDIKAN
LAMA PENDIDIKAN
TEMPAT
SD
SMP
SMA
Fakultas Kedokteran
Program
SpesialisPenyakitDa
lam
1982-1988
1988-1991
1991-1994
1994-2000
2007-Sekarang
SDN 060805 Medan
SMP Josua 1 Medan
SMUN 8 Medan
FK-USU
FK-USU
III.
KEANGGOTAAN PROFESI
1.
IkatanDokter Indonesia (IDI)
2.
PersatuanAhliPenyakitDalam Indonesia (PAPDI)
IV.
KARYA ILMIAH DI DEPARTEMEN ILMU PENYAKIT
DALAM
1.
Abida, Tunggul Sukendar, Harun Rasyid Lubis. Nefritis Lupus
Kelas IV. Konas X PERNEFRI & Annual Meeting, Bandung
28-30 November 2008.
1.
PesertaSimposium Road Show 2008 Eli Lilly “Insulin Training for
Excellence” PengurusBesarPerhimpunanDokterSpesialisPenyakitDalam
Indonesia (PBPAPDI) &PengurusBesarPerkumpulanEndokrinologi
Indonesia (PBPERKENI). Medan, 26 Januari 2008.
2.
PesertaSimposium “How to Choose an Appropriate OAD”
PertemuanIlmiahTahunan (PIT) IX 2008
DepartemenPenyakitDalamFakultasKedokteranUniversitas Sumatera
Utara. Medan, 15 April 2008.
3.
PesertaSimposium “Critical Care and Emergency Medicine”. Medan,
09-10 Mei 2008.
4.
PesertaSimposium “Management Hypertension and Chronic Heart
Failure”. Medan, 24 Januari 2009.
5.
PesertaSimposium “Finding the Missing Link in Energy Metabolism”.
Medan, 17 Maret 2009.
6.
Peserta Workshop “Achieving Ambitious Glycaemic Target in Diabetes :
Stepwise Intensification of Insulin Treatment from Basal to Basal
Plus/Bolus”. Medan 12 Juli 2009.
7.
PesertaSimposium “Scientific Meeting Attaining Greater BP Reduction
and Organ Protection”. Medan, 01 Agustus 2009.
8.
Peserta Workshop on Osteoporosis “Osteoporosis Crunch Time”. Medan,
08 Agustus 2009.
9.
PesertaSimposiumGastroentero-Hepatologi Update VII 2009. Medan,
09-10 Oktober 2009.
10.
Peserta Kursus USG Tahap I. Dept IPD FK-USU – Institut Kedokteran
Ultrasonografi Indonesia. Medan, 2009.
11.
PesertaSimposium “Early Insulin Inisiation, How, When and What Insulin
According to Daily Practice Need. Medan, 21 November 2009.
12.
Peserta 14
th
13.
Peserta Roadshow Ilmiah PBPAPDI “PenggunaanTestosteronpada Aging
Male”. Medan, 06 Maret 2010.
14.
PesertaSimposium“Advanced Strategies in Optimizing Diabetes
Management. Bali, 12 Juni 2010.
15.
Peserta Seminar “Carb Smart Nutrition Update for Diabetic Complication
Prevention”. Medan, 12 Juni 2010.
16.
PanitiaSimposium “Clinical rheumatology in Daily Practice”. Medan, 31
Juli-01Agustus 2010.
17.
PesertaSimposium “Hepatitis Update”. Medan, 23 Februari 2011.
18.
Peserta Roadshow “Medical Skill Upgrade” (MEDSKUP) Workshop
Cardio-Metabolic. Medan, 02 April 2011.
19.
Peserta PIT XII 2011 PenyakitDalamPertemuanIlmiahNasional PERPARI.
Medan 28-30 April 2011.
20.
Peserta Workshop “Management Acute Coronary Syndrome”. Medan,
23-25 Juni 2011.
21.
Panitia Workshop “Penyuntikan Intra Artikular”. Medan, 07 Juli 2011.
22.
Peserta Workshop “ NyeriCampuran”. Medan, 07 Juli 2011.
23.
Peserta Workshop “TehnikPemeriksaanFisikpadaBerbagaiJenisPenyakit”.
Medan, 08 Juli 2011.
24.
Panitia Workshop “PendidikanPelatihan USG Muskuloskeletal”. Medan,
08 Juli 2011.
25.
PesertaSimposium “Clinical rheumatology in Daily Practice”. Medan,
09 Juli 2011.
26.
PesertaSimposium“ Lymphoma Update :
DeteksiDinidanPenatalaksanaan”. Medan, 16 Juli 2011.
27.
PesertaSimposium“ Pathogenesis, Prevention and Management Diabetic
Vascular Complications”. Minggu, 20 November 2011.
28.
Peserta Workshop Infection Update IV “Current Challenges Management
on Infection”. Medan, 25 November 2011.
29.
Peserta Simposium “8
th
30.
Panitia 15
Jakarta Endocrine Meeting. Jakarta, 16-17 Juni
2012.
th
LAMPIRAN 6
ANALISIS STATISTIK
Non Parametrik Test (HT)
Non Parametrik test (Normal)
T Test (Hipertensi)
One-Sample Kolmogorov-Smirnov Test
69
52,23
10,218
,095
,095
-,076
,792
,556
69
5,377
2,6015
,166
,166
-,083
1,381
,044
69
156,16
19,500
,159
,159
-,088
1,318
,062
69
91,01
10,866
,233
,233
-,173
1,934
,001
69
39,29
4,141
,122
,122
-,088
1,014
,255
69
7,299
,8235
,074
,074
-,061
,616
,842
69
134,22
20,244
,102
,102
-,091
,848
,468
69
120,51
15,417
,110
,110
-,050
,914
,374
69
197,48
21,043
,158
,096
-,158
1,315
,063
69
32,28
8,883
,083
,065
-,083
,691
,726
69
,868
,2452
,088
,073
-,088
,731
,660
69
14,41
3,735
,119
,094
-,119
,986
,286
69
100,97
18,823
,115
,115
-,084
,953
,323
69
58,77
7,205
,151
,062
-,151
1,250
,088
69
165,70
7,423
,105
,083
-,105
,875
,429
69
21,302
1,0405
,120
,063
-,120
,995
,276
69
80,676
19,6687
,138
,138
-,122
1,143
,146
Usia (tahun)
Lama HT
TDS
Berat badan
Tinggi badan
IMT
Cr Cl
N
Mean
Std. Deviation
Normal Parameters
a,bAbsolute
Positive
Negative
Most Extreme Differences
Kolmogorov-Smirnov Z
Asymp. Sig. (2-tailed)
Test distribution is Normal.
a.
Calculated from data.
b.
One-S ample Kolm ogorov-Sm irnov Test
68 49,16 9,093 ,162 ,162 -,083 1,334 ,057
68 119,41 9,601 ,201 ,196 -,201 1,657 ,008
68 77,72 5,425 ,369 ,278 -,369 3,040 ,000
68 57,57 11,949 ,101 ,096 -,101 ,832 ,492
68 5,210 1,1496 ,085 ,073 -,085 ,699 ,713
68 116,25 27,089 ,113 ,049 -,113 ,928 ,356
68 106,76 12,785 ,113 ,113 -,068 ,935 ,346
68 180,84 27,994 ,137 ,089 -,137 1,127 ,158
68 20,82 5,987 ,113 ,113 -,098 ,934 ,347
68 ,734 ,1850 ,148 ,148 -,088 1,218 ,103
68 10,29 3,115 ,185 ,185 -,130 1,523 ,019
68 102,91 18,688 ,121 ,121 -,068 ,996 ,275
68 58,82 6,990 ,128 ,060 -,128 1,053 ,217
68 165,29 7,709 ,126 ,092 -,126 1,041 ,228
68 21,442 1,0783 ,113 ,080 -,113 ,935 ,347
68 99,090 21,4183 ,088 ,071 -,088 ,727 ,665
Us ia (t ahun) Berat badan Tinggi badan IMT Cr Cl
N Mean St d. Deviat ion Normal Parametersa,b
Absolute Positive Negative Most Extreme Differenc es
Kolmogorov-Smirnov Z As ymp. Sig. (2-tailed)
Test distribution is Normal. a.
NPar Tests
Group Statistics
69 5,377 2,6015 ,3132
0a . . .
69 156,16 19,500 2,348 68 119,41 9,601 1,164 69 91,01 10,866 1,308
68 77,72 5,425 ,658
69 39,29 4,141 ,499
68 57,57 11,949 1,449
69 7,299 ,8235 ,0991
68 5,210 1,1496 ,1394
69 ,868 ,2452 ,0295
68 ,734 ,1850 ,0224
69 80,676 19,6687 2,3678 68 99,090 21,4183 2,5974 Group Lama HT
TDS
N Mean Std. Deviation
Std. Error Mean
t cannot be computed becaus e at leas t one of the groups is empty. a.
Independent Samples Test
6,348 ,013 4,402 135 ,000 17,967 4,082 9,895 26,040
4,393 124,028 ,000 17,967 4,090 9,871 26,063
,648 ,422 5,675 135 ,000 13,743 2,422 8,953 18,532
5,682 131,183 ,000 13,743 2,418 8,958 18,527
9,917 ,002 3,936 135 ,000 16,640 4,227 8,280 25,000
3,928 124,389 ,000 16,640 4,236 8,256 25,024
12,727 ,000 8,835 135 ,000 11,452 1,296 8,888 14,015
8,860 119,394 ,000 11,452 1,293 8,892 14,011
1,465 ,228 7,366 135 ,000 ,2561 ,0348 ,1874 ,3249
7,373 133,068 ,000 ,2561 ,0347 ,1874 ,3248
4,350 ,039 6,992 135 ,000 4,112 ,588 2,949 5,275
7,001 131,418 ,000 4,112 ,587 2,950 5,273
Equal variances as sumed Equal variances not ass umed Equal variances as sumed Equal variances not ass umed Equal variances as sumed Equal variances not ass umed Equal variances as sumed Equal variances not ass umed Equal variances as sumed Equal variances not ass umed Equal variances as sumed Equal variances not ass umed TG
Levene's Test for Equality of Variances
t df Sig. (2-tailed) Mean Difference
Std. Error
Difference Lower Upper 95% Confidence
Mann-Whitney Test
NPar Tests
Mann-Whitney Test
Ra nks
69 100,73 6950,50
68 36,80 2502,50
137
69 93,24 6433,50
68 44,40 3019,50
137 Group
Ht Non Ht Total Ht Non Ht Total TDS
TDD
N Mean Rank Sum of Ranks
Test Statistics
a156,500
673,500
2502,500
3019,500
-9,523
-7,616
,000
,000
Mann-Whitney U
Wilcoxon W
Z
As ymp. Sig. (2-tailed)
TDS
TDD
Grouping Variable: Group
a.
Ranks
69 89,49 6174,50
68 48,21 3278,50
137 Group
Ht Non Ht Total BUN
N Mean Rank Sum of Ranks
Test Statistics
a932,500
3278,500
-6,110
,000
Mann-Whitney U
Wilcoxon W
Z
As ymp. Sig. (2-tailed)
BUN
Group Statistics
69 5,377 2,6015 ,3132
0a . . .
69 156,16 19,500 2,348 68 119,41 9,601 1,164 69 91,01 10,866 1,308
68 77,72 5,425 ,658
69 39,29 4,141 ,499
68 57,57 11,949 1,449
69 7,299 ,8235 ,0991
68 5,210 1,1496 ,1394
69 ,868 ,2452 ,0295
68 ,734 ,1850 ,0224
69 80,676 19,6687 2,3678 68 99,090 21,4183 2,5974 Group Lama HT
TDS
N Mean Std. Deviation
Std. Error Mean
t cannot be computed becaus e at leas t one of the groups is empty. a.
Independent Samples Test
38,907 ,000 13,961 135 ,000 36,748 2,632 31,542 41,953
14,024 99,462 ,000 36,748 2,620 31,548 41,947
14,992 ,000 9,039 135 ,000 13,294 1,471 10,385 16,203
9,079 100,237 ,000 13,294 1,464 10,389 16,199
49,490 ,000 -12,000 135 ,000 -18,284 1,524 -21,297 -15,270
-11,931 82,659 ,000 -18,284 1,532 -21,332 -15,236
10,528 ,001 12,237 135 ,000 2,0883 ,1707 1,7508 2,4258
12,208 121,325 ,000 2,0883 ,1711 1,7496 2,4269
5,262 ,023 3,615 135 ,000 ,1343 ,0372 ,0608 ,2078
3,622 126,410 ,000 ,1343 ,0371 ,0609 ,2077
,641 ,425 -5,243 135 ,000 -18,4145 3,5125 -25,3611 -11,4679
-5,239 133,672 ,000 -18,4145 3,5147 -25,3660 -11,4630 Equal variances
as sumed Equal variances not ass umed Equal variances as sumed Equal variances not ass umed Equal variances as sumed Equal variances not ass umed Equal variances as sumed Equal variances not ass umed Equal variances as sumed Equal variances not ass umed Equal variances as sumed Equal variances not ass umed TDS Levene's Test for Equality of Variances
t df Sig. (2-tailed) Mean Difference
Std. Error
Difference Lower Upper 95% Confidence
Interval of the Difference t-test for Equality of Means
Group Statistics
69 100,97 18,823 2,266
68 102,91 18,688 2,266
69 58,77 7,205 ,867
68 58,82 6,990 ,848
69 165,70 7,423 ,894
68 165,29 7,709 ,935
69 21,302 1,0405 ,1253
68 21,442 1,0783 ,1308
Group
Berat badan
Tinggi badan
IMT
N Mean Std. Deviation
T-Test (pria)
Independent Samples Test
,001 ,970 -,606 135 ,546 -1,941 3,205 -8,279 4,398
-,606 134,992 ,546 -1,941 3,205 -8,279 4,397
,002 ,965 -,046 135 ,964 -,055 1,213 -2,455 2,344
-,046 134,967 ,964 -,055 1,213 -2,454 2,343
,426 ,515 ,311 135 ,757 ,402 1,293 -2,155 2,959
,310 134,628 ,757 ,402 1,293 -2,156 2,959
,001 ,973 -,772 135 ,442 -,1397 ,1810 -,4978 ,2183
-,772 134,659 ,442 -,1397 ,1811 -,4979 ,2184
Equal variances assumed Equal variances not assumed Equal variances assumed Equal variances not assumed Equal variances assumed Equal variances not assumed Equal variances assumed Equal variances not assumed KGD
Berat badan
Tinggi badan
IMT
F Sig.
Levene's Test for Equality of Variances
t df Sig. (2-tailed)
Mean Difference
Std. Error
Difference Lower Upper 95% Confidence
Interval of the Difference t-test for Equality of Means
Group Statistics
36
7,708
,7369
,1228
35
5,786
,9438
,1595
Group
Ht
Non Ht
AU
N
Mean
Std. Deviation
Std. Error
Mean
Independent Samples Test
4,388 ,040 9,583 69 ,000 1,9226 ,2006 1,5224 2,3229
9,550 64,306 ,000 1,9226 ,2013 1,5205 2,3248 Equal variances
as sumed Equal variances not ass umed AU
F Sig.
Levene's Test for Equality of Variances
t df Sig. (2-tailed) Mean Difference
Std. Error
Difference Lower Upper 95% Confidence
T-Test (wanita)
Tabel Chi -square hubunganhipertensiessensialdenganhiperurisemia
Group Statistics
33 6,852 ,6723 ,1170
33 4,600 1,0365 ,1804
Group Ht Non Ht AU
N Mean Std. Deviation
Std. Error Mean
Independent Samples Test
4,674 ,034 10,469 64 ,000 2,2515 ,2151 1,8219 2,6812
10,469 54,875 ,000 2,2515 ,2151 1,8205 2,6825 Equal variances
as sumed Equal variances not ass umed AU
F Sig.
Levene's Test for Equality of Variances
t df Sig. (2-tailed)
Mean Difference
Std. Error
Difference Lower Upper 95% Confidence
Crosstab
28
62
90
45,3
44,7
90,0
31,1%
68,9%
100,0%
40,6%
91,2%
65,7%
20,4%
45,3%
65,7%
41
6
47
23,7
23,3
47,0
87,2%
12,8%
100,0%
59,4%
8,8%
34,3%
29,9%
4,4%
34,3%
69
68
137
69,0
68,0
137,0
50,4%
49,6%
100,0%
100,0%
100,0%
100,0%
50,4%
49,6%
100,0%
Count
Expected Count
% within AU
% within Group
% of Total
Count
Expected Count
% within AU
% within Group
% of Total
Count
Expected Count
% within AU
% within Group
% of Total
Normo Uricemia
Hyperuricemia
Chi-Square Tests
38,903
b1
,000
36,690
1
,000
42,418
1
,000
,000
,000
38,619
1
,000
137
Pearson Chi-Square
Continuity Correction
aLikelihood Ratio
Fis her's Exact Test
Linear-by-Linear
As sociation
N of Valid Cases
Value
df
As ymp. Sig.
(2-sided)
Exact Sig.
(2-sided)
Exact Sig.
(1-sided)
Computed only for a 2x2 table
a.
0 cells (,0%) have expected count less than 5. The minimum expected count is
23,33.
b.
Risk Estimate
,066
,025
,174
,357
,257
,494
5,396
2,523
11,540
137
Odds Ratio for AU
(Normo Uricemi a /
Hyperuricem ia)
For cohort Group = Ht
For cohort Group =
Non Ht
N of Valid Cases
Value
Lower
Upper
95% Confidence
T-Test pria
Reratakadar AUs berdasarkan lama menderita HT (Pria)
T-Test wanita
Group Sta tisti cs
21
39,43
3,544
,773
15
36,40
2,995
,773
21
7,557
,6454
,1408
15
7,920
,8248
,2130
Lama HT
< 5 tahun
Independent Samples Test
,734 ,398 2,691 34 ,011 3,029 1,125 ,742 5,316
2,769 32,940 ,009 3,029 1,094 ,803 5,254
,490 ,489 -1,481 34 ,148 -,3629 ,2450 -,8607 ,1350
-1,421 25,509 ,167 -,3629 ,2553 -,8882 ,1625
Equal variances as sumed Equal variances not ass umed Equal variances as sumed Equal variances not ass umed HDL
AU
F Sig.
Levene's Test for Equality of Variances
t df Sig. (2-tailed) Mean Difference
Std. Error
Difference Lower Upper 95% Confidence
Interval of the Difference t-test for Equality of Means
Independent Samples Test
1,887 ,179 3,599 31 ,001 4,869 1,353 2,110 7,628
4,070 30,633 ,000 4,869 1,196 2,428 7,310
,019 ,892 -1,528 31 ,137 -,3643 ,2384 -,8504 ,1218
-1,514 22,394 ,144 -,3643 ,2406 -,8627 ,1341 Equal variances
as sumed Equal variances not ass umed Equal variances as sumed Equal variances not ass umed HDL
AU
F Sig.
Levene's Test for Equality of Variances
t df Sig. (2-tailed)
Mean Difference
Std. Error
Difference Lower Upper 95% Confidence
Proporsihiperurisemiaberdasarkan Lama HT
Group Sta tisti cs
21
42,29
4,221
,921
12
37,42
2,644
,763
21
6,719
,6509
,1420
12
7,083
,6726
,1942
Lama HT
< 5 tahun
17,0
11,0
28,0
67,9%
32,1%
100,0%
45,2%
33,3%
40,6%
27,5%
13,0%
40,6%
23
18
41
25,0
16,0
41,0
56,1%
43,9%
100,0%
54,8%
66,7%
59,4%
33,3%
26,1%
59,4%
42
27
69
42,0
27,0
69,0
60,9%
39,1%
100,0%
100,0%
100,0%
100,0%
60,9%
39,1%
100,0%
Count
Expected Count
% within AU
% within Lama HT
% of Total
Count
Expected Count
% within AU
% within Lama HT
% of Total
Count
Expected Count
% within AU
% within Lama HT
% of Total
Normo Uricemia
Hyperuricemia
AU
Total
< 5 tahun
>= 5 tahun
Lama HT
Total
Chi-Square Tests
,966b 1 ,326
,535 1 ,464
,976 1 ,323
,452 ,233
,952 1 ,329
69 Pearson Chi-Square
Continuity Correctiona Likelihood Ratio Fis her's Exact Test Linear-by-Linear As sociation N of Valid Cases
Value df
As ymp. Sig. (2-sided)
Exact Sig. (2-sided)
Exact Sig. (1-sided)
Computed only for a 2x2 table a.
0 cells (,0%) have expected count less than 5. The minimum expected count is 10,96.
Oneway (wanita)
Perbandinganreratakadar AUs wanitaberdasarkanderajat TDS
Post Hoc Tests
Descriptives
AU
6
6,467
,7916
,3232
5,636
7,297
5,5
7,5
15
6,947
,5502
,1420
6,642
7,251
6,1
7,9
12
6,925
,7387
,2132
6,456
7,394
6,0
8,3
33
6,852
,6723
,1170
6,613
7,090
5,5
8,3
120-139
140-159
>= 160
Total
N
Mean
Std. Deviation
Std. Error
Lower Bound
Upper Bound
95% Confidence Interval for
Mean
Minimum
Maximum
Test of Homogeneity of Variances
AU
,648
2
30
,530
Levene
Statisti c
df1
df2
Sig.
ANOV A
AU
1,089
2
,545
1,222
,309
13,373
30
,446
14,462
32
Between Groups
W ithin Groups
Total
Sum of
Squares
df
Mean S quare
F
Sig.
Multiple Comparisons
Dependent Variable: AU
LSD
-,4800
,3225
,147
-1,139
,179
-,4583
,3338
,180
-1,140
,223
,4800
,3225
,147
-,179
1,139
,0217
,2586
,934
-,506
,550
,4583
,3338
,180
-,223
1,140
-,0217
,2586
,934
-,550
,506
(J) TDS
140-159
>= 160
120-139
>= 160
120-139
140-159
(I) TDS
120-139
140-159
>= 160
Mean
Difference
(I-J)
Std. Error
Sig.
Lower Bound
Upper Bound
Oneway (pria)
Perbandinganreratakadar AUs priaberdasarkanderajat TDS
Post Hoc Tests
Descriptives
AU
2
6,900
,2828
,2000
4,359
9,441
6,7
7,1
12
7,367
,5774
,1667
7,000
7,733
6,2
8,4
22
7,968
,7260
,1548
7,646
8,290
7,0
10,2
36
7,708
,7369
,1228
7,459
7,958
6,2
10,2
120-139
140-159
>= 160
Total
N
Mean
Std. Deviation
Std. Error
Lower Bound
Upper Bound
95% Confidence Interval for
Mean
Minimum
Maximum
Test of Homogeneity of Variances
AU
1,121
2
33
,338
Levene
Statistic
df1
df2
Sig.
ANOV A
AU
4,193
2
2,097
4,670
,016
14,814
33
,449
19,008
35
Between Groups
W ithin Groups
Total
Sum of
Squares
df
Mean S quare
F
Sig.
Multiple Comparisons
Dependent Variable: AU
LSD
-,4800
,3225
,147
-1,139
,179
-,4583
,3338
,180
-1,140
,223
,4800
,3225
,147
-,179
1,139
,0217
,2586
,934
-,506
,550
,4583
,3338
,180
-,223
1,140
-,0217
,2586
,934
-,550
,506
(J) TDS
140-159
>= 160
120-139
>= 160
120-139
140-159
(I) TDS
120-139
140-159
>= 160
Mean
Difference
(I-J)
Std. Error
Sig.
Lower Bound
Upper Bound
Oneway (pria)
Perbandinganreratakadar AUs priaberdasarkanderajat TDD
Post Hoc Tests
Descriptives
AU
8 7,050 ,5318 ,1880 6,605 7,495 6,2 7,9
11 7,500 ,4050 ,1221 7,228 7,772 7,0 8,4
17 8,153 ,7107 ,1724 7,788 8,518 7,4 10,2
36 7,708 ,7369 ,1228 7,459 7,958 6,2 10,2
80-89 90-99 >= 100 Total
N Mean Std. Deviation Std. Error Lower Bound Upper Bound 95% Confidence Interval for
Mean
Minimum Maximum
Test of Homogeneity of Variances
AU
1,249 2 33 ,300
Levene
Statistic df1 df2 Sig.
ANOV A
AU
7,305
2
3,653
10,300
,000
11,702
33
,355
19,008
35
Between Groups
W ithin Groups
Total
Sum of
Squares
df
Mean S quare
F
Sig.
Multiple Comparisons
Dependent Variable: AU
LSD
-,4500
,2767
,113
-1,013
,113
-1,1029*
,2553
,000
-1,622
-,583
,4500
,2767
,113
-,113
1,013
-,6529*
,2304
,008
-1,122
-,184
1,1029*
,2553
,000
,583
1,622
,6529*
,2304
,008
,184
1,122
(J) TDD
90-99
>= 100
80-89
>= 100
80-89
90-99
(I) TDD
80-89
90-99
>= 100
Mean
Difference
(I-J)
Std. Error
Sig.
Lower Bound
Upper Bound
95% Confidence Interval
Oneway (wanita)
Perbandinganreratakadar AUs wanitaberdasarkanderajat TDD
Post Hoc Tests
Descriptives
AU
12 6,542 ,6171 ,1781 6,150 6,934 5,5 7,3
17 6,871 ,5599 ,1358 6,583 7,158 6,0 7,9
4 7,700 ,6377 ,3189 6,685 8,715 6,8 8,3
33 6,852 ,6723 ,1170 6,613 7,090 5,5 8,3
80-89 90-99 >= 100 Total
N Mean Std. Deviation Std. Error Lower Bound Upper Bound 95% Confidence Interval for
Mean
Minimum Maximum
Test of Homogeneity of Variances
AU
,233
2
30
,794
Levene
Statistic
df1
df2
Sig.
ANOV A
AU
4,038
2
2,019
5,810
,007
10,424
30
,347
14,462
32
Between Groups
W ithin Groups
Total
Sum of
Squares
df
Mean S quare
F
Sig.
Multiple Comparisons
Dependent Variable: AU
LSD
-,3289
,2223
,149
-,783
,125
-1,1583*
,3403
,002
-1,853
-,463
,3289
,2223
,149
-,125
,783
-,8294*
,3276
,017
-1,498
-,160
1,1583*
,3403
,002
,463
1,853
,8294*
,3276
,017
,160
1,498
(J) TDD
90-99
>= 100
80-89
>= 100
80-89
90-99
(I) TDD
80-89
90-99
>= 100
Mean
Difference
(I-J)
Std. Error
Sig.
Lower Bound
Upper Bound
95% Confidence Interval
Proporsihiperurisemiaberdasarkanderajat TDS
\
Crosstab
6
12
10
28
3,2
11,0
13,8
28,0
21,4%
42,9%
35,7%
100,0%
75,0%
44,4%
29,4%
40,6%
8,7%
17,4%
14,5%
40,6%
2
15
24
41
4,8
16,0
20,2
41,0
4,9%
36,6%
58,5%
100,0%
25,0%
55,6%
70,6%
59,4%
2,9%
21,7%
34,8%
59,4%
8
27
34
69
8,0
27,0
34,0
69,0
11,6%
39,1%
49,3%
100,0%
100,0%
100,0%
100,0%
100,0%
11,6%
39,1%
49,3%
100,0%
Count
Expected Count
% within AU
% within TDS
% of Total
Count
Expected Count
% within AU
% within TDS
% of Total
Count
Expected Count
% within AU
% within TDS
% of Total
Normo Uricemia
Hyperuricemia
AU
Total
120-139
140-159
>= 160
TDS
Total
Chi-Square Te sts
5,857
a2
,053
5,903
2
,052
5,446
1
,020
69
Pearson Chi-S quare
Lik elihood Ratio
Linear-by-Linear
As soc iation
N of V alid Cases
Value
df
As ymp. Sig.
(2-sided)
2 c ells (33,3%) have ex pec ted c ount les s than 5. The
minimum expected count is 3,25.
a.
Risk Estimate
a
Odds Ratio for AU
(Normo Uricemia
/ Hyperuricemia)
Value
Proporsihiperurisemiaberdasarkanderajat TDD
Crosstab
14
11
3
28
8,1
11,4
8,5
28,0
50,0%
39,3%
10,7%
100,0%
70,0%
39,3%
14,3%
40,6%
20,3%
15,9%
4,3%
40,6%
6
17
18
41
11,9
16,6
12,5
41,0
14,6%
41,5%
43,9%
100,0%
30,0%
60,7%
85,7%
59,4%
8,7%
24,6%
26,1%
59,4%
20
28
21
69
20,0
28,0
21,0
69,0
29,0%
40,6%
30,4%
100,0%
100,0%
100,0%
100,0%
100,0%
29,0%
40,6%
30,4%
100,0%
Count
Expected Count
% within AU
% within TDD
% of Total
Count
Expected Count
% within AU
% within TDD
% of Total
Count
Expected Count
% within AU
% within TDD
% of Total
Normo Uricemia
Hyperuricemia
AU
Total
80-89
90-99
>= 100
TDD
Total
Chi-Square Te sts
13,220a 2 ,001
14,010 2 ,001
12,973 1 ,000
69 Pearson Chi-S quare
Lik elihood Ratio Linear-by-Linear As soc iation N of V alid Cases
Value df
As ymp. Sig. (2-sided)
0 c ells (,0% ) have expected count less than 5. The minimum expected count is 8,12.
Korelasi
KorelasiParametrik
Correl ations
1 ,260* ,223 -,451** ,268* ,203 ,370** ,126 ,131 ,111 -,259* ,031 ,066 ,000 ,026 ,094 ,002 ,301 ,284 ,363 ,031
69 69 69 69 69 69 69 69 69 69 69
,260* 1 ,747** -,564** ,587** ,177 ,295* ,367** ,544** ,402** -,331**
,031 ,000 ,000 ,000 ,146 ,014 ,002 ,000 ,001 ,005
69 69 69 69 69 69 69 69 69 69 69
,223 ,747** 1 -,497** ,612** ,115 ,411** ,405** ,570** ,388** -,421**
,066 ,000 ,000 ,000 ,348 ,000 ,001 ,000 ,001 ,000
69 69 69 69 69 69 69 69 69 69 69
-,451** -,564** -,497** 1 -,490** -,207 -,558** -,352** -,319** -,354** ,225
,000 ,000 ,000 ,000 ,089 ,000 ,003 ,007 ,003 ,063
69 69 69 69 69 69 69 69 69 69 69
,268* ,587** ,612** -,490** 1 ,080 ,637** ,484** ,749** ,485** -,407**
,026 ,000 ,000 ,000 ,513 ,000 ,000 ,000 ,000 ,001
69 69 69 69 69 69 69 69 69 69 69
,203 ,177 ,115 -,207 ,080 1 ,009 ,179 ,203 ,047 -,158
,094 ,146 ,348 ,089 ,513 ,939 ,141 ,095 ,701 ,194
69 69 69 69 69 69 69 69 69 69 69
,370** ,295* ,411** -,558** ,637** ,009 1 ,293* ,510** ,297* -,323**
,002 ,014 ,000 ,000 ,000 ,939 ,014 ,000 ,013 ,007
69 69 69 69 69 69 69 69 69 69 69
,126 ,367** ,405** -,352** ,484** ,179 ,293* 1 ,505** ,849** -,296*
,301 ,002 ,001 ,003 ,000 ,141 ,014 ,000 ,000 ,013
69 69 69 69 69 69 69 69 69 69 69
,131 ,544** ,570** -,319** ,749** ,203 ,510** ,505** 1 ,517** -,628**
,284 ,000 ,000 ,007 ,000 ,095 ,000 ,000 ,000 ,000
69 69 69 69 69 69 69 69 69 69 69
,111 ,402** ,388** -,354** ,485** ,047 ,297* ,849** ,517** 1 -,319**
,363 ,001 ,001 ,003 ,000 ,701 ,013 ,000 ,000 ,007
69 69 69 69 69 69 69 69 69 69 69
-,259* -,331** -,421** ,225 -,407** -,158 -,323** -,296* -,628** -,319** 1 ,031 ,005 ,000 ,063 ,001 ,194 ,007 ,013 ,000 ,007
69 69 69 69 69 69 69 69 69 69 69
Pearson Correlation Sig. (2-tailed) N
Pearson Correlation Sig. (2-tailed) N
Pearson Correlation Sig. (2-tailed) N
Pearson Correlation Sig. (2-tailed) N
Pearson Correlation Sig. (2-tailed) N
Pearson Correlation Sig. (2-tailed) N
Pearson Correlation Sig. (2-tailed) N
Pearson Correlation Sig. (2-tailed) N
Pearson Correlation Sig. (2-tailed) N
Pearson Correlation Sig. (2-tailed) N
Pearson Correlation Sig. (2-tailed) N Lama HT TDS
Lama HT TDS TDD HDL AU TG LDL Ureum Creatinin BUN Cr Cl
Correlation is s ignificant at the 0.05 level (2-t ailed). *.
Korelasi Non Parametrik
Correl ations
1,000 ,270* ,251* -,449** ,201 ,164 ,348** ,093 ,138 ,100 -,225 . ,025 ,038 ,000 ,098 ,178 ,003 ,449 ,260 ,412 ,064
69 69 69 69 69 69 69 69 69 69 69
,270* 1,000 ,757** -,546** ,542** ,106 ,286* ,319** ,537** ,369** -,255* ,025 . ,000 ,000 ,000 ,384 ,017 ,008 ,000 ,002 ,034
69 69 69 69 69 69 69 69 69 69 69
,251* ,757** 1,000 -,533** ,650** ,059 ,444** ,405** ,606** ,398** -,445** ,038 ,000 . ,000 ,000 ,633 ,000 ,001 ,000 ,001 ,000
69 69 69 69 69 69 69 69 69 69 69
-,449** -,546** -,533** 1,000 -,478** -,121 -,562** -,309** -,321** -,304* ,115 ,000 ,000 ,000 . ,000 ,320 ,000 ,010 ,007 ,011 ,349
69 69 69 69 69 69 69 69 69 69 69
,201 ,542** ,650** -,478** 1,000 ,073 ,618** ,482** ,738** ,482** -,399** ,098 ,000 ,000 ,000 . ,553 ,000 ,000 ,000 ,000 ,001
69 69 69 69 69 69 69 69 69 69 69
,164 ,106 ,059 -,121 ,073 1,000 ,050 ,164 ,199 ,000 -,176 ,178 ,384 ,633 ,320 ,553 . ,686 ,178 ,101 ,997 ,149
69 69 69 69 69 69 69 69 69 69 69
,348** ,286* ,444** -,562** ,618** ,050 1,000 ,305* ,525** ,282* -,327** ,003 ,017 ,000 ,000 ,000 ,686 . ,011 ,000 ,019 ,006
69 69 69 69 69 69 69 69 69 69 69
,093 ,319** ,405** -,309** ,482** ,164 ,305* 1,000 ,510** ,854** -,292* ,449 ,008 ,001 ,010 ,000 ,178 ,011 . ,000 ,000 ,015
69 69 69 69 69 69 69 69 69 69 69
,138 ,537** ,606** -,321** ,738** ,199 ,525** ,510** 1,000 ,533** -,648** ,260 ,000 ,000 ,007 ,000 ,101 ,000 ,000 . ,000 ,000
69 69 69 69 69 69 69 69 69 69 69
,100 ,369** ,398** -,304* ,482** ,000 ,282* ,854** ,533** 1,000 -,299* ,412 ,002 ,001 ,011 ,000 ,997 ,019 ,000 ,000 . ,013
69 69 69 69 69 69 69 69 69 69 69
-,225 -,255* -,445** ,115 -,399** -,176 -,327** -,292* -,648** -,299* 1,000 ,064 ,034 ,000 ,349 ,001 ,149 ,006 ,015 ,000 ,013 .
69 69 69 69 69 69 69 69 69 69 69
Correlation Coefficient Sig. (2-tailed) N
Correlation Coefficient Sig. (2-tailed) N
Correlation Coefficient Sig. (2-tailed) N
Correlation Coefficient Sig. (2-tailed) N
Correlation Coefficient Sig. (2-tailed) N
Correlation Coefficient Sig. (2-tailed) N
Correlation Coefficient Sig. (2-tailed) N
Correlation Coefficient Sig. (2-tailed) N
Correlation Coefficient Sig. (2-tailed) N
Correlation Coefficient Sig. (2-tailed) N
Correlation Coefficient Sig. (2-tailed) N Lama HT
TDS Spearman's rho
Lama HT TDS TDD HDL AU TG LDL Ureum Creatinin BUN Cr Cl
Correlation is s ignificant at the 0.05 level (2-tailed). *.
LAMPIRAN 6
ANALISIS STATISTIK
Non Parametrik Test (HT)
Non Parametrik test (Normal)
One-Sample Kolmogorov-Smirnov Test
69
52,23
10,218
,095
,095
-,076
,792
,556
69
5,377
2,6015
,166
,166
-,083
1,381
,044
69
156,16
19,500
,159
,159
-,088
1,318
,062
69
91,01
10,866
,233
,233
-,173
1,934
,001
69
39,29
4,141
,122
,122
-,088
1,014
,255
69
7,299
,8235
,074
,074
-,061
,616
,842
69
134,22
20,244
,102
,102
-,091
,848
,468
69
120,51
15,417
,110
,110
-,050
,914
,374
69
197,48
21,043
,158
,096
-,158
1,315
,063
69
32,28
8,883
,083
,065
-,083
,691
,726
69
,868
,2452
,088
,073
-,088
,731
,660
69
14,41
3,735
,119
,094
-,119
,986
,286
69
100,97
18,823
,115
,115
-,084
,953
,323
69
58,77
7,205
,151
,062
-,151
1,250
,088
69
165,70
7,423
,105
,083
-,105
,875
,429
69
21,302
1,0405
,120
,063
-,120
,995
,276
69
80,676
19,6687
,138
,138
-,122
1,143
,146
Usia (tahun)
Lama HT
TDS
Berat badan
Tinggi badan
IMT
Cr Cl
N
Mean
Std. Deviation
Normal Parameters
a,bAbsolute
Positive
Negative
Most Extreme Differences
Kolmogorov-Smirnov Z
Asymp. Sig. (2-tailed)
Test distribution is Normal.
a.
Calculated from data.
b.
One-S ample Kolm ogorov-Sm irnov Test
68 49,16 9,093 ,162 ,162 -,083 1,334 ,057
68 119,41 9,601 ,201 ,196 -,201 1,657 ,008
68 77,72 5,425 ,369 ,278 -,369 3,040 ,000
68 57,57 11,949 ,101 ,096 -,101 ,832 ,492
68 5,210 1,1496 ,085 ,073 -,085 ,699 ,713
68 116,25 27,089 ,113 ,049 -,113 ,928 ,356
68 106,76 12,785 ,113 ,113 -,068 ,935 ,346
68 180,84 27,994 ,137 ,089 -,137 1,127 ,158
68 20,82 5,987 ,113 ,113 -,098 ,934 ,347
68 ,734 ,1850 ,148 ,148 -,088 1,218 ,103
68 10,29 3,115 ,185 ,185 -,130 1,523 ,019
68 102,91 18,688 ,121 ,121 -,068 ,996 ,275
68 58,82 6,990 ,128 ,060 -,128 1,053 ,217
68 165,29 7,709 ,126 ,092 -,126 1,041 ,228
68 21,442 1,0783 ,113 ,080 -,113 ,935 ,347
68 99,090 21,4183 ,088 ,071 -,088 ,727 ,665
Us ia (t ahun) Berat badan Tinggi badan IMT Cr Cl
N Mean St d. Deviat ion Normal Parametersa,b
Absolute Positive Negative Most Extreme Differenc es
Kolmogorov-Smirnov Z As ymp. Sig. (2-tailed)
Test distribution is Normal. a.
T Test (Hipertensi)
Group Statistics
69 5,377 2,6015 ,3132
0a . . .
69 156,16 19,500 2,348 68 119,41 9,601 1,164 69 91,01 10,866 1,308
68 77,72 5,425 ,658
69 39,29 4,141 ,499
68 57,57 11,949 1,449
69 7,299 ,8235 ,0991
68 5,210 1,1496 ,1394
69 ,868 ,2452 ,0295
68 ,734 ,1850 ,0224
69 80,676 19,6687 2,3678 68 99,090 21,4183 2,5974 Group Lama HT
TDS
N Mean Std. Deviation
Std. Error Mean
t cannot be computed becaus e at leas t one of the groups is empty. a.
Independent Samples Test
6,348 ,013 4,402 135 ,000 17,967 4,082 9,895 26,040
4,393 124,028 ,000 17,967 4,090 9,871 26,063
,648 ,422 5,675 135 ,000 13,743 2,422 8,953 18,532
5,682 131,183 ,000 13,743 2,418 8,958 18,527
9,917 ,002 3,936 135 ,000 16,640 4,227 8,280 25,000
3,928 124,389 ,000 16,640 4,236 8,256 25,024
12,727 ,000 8,835 135 ,000 11,452 1,296 8,888 14,015
8,860 119,394 ,000 11,452 1,293 8,892 14,011
1,465 ,228 7,366 135 ,000 ,2561 ,0348 ,1874 ,3249
7,373 133,068 ,000 ,2561 ,0347 ,1874 ,3248
4,350 ,039 6,992 135 ,000 4,112 ,588 2,949 5,275
7,001 131,418 ,000 4,112 ,587 2,950 5,273
Equal variances as sumed Equal variances not ass umed Equal variances as sumed Equal variances not ass umed Equal variances as sumed Equal variances not ass umed Equal variances as sumed Equal variances not ass umed Equal variances as sumed Equal variances not ass umed Equal variances as sumed Equal variances not ass umed TG
Levene's Test for Equality of Variances
t df Sig. (2-tailed) Mean Difference
Std. Error
Difference Lower Upper 95% Confidence
NPar Tests
Mann-Whitney Test
NPar Tests
Mann-Whitney Test
Ra nks
69 100,73 6950,50
68 36,80 2502,50
137
69 93,24 6433,50
68 44,40 3019,50
137 Group
Ht Non Ht Total Ht Non Ht Total TDS
TDD
N Mean Rank Sum of Ranks
Test Statistics
a156,500
673,500
2502,500
3019,500
-9,523
-7,616
,000
,000
Mann-Whitney U
Wilcoxon W
Z
As ymp. Sig. (2-tailed)
TDS
TDD
Grouping Variable: Group
a.
Ranks
69 89,49 6174,50
68 48,21 3278,50
137 Group
Ht Non Ht Total BUN
N Mean Rank Sum of Ranks
Test Statistics
a932,500
3278,500
-6,110
,000
Mann-Whitney U
Wilcoxon W
Z
As ymp. Sig. (2-tailed)
BUN
Group Statistics
69 5,377 2,6015 ,3132
0a . . .
69 156,16 19,500 2,348 68 119,41 9,601 1,164 69 91,01 10,866 1,308
68 77,72 5,425 ,658
69 39,29 4,141 ,499
68 57,57 11,949 1,449
69 7,299 ,8235 ,0991
68 5,210 1,1496 ,1394
69 ,868 ,2452 ,0295
68 ,734 ,1850 ,0224
69 80,676 19,6687 2,3678 68 99,090 21,4183 2,5974 Group Lama HT
TDS
N Mean Std. Deviation
Std. Error Mean
t cannot be computed becaus e at leas t one of the groups is empty. a.
Independent Samples Test
38,907 ,000 13,961 135 ,000 36,748 2,632 31,542 41,953
14,024 99,462 ,000 36,748 2,620 31,548 41,947
14,992 ,000 9,039 135 ,000 13,294 1,471 10,385 16,203
9,079 100,237 ,000 13,294 1,464 10,389 16,199
49,490 ,000 -12,000 135 ,000 -18,284 1,524 -21,297 -15,270
-11,931 82,659 ,000 -18,284 1,532 -21,332 -15,236
10,528 ,001 12,237 135 ,000 2,0883 ,1707 1,7508 2,4258
12,208 121,325 ,000 2,0883 ,1711 1,7496 2,4269
5,262 ,023 3,615 135 ,000 ,1343 ,0372 ,0608 ,2078
3,622 126,410 ,000 ,1343 ,0371 ,0609 ,2077
,641 ,425 -5,243 135 ,000 -18,4145 3,5125 -25,3611 -11,4679
-5,239 133,672 ,000 -18,4145 3,5147 -25,3660 -11,4630 Equal variances
as sumed Equal variances not ass umed Equal variances as sumed Equal variances not ass umed Equal variances as sumed Equal variances not ass umed Equal variances as sumed Equal variances not ass umed Equal variances as sumed Equal variances not ass umed Equal variances as sumed Equal variances not ass umed TDS Levene's Test for Equality of Variances
t df Sig. (2-tailed) Mean Difference
Std. Error
Difference Lower Upper 95% Confidence
Interval of the Difference t-test for Equality of Means
Group Statistics
69 100,97 18,823 2,266
68 102,91 18,688 2,266
69 58,77 7,205 ,867
68 58,82 6,990 ,848
69 165,70 7,423 ,894
68 165,29 7,709 ,935
69 21,302 1,0405 ,1253
68 21,442 1,0783 ,1308
Group
Berat badan
Tinggi badan
IMT
N Mean Std. Deviation
T-Test (pria)
Independent Samples Test
,001 ,970 -,606 135 ,546 -1,941 3,205 -8,279 4,398
-,606 134,992 ,546 -1,941 3,205 -8,279 4,397
,002 ,965 -,046 135 ,964 -,055 1,213 -2,455 2,344
-,046 134,967 ,964 -,055 1,213 -2,454 2,343
,426 ,515 ,311 135 ,757 ,402 1,293 -2,155 2,959
,310 134,628 ,757 ,402 1,293 -2,156 2,959
,001 ,973 -,772 135 ,442 -,1397 ,1810 -,4978 ,2183
-,772 134,659 ,442 -,1397 ,1811 -,4979 ,2184
Equal variances assumed Equal variances not assumed Equal variances assumed Equal variances not assumed Equal variances assumed Equal variances not assumed Equal variances assumed Equal variances not assumed KGD
Berat badan
Tinggi badan
IMT
F Sig.
Levene's Test for Equality of Variances
t df Sig. (2-tailed)
Mean Difference
Std. Error
Difference Lower Upper 95% Confidence
Interval of the Difference t-test for Equality of Means
Group Statistics
36
7,708
,7369
,1228
35
5,786
,9438
,1595
Group
Ht
Non Ht
AU
N
Mean
Std. Deviation
Std. Error
Mean
Independent Samples Test
4,388 ,040 9,583 69 ,000 1,9226 ,2006 1,5224 2,3229
9,550 64,306 ,000 1,9226 ,2013 1,5205 2,3248 Equal variances
as sumed Equal variances not ass umed AU
F Sig.
Levene's Test for Equality of Variances
t df Sig. (2-tailed) Mean Difference
Std. Error
Difference Lower Upper 95% Confidence
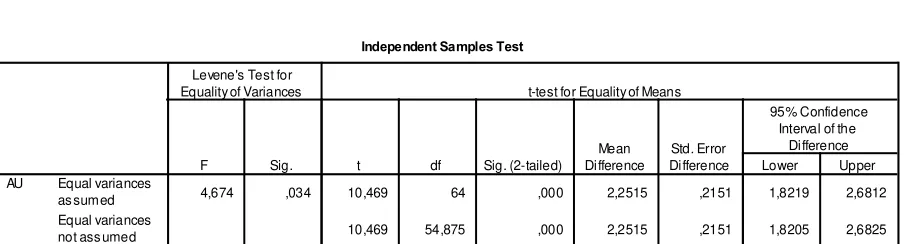
T-Test (wanita)
Group Statistics
33 6,852 ,6723 ,1170
33 4,600 1,0365 ,1804
Group Ht Non Ht AU
N Mean Std. Deviation
Std. Error Mean
Independent Samples Test
4,674 ,034 10,469 64 ,000 2,2515 ,2151 1,8219 2,6812
10,469 54,875 ,000 2,2515 ,2151 1,8205 2,6825 Equal variances
as sumed Equal variances not ass umed AU
F Sig.
Levene's Test for Equality of Variances
t df Sig. (2-tailed)
Mean Difference
Std. Error
Difference Lower Upper 95% Confidence
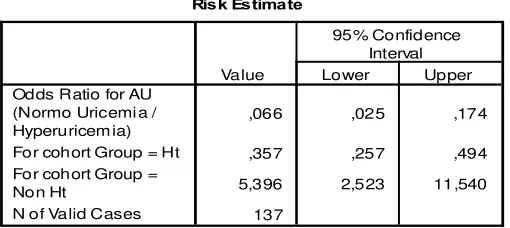
Tabel Chi -square hubungan hipertensi essensial dengan hiperurisemia
Crosstab
28
62
90
45,3
44,7
90,0
31,1%
68,9%
100,0%
40,6%
91,2%
65,7%
20,4%
45,3%
65,7%
41
6
47
23,7
23,3
47,0
87,2%
12,8%
100,0%
59,4%
8,8%
34,3%
29,9%
4,4%
34,3%
69
68
137
69,0
68,0
137,0
50,4%
49,6%
100,0%
100,0%
100,0%
100,0%
50,4%
49,6%
100,0%
Count
Expected Count
% within AU
% within Group
% of Total
Count
Expected Count
% within AU
% within Group
% of Total
Count
Expected Count
% within AU
% within Group
% of Total
Normo Uricemia
Hyperuricemia
Chi-Square Tests
38,903
b1
,000
36,690
1
,000
42,418
1
,000
,000
,000
38,619
1
,000
137
Pearson Chi-Square
Continuity Correction
aLikelihood Ratio
Fis her's Exact Test
Linear-by-Linear
As sociation
N of Valid Cases
Value
df
As ymp. Sig.
(2-sided)
Exact Sig.
(2-sided)
Exact Sig.
(1-sided)
Computed only for a 2x2 table
a.
0 cells (,0%) have expected count less than 5. The minimum expected count is
23,33.
b.
Risk Estimate
,066
,025
,174
,357
,257
,494
5,396
2,523
11,540
Odds Ratio for AU
(Normo Uricemi a /
Hyperuricem ia)
For cohort Group = Ht
For cohort Group =
Non Ht
Value
Lower
Upper
95% Confidence
T-Test pria
Rerata kadar AUs berdasarkan lama menderita HT (Pria)
Group Sta tisti cs
21
39,43
3,544
,773
15
36,40
2,995
,773
21
7,557
,6454
,1408
15
7,920
,8248
,2130
Lama HT
< 5 tahun
Independent Samples Test
,734 ,398 2,691 34 ,011 3,029 1,125 ,742 5,316
2,769 32,940 ,009 3,029 1,094 ,803 5,254
,490 ,489 -1,481 34 ,148 -,3629 ,2450 -,8607 ,1350
-1,421 25,509 ,167 -,3629 ,2553 -,8882 ,1625
Equal variances as sumed Equal variances not ass umed Equal variances as sumed Equal variances not ass umed HDL
AU
F Sig.
Levene's Test for Equality of Variances
t df Sig. (2-tailed) Mean Difference
Std. Error
Difference Lower Upper 95% Confidence
Interval of the Difference t-test for Equality of Means
Independent Samples Test
1,887 ,179 3,599 31 ,001 4,869 1,353 2,110 7,628
4,070 30,633 ,000 4,869 1,196 2,428 7,310
,019 ,892 -1,528 31 ,137 -,3643 ,2384 -,8504 ,1218
-1,514 22,394 ,144 -,3643 ,2406 -,8627 ,1341 Equal variances
as sumed Equal variances not ass umed Equal variances as sumed Equal variances not ass umed HDL
AU
F Sig.
Levene's Test for Equality of Variances
t df Sig. (2-tailed)
Mean Difference
Std. Error
Difference Lower Upper 95% Confidence
T-Test wanita
Rerata kadar AUs berdasarkan lama menderita HT (wanita)
Proporsi hiperurisemia berdasarkan Lama HT
Group Sta tisti cs
21
42,29
4,221
,921
12
37,42
2,644
,763
21
6,719
,6509
,1420
12
7,083
,6726
,1942
Lama HT
< 5 tahun
17,0
11,0
28,0
67,9%
32,1%
100,0%
45,2%
33,3%
40,6%
27,5%
13,0%
40,6%
23
18
41
25,0
16,0
41,0
56,1%
43,9%
100,0%
54,8%
66,7%
59,4%
33,3%
26,1%
59,4%
42
27
69
42,0
27,0
69,0
60,9%
39,1%
100,0%
100,0%
100,0%
100,0%
60,9%
39,1%
100,0%
Count
Expected Count
% within AU
% within Lama HT
% of Total
Count
Expected Count
% within AU
% within Lama HT
% of Total
Count
Expected Count
% within AU
% within Lama HT
% of Total
Normo Uricemia
Hyperuricemia
AU
Total
< 5 tahun
>= 5 tahun
Lama HT
Total
Chi-Square Tests
,966b 1 ,326
,535 1 ,464
,976 1 ,323
,452 ,233
,952 1 ,329
69 Pearson Chi-Square
Continuity Correctiona Likelihood Ratio Fis her's Exact Test Linear-by-Linear As sociation N of Valid Cases
Value df
As ymp. Sig. (2-sided)
Exact Sig. (2-sided)
Exact Sig. (1-sided)
Computed only for a 2x2 table a.
Oneway (wanita)
Perbandingan rerata kadar AUs wanita berdasarkan derajat TDS
Descriptives
AU
6
6,467
,7916
,3232
5,636
7,297
5,5
7,5
15
6,947
,5502
,1420
6,642
7,251
6,1
7,9
12
6,925
,7387
,2132
6,456
7,394
6,0
8,3
33
6,852
,6723
,1170
6,613
7,090
5,5
8,3
120-139
140-159
>= 160
Total
N
Mean
Std. Deviation
Std. Error
Lower Bound
Upper Bound
95% Confidence Interval for
Mean
Minimum
Maximum
Test of Homogeneity of Variances
AU
,648
2
30
,530
Levene
Statisti c
df1
df2
Sig.
ANOV A
AU
1,089
2
,545
1,222
,309
13,373
30
,446
14,462
32
Between Groups
W ithin Groups
Total
Sum of
Post Hoc Tests
Oneway (pria)
Perbandingan rerata kadar AUs pria berdasarkan derajat TDS
Multiple Comparisons
Dependent Variable: AU
LSD
-,4800
,3225
,147
-1,139
,179
-,4583
,3338
,180
-1,140
,223
,4800
,3225
,147
-,179
1,139
,0217
,2586
,934
-,506
,550
,4583
,3338
,180
-,223
1,140
-,0217
,2586
,934
-,550
,506
(J) TDS
140-159
>= 160
120-139
>= 160
120-139
140-159
(I) TDS
120-139
140-159
>= 160
Mean
Difference
(I-J)
Std. Error
Sig.
Lower Bound
Upper Bound
95% Confidence Interval
Descriptives
AU
2
6,900
,2828
,2000
4,359
9,441
6,7
7,1
12
7,367
,5774
,1667
7,000
7,733
6,2
8,4
22
7,968
,7260
,1548
7,646
8,290
7,0
10,2
36
7,708
,7369
,1228
7,459
7,958
6,2
10,2
120-139
140-159
>= 160
Total
N
Mean
Std. Deviation
Std. Error
Lower Bound
Upper Bound
95% Confidence Interval for
Mean
Minimum
Maximum
Test of Homogeneity of Variances
AU
1,121
2
33
,338
Levene
Post Hoc Tests
Oneway (pria)
Perbandingan rerata kadar AUs pria berdasarkan derajat TDD
ANOV A
AU
4,193
2
2,097
4,670
,016
14,814
33
,449
19,008
35
Between Groups
W ithin Groups
Total
Sum of
Squares
df
Mean S quare
F
Sig.
Multiple Comparisons
Dependent Variable: AU
LSD
-,4800
,3225
,147
-1,139
,179
-,4583
,3338
,180
-1,140
,223
,4800
,3225
,147
-,179
1,139
,0217
,2586
,934
-,506
,550
,4583
,3338
,180
-,223
1,140
-,0217
,2586
,934
-,550
,506
(J) TDS
140-159
>= 160
120-139
>= 160
120-139
140-159
(I) TDS
120-139
140-159
>= 160
Mean
Difference
(I-J)
Std. Error
Sig.
Lower Bound
Upper Bound
95% Confidence Interval
Descriptives
AU
8 7,050 ,5318 ,1880 6,605 7,495 6,2 7,9
11 7,500 ,4050 ,1221 7,228 7,772 7,0 8,4
17 8,153 ,7107 ,1724 7,788 8,518 7,4 10,2
36 7,708 ,7369 ,1228 7,459 7,958 6,2 10,2
80-89 90-99 >= 100 Total
N Mean Std. Deviation Std. Error Lower Bound Upper Bound 95% Confidence Interval for
Mean
Minimum Maximum
Test of Homogeneity of Variances
AU
1,249 2 33 ,300
Levene
Post Hoc Tests
Oneway (wanita)
Perbandingan rerata kadar AUs wanita berdasarkan derajat TDD
ANOV A
AU
7,305
2
3,653
10,300
,000
11,702
33
,355
19,008
35
Between Groups
W ithin Groups
Total
Sum of
Squares
df
Mean S quare
F
Sig.
Multiple Comparisons
Dependent Variable: AU
LSD
-,4500
,2767
,113
-1,013
,113
-1,1029*
,2553
,000
-1,622
-,583
,4500
,2767
,113
-,113
1,013
-,6529*
,2304
,008
-1,122
-,184
1,1029*
,2553
,000
,583
1,622
,6529*
,2304
,008
,184
1,122
(J) TDD
90-99
>= 100
80-89
>= 100
80-89
90-99
(I) TDD
80-89
90-99
>= 100
Mean
Difference
(I-J)
Std. Error
Sig.
Lower Bound
Upper Bound
95% Confidence Interval
The mean difference is s ignificant at the .05 level.
*.
Descriptives
AU
12 6,542 ,6171 ,1781 6,150 6,934 5,5 7,3
17 6,871 ,5599 ,1358 6,583 7,158 6,0 7,9
4 7,700 ,6377 ,3189 6,685 8,715 6,8 8,3
33 6,852 ,6723 ,1170 6,613 7,090 5,5 8,3
80-89 90-99 >= 100 Total
N Mean Std. Deviation Std. Error Lower Bound Upper Bound 95% Confidence Interval for
Mean
Minimum Maximum