56
Journal of Public Administration Studies
U R L : h t t p : / / w w w . j p a s . u b . a c . i d / i n d e x . p h p / j p a sE-Readiness of Government Staff toward E-Government Programs In Denpasar
Municipality
Ida Ayu Cininta Padangratha a
a Badan Kepegawaian Pendidikan dan Pelatihan Kota Denpasar, Bali, Indonesia
———
Corresponding author. Tel.: +62-812-2008-8653; e-mail: cinintapadangratha@gmail.com
1. Introduction
Holmes (2001) explains that e-government is an information technology usage, especially internet to provide better service while also bringing it closer to customer, budget efficiency with different means but better outcome. E-government brings advantages such as: cutting cost and improve efficiency, meet citizen expectations and improve citizen relationships, and facilitate economic development.
The Government of Indonesia seeks the emerging of information and technology as an opportunity and uses it to enhance good governance implementation. The enhancement of good governance in Indonesia is the expected influence innovation in bureaucracy
management. E-government implementation in
Indonesia is based on President Instruction No. 3 year 2003 regarding E-Government Development Policy and National Strategy. On its attachment, it is also stated about the principles of e-government implementation in Indonesia. The demand in bureaucracy management innovation for good governance is stated in president instruction as well.
With so many demands on civil servant to work on, e-government is the best answer. Programs are specially designed to increase effectiveness and efficiency while aslo obtaining excellent service quality for the society. This is a good opportunity for Denpasar Municipality as the local government has lack of IT staff. Staff are expected to obtain high productivity even though the tasks given are increasing.
I N F O R M A S I A R T IK E L A B S T R A C T
Article history:
Dikirim tanggal: 26 Oktober 2016 Revisi pertama tanggal: 31 Oktober 2016 Diterima tanggal: 30 November 2016 Tersedia online tanggal: 19 Desember 2016
This research is intended to analyse the readiness of non-IT staff toward e-government programs. It is located in Denpasar Municipality. The method employed in this study is quantitative in nature with questionnaires distribution. There were 111 respondents who participated in this research. The data analysis method used is Unified Technology Acceptance of Use Technology Model (UTAUT), which is calculated by Partial Least Square and Force Field Analysis. The result is from 15 hypotheses, only 4 are accepted. From Partial Least Square calculation, facilitating condition and social influence are determined as the most dominant and significant variables. Furthermore, through force field analysis, facilitating condition is determined as the driving force, and social influence as the restraining force. TNB total score for the driving force is 8.51, while restraining force TNB total score is 5.37. Thus, the driving force for TNB total score is 3.15 point higher than the restraining force. On the scale 0-5, non-IT staff‘s readiness toward e-government programs is considered moderate. However, if we see each TNB score, we can see that each variable has low score. Hence, it is appropriate to formulate strategy focusing on facilitating condition and social influence.
2016 FIA UB. All rights reserved.
Keywords: UTAUT model, FFA, e-readiness, E-government, PLS
57
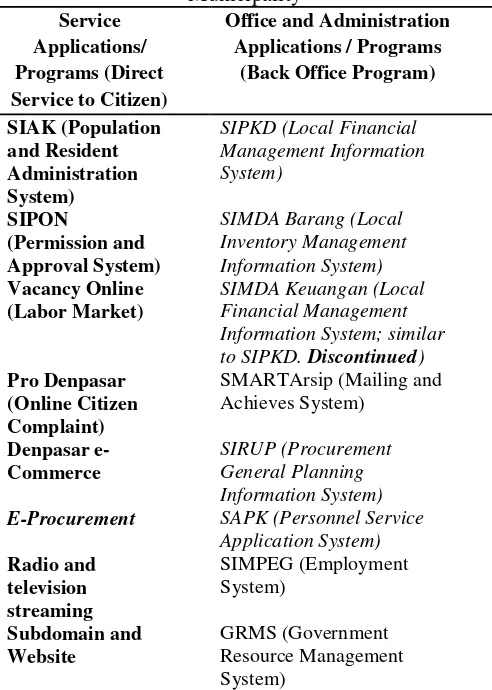
To conduct bureaucratic reform strategies in Denpasar, the Government of Denpasar Municipality uses several e-government programs in its working process. E-government programs which are used by the Government of Denpasar Municipalty is shown in the table below.
Table 1 E-Government Programs Used in Denpasar Municipality to SIPKD. Discontinued)
Pro Denpasar
E-Procurement SAPK (Personnel Service Application System)
Source: Rencana Induk Pengembangan e-Government Diskominfo Pemerintah Kota Denpasar Tahun 2016- 2020
However, to reach the implementation of an optimum use of e-government programs require certain level of readiness in several dimensions. The succession of e-government is determined by the users, in this case is the readiness of civil servant of Denpasar Municipality. Building the capacity of the staff will increase the productivity. As stated by Parasuratman (2000) that technology readiness is, “people’s propensity to embrace and use new technology for accomplishing goals in home life and at work.” Staff readiness becomes one of determinant influenced factors toward technology acceptance of e-government programs as well. Thus, the core of e-government is human capital (Tapscott, Ticoll, and Lowy, 2000).
Government generally takes slower time to adopt technological changes because it operates in the risk-averse culture (Holmes, 2001). Human-computer interaction is a discipline concerned with the design, evaluation, and implementation of interactive computing
systems for human use and with the study of major phenomena surrounding them (Hewett et al, 1992). Interaction between human and computer should be understood because human tend to refuse new system and find it difficult to accept and use new technology. E-government programs in Denpasar are classified as the new way that is expected to have positive impacts on bureaucratic reform in Denpasar. Therefore, this research is intended to assess the e-readiness of government officer in Denpasar Municipality.
Thus, this research is intended to measure the degree of readiness of the government staff toward e-government programs in Denpasar Municipality.
2. Theory
2.1 E-readiness and Technology Acceptance
E-readiness (electronic readiness) is a measurement of the degree to which a country, nation, or economy may be ready, willing or prepared to obtain benefits which come from information and communication technologies. This measurement is often used to gauge how ready a country is to partake in electronic activities, such as e-commerce and e-government (Danish Dada, 2006).
The concept of e-government readiness is important because of the opportunities it creates for each country in terms of benefiting from e-commerce activities, openness to globalization, potential to strengthen democracy and make governments more responsive to the needs of their citizens, increasing citizen wellbeing, etc (Kovacic, 2005).
2.2 Unified Technology Acceptance of Use Technology (UTAUT)
To assess individual readiness, Vekantesh et al (2003) creates a model called UTAUT. This particular model combines 8 model of individual readiness which are most often used. They are: The theory of reasoned Action, the technology Acceptance Model, The Motivational Model, The theory of Planned Behaviour, A Model Combining The Technology Acceptance Model and The Theory of Planned behaviour, The Model of PC Utilization, The Innovation Diffusion Theory, and The Social Cognitive Theory. UTAUT model confirms a tool to identify staff success for new technology introduction and helps to understand the motivation of technology acceptance. This model is useful to identify government staff of Denpasar Municipality toward e-government programs which they are obligated to use.
58
countries since Oshlyansky et al research took place in nine different countries from four different contingents.
3. Research Method
3.1 Data Collection Methods
This research collected its data by distributing questionnaires to government officers/civil servants in
Denpasar Municipality who use e-government
programs. Based on BKPP of Denpasar Municipality data per 30th of December 2013, the number of staff in general affairs, finance, and administration in Denpasar Municipality is 2,348 of total 7,516. They are dispersed in agencies/boards (SKPD), sub districts (kecamatan), village units (kelurahan), and schools (junior and senior level).
To determine research sample, many equations and theories can be used. This research used Slovin equation, which is:
Conditions: n = sample
N = population
e = degree of freedom (0.1)
Therefore, the sample of research is
n =
= 95.9
From the equation above, the result we get is 95.9 respondents, however the target is human and decimal is not necessary, then the sample is 96. However, author managed to collect questioners for 111 respondents.
The data which are used in this research is not only obtained from questionnaires filled by respondents, but also obtained from other secondary data such as official statistical data from the Government of Denpasar Municipality, conducting interviews for data triangulation, and other documents.
3.2 Characteristics of Variables
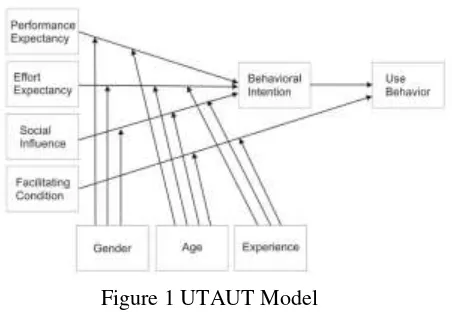
To identify the readiness of the staff of the Government of Denpasar Municipality in receiving e-government programs in their line of work. Therefore, the variables employed are four independent variables (performance expectancy, effort expectancy, social influence, and facilitating conditions), two dependent variables (behavioural intention and use behaviour), and four determinant variables (gender, age, experience, and voluntariness). These variables are described in UTAUT model.
The original UTAUT model by Vekantesh et al (2003) has four variable determinants, including voluntariness. However, only for this research variable voluntariness is ommited because e-government programs are mandatory. Therefore, staff have no choice but are forced to use it.
Figure 1 UTAUT Model
Source: modified from Vekantesh et al, 2003
3.3 Statistical Analysis
To measure individual readiness, it is important to arrange scale measurement to assess whether the readiness level of government officer in utilising e-government programs is high, moderate, or low.
Questionnairre analysis is calculated by using Partial Least Square (PLS). To calculate UTAUT Model, this research uses Partial Least Square (PLS). It is a better alternative than the multiple regression analysis because PLS method is more robust (Hoskuldsson, 1988; Tobias, 1995). It means that the model indicators will not have many changes when new sample is taken from total population (Geladi and Kowalski, 1986).
PLS is a powerful analysis because it does not use many assumptions such: normal data distribution and big sample is not necessary, and it can test a model with weak theory (Chin, 1998). In addition to its ability to confirm a theory, PLS can also be used to explain influence among latent variables. This means, that the use of this method can identify indicators (factors) of constructing variables in UTAUT Model, not only explaining the relationship among variables.
The equation for this research is: Y1=
Y2 = Which:
Y1 = Behavioural intention of government staff
Y2 = Use behaviour to use e-government programs
ρ = slope
X1 = Performance expectancy
X2 = Effort expectancy
X3 = Social influence
X4 = Facilitating condition
Z1 = Age
Z2 = Gender
Z3 = Experience
59
FFA is used through several steps as followed (Sianipar dan Entang, 2003):
a) Identified problems are based on strategic problems and group them to analyse. Problems in this research are based on variables and items from UTAUT
• Contribution of each exogenous variable toward • endogenous variable; dan
• Relation between each exogenous variable toward endogenous variable.
Force Field Analysis is conducted through several steps as followed:
a) Determine Urgency Score (NU) and Weigh Factor (BF)
Urgency score (NU) is conducted from
comparation among variables, which has the highest urgency score. Scale is 1 – 10, which the higher score means high urgency for variable on its e-government development role and vice versa. Urgency score in this research is taken from significant testing result, which is grouped into 10 (range 4).
Table 2 Rank of Score
highest contribution to endogenous variables. Scale is 1 – 10, which the higher score means high contribution for variable on its e-government development role and vice versa. Contribution score in this research is taken from path diagram result, which is grouped into 10 (range 4).
Contribution Weigh Score is calculated by equation as followed:
Which: NBD = Contribution Weigh Score ND = Contribution Score
BF = Weigh factor
c) Determine Significant Value (NK), Relation Mean (NRK), and Relation Weigh Score (NBK)
NK Score is conducted by comparation among variables, which has the highest relation toward use behaviour and behavioural intention. The scale is 1 – 10. The higher score means high relation. Significant score in this research is taken from significant testing result, which is grouped into 10 (range 4).
Which:
TNK = factor’s relation score total
N = amount of driving and restraining force calculated NRK = Relation Mean
Furthermore, calculate NBK by using equation as followed:
Which: NBK = Relation weigh score NK = Relation score BF = weigh factor
d) Determine Weigh factor total (TNB), and Success Factor (FKK)
TNB is calculate using equation:
Which: TNB = weigh factor total
NBD = Contribution Weigh Score NBK = Relation weigh score
FKK is strategic factors, which is determined from: • The highest TNB score for driving forces and
restraining forces.
• If TNB score is identical, choose the highest BF • If BF is identical, choose the highest NBD score • If all scores have identical score, then determine
60
bigger the score is, the higher degree of e-readiness is. On the contrary, if the TNB score of restraining force is bigger than the TNB score of driving force, hence e-readiness of government staff is low.
After scoring all forces, then, the next step is to analyse the appropriate strategy regarding calculation result. If the result is low on e-readiness, thus the strategy is to improve the restraining force and change it into driving force. If the result is good with high degree of e-readiness, the strategy is still needed to maintain the level driving force and keep the treat restraining force from worsening.
4. Results and Discussion
4.1 Results
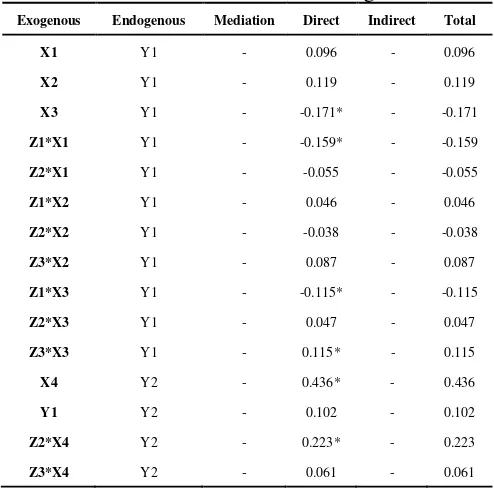
First, we discuss hypotheses result (significant testing) to understand the significant factors that influence behaviour intention and use behaviour in using e-government programs. Statistical result shows that only four hypotheses are accepted. It indicates that only four relations are significant, which are: interaction of
performance expectancy with gender toward
behavioural intention, social influence toward behavioural intention, facilitating condition towards use behaviour, interaction of faciliting condition with age towards use behaviour.
Thus, if facilitation condition is well provided, it will affect significantly on government staff. For instance, on the item ‘the availability of facilities (resource) will affect on their usage. Imagine if they want to use the program but the internet connection does not support, it will deminish their attitude to use e-government programs. Furthermore, social influence also affected their intention on using e-government programs. For instance, the item ‘supervisor influence’ will affect their intention on using e-government programs. Findings on the field work show that many government staff is ordered by their supervisor to use more than two e-government programs alone whereas the load work is high. It will deminish their intention to use e-government programs.
However, other hypotheses are rejected. It indicates that eleven relations used in this research are not significant, which are: performance expectancy towards behavioural intention, interaction of performance expectancy with age toward behavioural intention, effort expectancy towards behavioural intention, interaction of effort expectancy with gender toward behavioural intention, interaction of effort expectancy with experience toward behavioural intention, interaction of social influence with gender toward behavioural intention, interaction of effort expectancy with age toward behavioural intention, interaction of social influence with age toward behavioural intention, interaction of social influence with experience towards
behavioural intention, facilitating influence with experience toward use behaviour, behavioural intention toward use behaviour
Table 3 Direct and Indirect Path Coefficient
Exogenous Endogenous Mediation Path Coefficient (direct)
Table 4 Conversion of Path Diagram
Exogenous Endogenous Mediation Direct Indirect Total
61
Exogenous Endogenous Mediation Direct Indirect Total
X1 Y2 Y1 - 0.01 0.01
X2 Y2 Y1 - 0.012 0.012
X3 Y2 Y1 - -0.017 -0.017
Z1*X1 Y2 Y1 - -0.016 -0.016
Z2*X1 Y2 Y1 - -0.006 -0.006
Z1*X2 Y2 Y1 - 0.005 0.005
Z2*X2 Y2 Y1 - -0.004 -0.004
Z3*X2 Y2 Y1 - 0.009 0.009
Z1*X3 Y2 Y1 - -0.012 -0.012
Z2*X3 Y2 Y1 - 0.005 0.005
Z3*X3 Y2 Y1 - 0.012 0.012
Source: Research result, 2016
Driving force is variable, which has positive influence toward use behaviour and behavioural intention. Based on significant testing result and path coefficient conversion, it can determine which variables belong to driving force, then rank it based on table distribution frequency. Urgency value (NU) and Significant value (NK) are based on rank of significant testing result, while distribution value (ND) is based on the rank of path coefficient.
Restraining force is variable, which has negative influence toward use behaviour and behavioural intention. Based on significant testing result and path coefficient conversion, it can determine which variables belong to driving force, then rank it based on the table Table 6 Restraining Forcdistribution frequency. Urgency value (NU) and Significant value (NK) are based on rank of significant testing result, while distribution value (ND) is based on rank of path coefficient.
4.2 Discussion
This result is inconsistent with findings on Vekantesh et al (2003). This inconsistency might because of the mandatory of using e-government programs. Two exogenous variables (performance expectancy and effort expectancy) and endogenous variables (use behaviour and behavioural intention) through their interaction with intervening variables (gender, age, and experience) have no significant relation because the usage of e-government is mandatory. Thus, governement staff have to use it regardless their performance expectancy (eg. Perceive of usefulness), effort expectancy (eg. Perceive of ease), age, gender, and experience.
Significant influence of these variables is used for force field analysis to determine their rank (see figure 16). From its rank, TNB score is being calculated for each driving factor and restraining factor. TNB score total for driving force is 8.51, while restraining force
TNB total score is 5.37. Thus, driving force TNB total score is higher 3.15 point than restraining force. On the scale 0-5, government staff readiness toward e-government programs is considered moderate. However, if we see each TNB score we can see that each variable has low score. Since there is huge gap between significant variable (social influence and facilitating conditions) and other variables create a moderate value, in which it is not really moderate. The focus is to elevate low score of variables to narrow down the gap.
Table 5 Restraining Force
Source: Research result, 2016
Table 6 Driving Force
Source: Research result, 2016
62
toward behavioural intention. There is no relation as well between behavioural intention and use behaviour. Performance expectancy can only be moderated by variable of gender, which has been previously predicted will have stonger impact when moderated by gender and age. Social Influence can also be only be moderated by gender and experience. Variable of age failed to moderate social influence relation toward behavioural intention. However, the relationship between social influence toward behavioural intention is negative, which is different with previous model. The prediction regarding relation between variabls that does not change change is only on facilitationg condition which frequency and quantity in program usage. The higher the frequency is in program usefulness, then the individual will be more ready and receptive toward the programs as well as many other new programs that will be introduced. The more programs that are used will also
impact the individual’s readiness and acceptance toward
programs utilization. With the diversity of programs, each individual will be more familiar and find it easier to adapt with various kind display usage.
During the interview, it was found that not only the frequency and quantity of the program usage that have impact, but also education and familiarity toward technology.
Another interesting finding is the relation between variable social influence toward behavioural intention. In all previous researches, it is mentioned that the relation between both variable is significantly positive. However, on the contrary, this research finds that the relation between two variable is negative. It means that as an individual has more influence from their social environment, then their intention to use e-government programs will be lower.
5. Conclusions
The e-readiness of government staff in Denpasar Municipality to use e-government programs in their daily work is moderate. However, each point of variable which are measured are low.
Age and gender do not have any significant influence, however, experience has significant influence in individual readiness. Experience is defined in usage frequency, usage intensity, program quantity, education (formal/informal), and familiarity toward technology usage (computer and internet).
Social influence does not always provide positive boost. Influence can be perceived negatively by
individual because of several factors, especially from those people who are considered as significant (supervisor, co-worker, etc.)
References
Chin, W. W. (1998). The Partial Least Squares Approach to Structural Equation Modeling. In G. A. Marcoulides, Modern Methods for Bussines Research (pp. 295 - 335). New Jersey: Lawrence Erlbaum Associates Publisher.
Dada, D. (2006). E-readiness for developing countries: Moving the focus from the environment to the users. The Electronic Journal of Information Systems in Developing Countries, 2, 6, pp.1-14.
Geladi, P, and Kowalski, B. (1986), Partial least squares regression: A tutorial. Analytica Chimica Acta, 185, 1-17. government. Naperville, III: Nicholas Brealey Pub.: London.
Hoskuldsson, A. (1988). PLS Regression Method.
Journal of Chemometrics Vol 2,
211-228.Kovacic, Zlatko J. 2005. The Impact of National Culture on Worldwide e-Government Readiness. Informing Science Journal Vol. 8. Pp. 143 – 158.
Oshlyansky, L., Cairns, P., & Thimbleby, H. (2007). Validating the Unified Theory of Acceptance and Use of Technology (UTAUT) tool cross-culturally. The British Computer Society Volume 2 Proceedings of the 21st BCS HCI Group Conference, 83-86.
Parasuratman. (2000).Technology Readiness Index (TRI): A Multiple-item Scale to Measure Readiness Index to Embrace New Technology.
Journal of Service Research, 2(4): pp.307-320. Sianipar dan Entang. (2003). Teknik-teknik Analisis
Manajemen. Bahan Ajar Diklatpim Tingkat III. Lembaga Administrasi Negara RI, Jakarta.
Rencana Induk Pengembangan e-Government
Diskominfo Pemerintah Kota Denpasar Tahun 2016- 2020.
Tapscott, D., Lowy, A., & Ticoll, D. (2000) Digital capital: Harnessing the power of businesswebs.
Boston,Mass: Harvard Bussiness Scholl Press. Tobias, Randall D. (1995) An Introduction to Partial
Least Squares Regression. Sugi Proceeding: NC. Venkatesh, V., Moris, M. G., Davis, G. B., & Davis, F.
63