Introduction
In 2015, when the ASEAN Economic Com-munity (AEC) is achieved, ASEAN will have
a single market in which a freer flow of goods, services, investment and the capital flow among
the nations in this area will take place. Many empirical studies have shown that the develop-ment of the integration of the capital market has resulted that the movement of the prime indica-tor of the stock market in a certain country can be transmitted easily and immediately to anoth-er country’s stock market (see for instance: Ka-nas, 1998; Rigobon and Sack, 2003; Savva et al., 2009; Ingyu, 2011). Facts have also shown that the global economic crisis of 2008, which at the beginning was initiated in the United States, within a short period has spread over to most of the hemisphere, especially to the developed
countries which are economically and finan -cially very integrated with the United States.
In Asia, many countries have endured the negative side of the crisis, although the degree of the side effect has more variance among the countries, depending on the domestic economic condition and the degree of the integration of the country with the world economy. Singa-pore is a country which was at the beginning the most seriously affected by this crisis. This is not surprising because Singapore is a country which is fully integrated with the global
mar-ket with regard to the business and finance. As
a consequence, the country’s economy is very sensitive towards any economic shock initiated from outside. In the context of the ASEAN
eco-nomic and financial integration, a shock that ex -ists in a country can easily and quickly spread to other countries. Some people explained that
Study in the Indonesia and Singapore Stock Market
Siti Saadah*
Faculty of Economics, Atmajaya Catholic University, Indonesia
Following the blueprint of the ASEAN integration 2015, the integration of the financial markets in this region will increase. This study investigates the existence of a volatility spillover from the Sin -gaporean stock market into Indonesia, including its transmission pattern. Singapore, as an advanced country in the ASEAN region, has played an important role as the information leader in the market of this region, so that it is very possible that the shocks in the Singapore’s stock market will be transmit -ted to another stock market in this region. Using TGARCH (1,1) model specification regarding the data of the daily return of the Indonesia market index (IHSG) for the period of January 2008 – August 2012, it is observed that the shock that took place in the Singapore stock market is immediately trans -mitted to the Indonesia stock market with two important asymmetric patterns. The transmission of the shock from the Singapore stock exchange becomes stronger when this market (1) experiences a negative return, and (2) is in the bearish phase.
Keywords: Asymmetric volatility spillover, sign asymmetry, phase asymmetry
this possibility include financial panic and ra -tional channels. Corsetti et al. (1998) and Glick and Rose (1998) said that spreading is rational, and a turmoil can spread via, among others, a
trade and financial relation. Another argument
explained it from the side of the market behav-ior.
Singapore which is part of the group of de-veloped countries in the ASEAN region plays an important role as the information leader in this regional market and therefore is very pos-sible in creating a price and volatility spillover from the Singapore stock exchange into other markets in this region, including Indonesia. This article studies the asymmetry spillover volatili-ties between the Singapore and Indonesia stock
exchange. Many empirical findings have shown
that the spillover volatility among markets is asymmetric. Bae and Karolyi (1994) have found that volatility spillover from the United States to the Japanese stock market is greater after a negative return innovation (bad news) compared to after a positive return innovation (good news). Koutmos and Booth (1995) have also found the existence of the same asymme-try at the volatility transmission between New York, Tokyo, and the London stock exchang-es. Kansas (1998) also found the asymmetric pattern at the volatility transmission between London, Frankfurt, and Paris stock exchanges. Other studies have analyzed the asymmetric pattern in the transmission of the volatility dur-ing the bull and bear market period. The result of these observations shows that volatility from one market into another market will be trans-mitted faster and stronger during the downward market movement phase.
Efforts to get a better understanding about international transmission in a shockand vola-tility return of stocks between markets will be-come important, especially when
accompany-ing the economic and financial integration with
an increasing intensity. The aim of this study is to examine whether there is an asymmetry in the spillover volatility from the Singapore stock exchange into the Indonesia stock ex-change. Investigation towards the asymmetric response is important because a spillover that
is asymmetric is a source of financial contagion
and of course it has an important implication to-wards the macro policy. It is very possible that in a certain phase, especially in the bull phase, the market in a certain country, especially in the emerging market, looks as if it is not relat-ed to the market of other countries which are more advanced. However, facts and some other empirical studies have shown that during the downward market phase trend (bear),
emerg-ing markets can become blown up by a flare up,
originated from the developed market.
According to this writer’s observation, al-though there are many studies which have studied spillover volatilities in these two mar-kets, however, there are only a few which have paid attention to the asymmetry phenomena in its transmission, the asymmetry which is con-nected to the short term return behavior (sign asymmetry) as well as to the long term return behavior (phase asymmetry).
Literature Review
The integration of the international financial
market has been developing as a consequence of the liberation process adopted by many countries, have created many empirical stud-ies which have examined how a stock market
fluctuation in a certain market will transmit it
to another stock exchange. Many of these stud-ies have concluded that the transmission pro-cess have asymmetric characteristics (Badhani, 2009; Bahng and Shin, 2003; Chen et al., 2003; Koutmos and Booth, 1995). Badhani (2009) has studied whether the Indian stock market has re-sponded asymmetrically to the information that comes from the United States market. The result
has proved that there is a significant asymmetry
in the price and the volatility spillover. The In-dian stock market has responded stronger after the negative return compared to the positive re-turn in the United States market. However, the
study did not find a significant difference in the
According to Badhani (2009), the asymme-try phenomenon has been observed in the as-set price in three aspects. First, the evidence of asymmetry found in the response volatility to-wards the price change. The volatility increases more after a negative shock compared with af-ter the positive shock.
The second asymmetric proof is shown in the mean reversion of the asset’s price. Some empirical studies have found that the negative change of the stock price will reverse faster compared with a positive change. Therefore, a positive return in general shows a positive au-tocorrelation, while a negative return shows a negative autocorrelation (Koutmos, 1998; Nam et al., 2001). Overreaction towards bad news and under reaction towards good news is often assumed as the origin of this asymmetry.
The third asymmetric form is found in some empirical studies, which have shown that the covariance and correlation among the return will increase during the bear market and will decline during the bull market (Lin et al., 1994; Ang and Bekaert, 2002; Das and Uppal, 2004; Capiello et al., 2006). In the context of the in-ternational equity market, this phenomenon is manifested in an asymmetric spillover return and volatility.
Analyzing an asymmetric response, such as in Badhani (2009), the writer has used two different frameworks regarding the time span of the price behavior in the leading market (in this case Singapore). First, the asymmetry is studied in the context of the price behavior in the short term. Does the market price/volatil-ity in a certain country show an asymmetric response towards a positive or negative price innovation in other countries? Such an asym-metric response is called sign asymmetry or news asymmetry. A positive price innovation in the leading market in this context is called as good news and a negative price innovation is called bad news. Second, asymmetry is studied in the context of a long term price behavior (or trend). Does a market price / stock market vola-tility in a country show an asymmetric response during an increasing price trend (bull market) and adecreasing price trend(bear market)? An asymmetric response of this genre is called as a
phase asymmetry. The bullish phase in a market is called good time, while a bear phase in the market is called as bad time.
The identification of the volatility spillover
in this study will be conducted using the fol-lowing method by Fabozzi et al. (2004). To model the spillover effect of the volatility of a certain market (A) towards another market (B), the lag squared error component which was produced by the mean equation model GARCH of market B will be included into the GARCH model for market A as an explanatory variable in the conditional variance equation. The result
of this lag squared error estimation coefficient
will then be examined to analyze the existence of the spillover effect.
Research Method
Data and its sources
To study the asymmetric response at the Indonesia stock exchange towards the Singa-pore stock exchange, the daily time series data at the closing of Jakarta composite index, and the FTSE Strait Times index (FSSTI index – Singapore) is used, with a sample period of January 3rd until August 15th 2012 with a total of 990 observations. The daily time series data for both indexes are collected from Bloomberg. For each index, the daily return is calculated as a change in the logarithm of the closing price in two chronological days: R
t = ln(St) - ln(St-1), with St as the closing index at day t.
Method of data analysis
In this study, the specification of the
TGARCH model will be used to capture the asymmetric volatility phenomena. This
speci-fication is used because many results of these
test the existence of the ARCH structure using the auxiliary least squares regression for the variable stock return towards the intercept.
It is known from the literature that the return data, besides showing the volatility clustering characteristics, also exhibits fat tails distribu-tion probability, that is, it has a greater tendency to create an extreme occurrence. In general, this is signaled through the greater positive kurto-sis excess value of more than 3. This kind of distribution is characterized as leptokurtic. All of these characteristics are different from the Gaussian (normal) distribution property. There-fore, the statistical descriptive regarding the whole of the above mentioned property will be studied in order to complete the reason for
us-ing the TGARCH specification in modelus-ing the
return volatility of the stock in the Indonesia
stock exchange. In accordance to the finding of
Hansen and Lunde (2001), the GARCH model with order (1,1) is the best model in predicting the return of assets volatility behavior. There-fore, TGARCH with order (1,1) will be used in this study to model the volatility return in the Indonesia stock exchange as well as the Singa-pore exchange.
Identifying the sign asymmetry pattern is done by dividing the return data of the FSSTI
index in two series. The first series consist of
data with positive return, and the second series consist of data with a negative return. For the time being, to identify the asymmetry phase, the distribution of the data in two series is based on the series data in the bull phase and bear
phase. Both phases are identified visually from
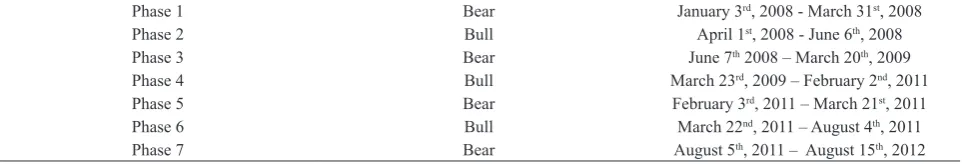
the FSSTI time series index plot which is based on the trend pattern as occurred in the market. To identify the pattern of the asymmetry phase, the researcher has divided the data into two se-ries, that is, the data series of the bullphase and the bear phase. The grouping of the data into two phases is based on the monthly candlestick
which appears on the FSSTI chart. If the can-dle of a certain month has become lower low than the candle of the previous month, it means that the data is in the bear phase. Whereas, if the candle in this month is a high, and it be-comes higher compared to the candle of the previous month, it means that the date is in the bull phase. However, if the candle does create a new high or a newer low, it means that the data will be categorized as following the next phase (if the candle for the following month creates a new low, it means that it enters the bear phase, and vice versa). The lowest or the highest point at each phase will become the border point be-tween moving from the bull phase into the bear
phase. Table 1 presents the identification result
for the bear and bull phase.
The structure of mean and variance equation of TGARCH (1,1) for the sign asymmetry pat-tern:
The above mean equation is following the ARMA (r,s), in which R is the daily return of the index market (IHSG), εt is the stochastic er-ror, Ωt-1 is the whole information at t-1, ht is the conditional variance return which function is explained in the equation (2). This equation is used to detect whether the volatility return in the Indonesia stock exchange shows a differ-ent response when the Singapore market has a negative return and a positive return during the
Table 1. Identification result of bear and bull phase
previous business day. The parameter in
equa-tion (2) has to fulfill: α0> 0; α1, β> 0. The dum-my variable (Dt-1) in above mentioned model represents the price innovation with a positive or negative characteristic, which has occurred in the Indonesian stock exchange. Therefore,
the parameter shows the asymmetric influence
from the domestic shocks which have a positive and negative characteristic towards the return of the IHSG. Whereas D*t-1 represents the posi-tive of negaposi-tive price innovations which have taken place at the Singapore stock exchange.
SINRS is a quadratic value of the standard-ized residual resulted from the mean equation at the TGARCH (1,1) model for the stock’s daily return in the Singapore stock exchange. This variable is a shock which takes place in the Singapore market, so that the ϕ1 parameter in the equation (2) shows the volatility spillo-ver from the Singapore stock exchange into In-donesia which is accompanied by the positive return in Singapore; ϕ2 shows the difference in the negative return effect in the Singapore stock exchange towards the volatility spillover; hence, ϕ1+ϕ2 is the volatility spillover from the Singapore stock exchange to Indonesia which has accompanied the negative return event at
the Singapore stock exchange. The significance
of the ϕ2 parameter is that there is an asym-metric spillover volatility from the Singapore stock exchange into Indonesia. The δ parameter is called a leverage term. If δ is positive and
significant, the shock which has a negative fea -ture in the Indonesia stock exchange will have a greater effect towards the volatility (that is
α+δ), compared with a positive shock effect to-wards the volatility (as big as α).
The TGARCH specification (1,1) for the
phase asymmetry pattern is shown as follows:
ετ|Ωt-1~N(0,ht)
h
t= α0+α1ε +δε Dt-1+βht-1+ϕ1SINRSt
+ϕ2SINRStD 3)
with:
Equation (3) is used to detect whether the volatility return of the Indonesia stock exchange has shown a different response when the Singa-pore market is in a bull (good time) and bear (bad time) phase. In this variance equation, the
ϕ1 parameter shows the volatility spillover from the Singapore stock exchange into Indonesia during the bull phase at the Singapore stock exchange, while ϕ1+ϕ2 is the volatility spillo-ver from the Singapore stock exchange into Indonesia during the bear phase in Singapore. Hence, ϕ
2 shows the asymmetry in the
volatil-ity spillover. The significance of the parameter ϕ2 shows that there is an asymmetric spillover volatility from the Singapore stock exchange into Indonesia during the bear and bull phase.
The estimation of the parameter in the above mentioned model has been done by using the Maximum Likelihood Procedure with the help of the software Eviews 7.1.
Result and Discussion
As has been discussed in the previous part, the modeling of the return volatility is done with the GARCH model estimation which is the
right specification model for data’s that have a
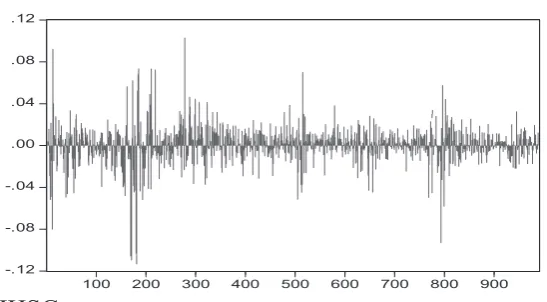
time varying volatility characteristic and have also a non normal distribution. Figure 1 shows the time series data for the Indonesia stock ex-change. It can be seen that the stock return has shown that there is a quick change from one pe-riod into another pepe-riod. It further shows that there is a time gap in which a great change is followed by a next great change, and that there is also a period in which a small change will be followed by a small next change. In this situ-ation, the data series looks as if it shows that there is a time varying volatility or a volatility clustering.
Kurtosis, skewness, and Jarque-Bera nor-mality statistics as shown in Figure 2 indicate that the characteristics of the data return of the
IHSG follow the result of the findings as men -tioned in many literature, the distribution prob-ability is fat tails in nature as signaled by the positive kurtosis excess value which is greater than 3, and is a non normal distribution.
The test of the existence of the ARCH effect in Table 2 also shows that there is an ARCH ef-fect in the residual return of the IHSG at the 5%
significance level.
Many tests and observations on the charac-teristics of the data return are employed in this study. To accommodate the possibility of the asymmetry phenomena, sign as well as phase
asymmetry, the specification of TGARCH is
used in this study to catch the data characteris-tics and the asymmetry phenomena.
Estimation of the mean equation model in
which the specification is aimed in equation
(1), demands the determination of the optimal order for the autoregressive process and its moving average. Table 3 shows the result of the diagnostic test (with the residual analysis using lag 15) and other model criteria. The di-agnostic test result, using the residual analysis
shows that with a significant alpha= 5%, only the ARMA (3,1) specification model has a re -sidual which is characterized as white noise, until the observed lag residual does not show the autocorrelation symptoms. ARMA (3,1) has also produced the greatest Adjusted R2 and the smallest AIC. Therefore, the best model for the mean equation is the model with the ARMA
(3,1) specification.
When analyzing the asymmetric response towards the shock coming from the Singapore stock exchange, TGARCH (1,1) as an
exten-sion of the GARCH model is modified by in -serting two asymmetric patterns, that are, the sign asymmetry and the phase asymmetry at their relevant variance equations. The result of
Figure 2. Descriptive statistics of the IHSG return data
Table 2. Variance residual return test of the IHSG
Heteroskedasticity test: ARCH
F-statistic 66.9879 Prob. F(1,987) 0.0000
Obs*R-squared 62.8575 Prob. Chi-Square(1) 0.0000
the parametric estimation is shown in the Table 4 (for the sign asymmetry pattern) and Table 6 (for the phase asymmetry pattern).
The test of the variance residual as shown in Table 5 on the residual obtained from the Ta-ble 4 model has shown that the residual from the model has a homoskedastic characteristic.
The positive and significant βparameter value at the variance equation indicates that the news effect towards the volatility return of the stock has a persistent characteristic during the analy-sis period of January 3rd 2008 until August 15th 2012. In this equation it is also shown the
sig-nificance of the ϕ1parameter, which shows that
there is a proof that there is a significant vola -tility spillover phenomenon, that is, that shock/ volatility return as happened in the Singapore stock exchange will immediately transmitted
to the Indonesia stock exchange. This finding
is in accordance to the study results by Lest-ano (2010), who has shown the existence of the spillover volatility from the Singapore stock ex-change into the Indonesia stock exex-change and it
confirms the expectation that a stock exchange with an established financial system has spill -over volatility to a country with a non
estab-lished financial system. The variance equation
at this study has also put two possible asymme-try phenomena, that is the difference effect of a negative or positive shock return which happen in the domestic (Indonesia) and the difference between the negative and positive shock return of the Singapore stock exchange. Both asym-metric effects, in which each is shown by the parameters δ and ϕ2, are positive and
statisti-cally significant. The significance of parameter ϕ2 shows that transmission of the shock/volatil-ity return from the Singapore stock exchange to
Tabel 3. Diagnostic test and some other criteria to choose a model
Model Q-Stat Adjusted R2 AIC SIC
AR(1) 144.58 (23.68) 0.1734 -4.7793 -4.7694
MA(1) 231.68 (50.06) 0.4255 -5.1430 -5.1331
ARMA(1,1) 28.43 (22.36) 0.4342 -5.1573 -5.1424
ARMA(1,2) 47.96 (21.03) 0.4281 -5.1466 -5.1318
ARMA(2,1) 31.32 (21.03) 0.4340 -5.1560 -5.1361
ARMA(2,2) 28.09 (19.68) 0.4347 -5.1565 -5.1367
ARMA(3,1) 16.62 (19.68) 0.4378 -5.1600 -5.1353
Note: Q-stat is used to test the autocorrelation residual up to lag 15, which follows the chi-squared distribution with a degree of freedom is the lag, less the amount of ARMA order. The number in the brackets is the critical value Q at the significant level 5%.
Table 4. Sign asymmetry
Coefficient z-statistic Prob.
Mean equation
Constant (η) 0.0014 3.564208 0.0004
AR-1 (θ1) 0.4868 2.352944 0.0186
AR-2 (θ2) -0.0399 -1.134216 0.2567
AR-3 (θ3) -0.0687 -2.832373 0.0046
MA-1 (ϕ) -0.4210 -2.017983 0.0436
Variance equation
Constant (α0) 2.19E-05 3.7992 0.0001
ARCH effect (α1) 0.0595 2.4585 0.0140
Asymmetry (negative return shock – domestic market) – (δ) 0.3518 5.0536 0.0000
GARCH effect (β) 0.2588 6.3827 0.0000
Volatility spillover (ϕ1) 7.98E-05 7.7176 0.0000
Asymmetry volatility spillover (negative return shock) – (ϕ2) 7.73E-05 4.0850 0.0000
Source: Data processing result
Response of the return volatility of the Indonesia stock exchange towards the positive and negative shock from the Singapore stock exchange
Table 5. Residual variance test result
Heteroskedasticity test: ARCH
F-statistic 0.0872 Prob. F(1,984) 0.7679
Obs*R-squared 0.0873 Prob. Chi-Square(1) 0.7676
the Indonesia stock exchange becomes stronger when the Singapore stock exchange is experi-encing a negative return (compared with when the Singapore market experienced a positive return). The second asymmetry phenomenon is shown by the parameter δ which is also
sig-nificant. This shows that the volatility return
in the Indonesia stock exchange shows a dif-ferent/asymmetry response towards the shock change which happened at the previous period. The negative shock in the Indonesia stock ex-change tends to have a greater volatility effect compared to the positive shock, or in other words, the volatility has increased more after the negative shock (the decrease of the price/ return) compared with after the positive shock. Looking at the amount of the estimation param-eter (δ) and (ϕ1) it can be seen that although a
significant volatility transmission phenomenon
has taken place from the Singapore stock
ex-change to Indonesia, however, the influence
of the shock that has happened in the
domes-tic market has a greater influence towards the
volatility return of the IHSG compared to the shock which happened in the Singapore stock exchange.
Result of the test of Table 7 shows that the residual variance obtained from the Table 5
equation is homoskedastic. A shown in Table 3, the variance equation at Table 5 has indicated that the news effect towards the volatility return of the stock has a persistent character during the
period of analysis (shown by the significant β
parameter). The result of the model estimation to identify the asymmetric phase character has
also shown an important finding. The signifi -cance of the ϕ
1and ϕ2 parameters indicate that the shock as experienced at the Singapore stock exchange will be immediately transmitted to the Indonesian stock exchange, and the trans-mission of volatility spillover will be stronger when the Singapore stock exchange is in a downward phase (bear).
This finding has strengthened previous stud -ies which have analyzed the asymmetric pattern at the volatility transmission during the bear and bull markets. The volatility from one mar-ket into another marmar-ket is stronger and faster transmitted during the downward market
move-ment phase. This phenomenon is called finan -cial contagion. King and Wadhwani (1990) in their study have proven that such a contagion
is observed during the financial crisis period
of 1987, whereas Edward and Susmel (2001) and Bae et al.(2003) have proved it during the Asian and Russian crisis.
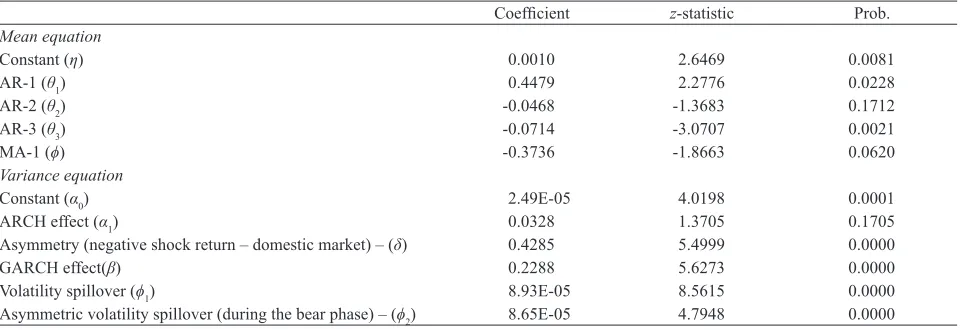
Table 6. Phase asymmetry
Coefficient z-statistic Prob.
Mean equation
Constant (η) 0.0010 2.6469 0.0081
AR-1 (θ1) 0.4479 2.2776 0.0228
AR-2 (θ2) -0.0468 -1.3683 0.1712
AR-3 (θ3) -0.0714 -3.0707 0.0021
MA-1 (ϕ) -0.3736 -1.8663 0.0620
Variance equation
Constant (α0) 2.49E-05 4.0198 0.0001
ARCH effect (α1) 0.0328 1.3705 0.1705
Asymmetry (negative shock return – domestic market) – (δ) 0.4285 5.4999 0.0000
GARCH effect(β) 0.2288 5.6273 0.0000
Volatility spillover (ϕ1) 8.93E-05 8.5615 0.0000
Asymmetric volatility spillover (during the bear phase) – (ϕ2) 8.65E-05 4.7948 0.0000
Source: data processing result
Response of the return volatility of the Indonesia stock market towards the shock from the Singapore stock exchange during the bear and the bull
Table 7. Variance residual test results
Heteroskedasticity test: ARCH
F-statistic 0.0057 Prob. F(1,984) 0.9396
Obs*R-squared 0.0058 Prob. Chi-Square(1) 0.9395
In the increasing financial market integra -tion, a better understanding about the interna-tional transmission in the shock and volatility of the return of the stock between markets will become more important. The existence of a
sig-nificant spillover volatility have brought some
important implications. First, the correlation between both markets will be strengthened in its return as well as in its volatility. Second, the correlation and the price/volatility’s spillover at the end will have an important implication for the portfolio manager, especially for those
who have stressed the importance of the benefit of diversification. This benefit will not be pro
-vided as expected, because the financial market
of the two nations will become more related to each other. Especially, during the downwards turn phase, the correlation becomes closer
be-cause it has discovered a significant proof of the
asymmetry volatility. During this phase, where the spillover becomes stronger, the usefulness
of the diversification of the international port -folio will decrease more. Third, especially, the stronger volatility transmitted when the mar-ket is at the downwards trend will cause an in-crease in the asymmetry information. Volatility and uncertainty about asset values undoubtedly are closely correlated. Instruments whose
fun-damental values change quickly are difficult to
value because trader must be certain that they have all available information when they form their value estimates. Since it is harder for trad-ers to be fully informed about volatile instru-ments, asymmetric information problems are probably become greater. When the asymmet-ric information problem is particularly severe, spread may be so wide that no trading occurs. Dealers will not make markets because the loss-es they expect from trading with well informed trader are greater than their potential trading revenue. When this happens, market has failed. Market failure explains why business is not
in-terested in financing their operation by issuing
publicly traded equity (Harris, 2003). Fourth, the asymmetry phenomenon (time varying) of the spillover volatility also automatically impli-cates that the investor is facing an investment opportunity set which have also a time varying characteristic. Of course, like Badhani (2009)
said, the next implication will be the need to develop a new approach to solve the choice of the dynamic portfolio for the investor facing an investment opportunity set which has a time varying character.
Conclusion
This research studies the asymmetry in the spillover volatility of the Singapore and Indo-nesia stock exchange during the analysis period
of January 2008 – August 2012. Specification
of the ARMA-TGARCH (1,1) model was de-veloped to investigate the asymmetry pattern in the short term return behavior (sign asymme-try) as well as in the long term return behav-ior (phase asymmetry). The important empiric
finding in this study is that the shock happened
in the Singapore stock exchange will be im-mediately transmitted to the Indonesian stock exchange. Two important asymmetric patterns detected are: (1) the transmission of the shock/ volatility return from the Singapore stock ex-change to the Indonesian stock exex-change will be stronger when the Singapore stock exchange is experiencing a negative return (a form of sign asymmetry) compared with when the Sin-gapore market experiencing a positive return; and (2) the transmission of the shock will also be stronger whenever the Singapore stock ex-change is in the declining phase and trend (bear), and this is called the phase asymmetry.
asymmetric information problem is particularly severe, spread may be so wide that no trading occurs and market becomes illiquid. Market failure explains why businesses are not
interest-ed in financing their operation by issuing pub -licly traded equity. The asymmetry phenomena
(time varying) of the spillover volatility also implicates that the new approach to solve the portfolio choice needs to be developed. This is because the investor will face a time varying investment opportunity set as an implication of time varying spillover volatility.
References
Ang, A. and Bekaert, G. (2002), International Asset Allocation with Regime Shifts, Re -view of Financial Studies, 15(4): 1137-1187. Badhani, N.K. (2009), Response Asymmetry in
Return and Volatility Spillover from the US to Indian Stock Market, The IUP Journal of
Applied Finance, 15(9): 22-45.
Bae, K.H. and Karolyi, G.A. (1994), Good News, Bad News and International Spill-overs of Stock Return Volatility between Ja-pan and the US, Pacific-Basin Finance Jour -nal, 2(4): 405-438.
Bae, K.H., Karolyi, G.A., and Stulz, R.M. (2003), A New Approach to Measuring Fi-nancial Contagion, Review of Financial
Studies, 16(3): 717-763.
Bahng, J.S. and Shin, S. (2003), Do Stock Price Indices Respond Asymmetrically? Evidence from China, Japan and South Korea, Journal
of Asian Economics, 14(4), 541-563.
Cappiello, L., Engle, R.F., and Sheppard, K. (2006), Asymmetric Dynamics in the Corre-lations of Global Equity and Bond Returns,
Journal of Financial Econometrics, 4(4): 537-572.
Chen, C.W.S, Chiang, T.C., and So, M.K.P. (2003), Asymmetrical Reaction to Stock Return News: Evidence from Major Stock Markets Based on a Double-Threshold Model, Journal of Economics and Business, 55(5-6): 487-502.
Corsetti, G., Pesenti, P., Roubini, N., and Tille, C. (1998), Competitive Devaluation: A Wel -fare-Based Approach, Mimeo, New York University.
Das, S.R and Uppal, R. (2004), Systemic Risk and International Portfolio Choice, Journal
of Finance, 59(6): 2809 – 2834.
Edward, S. and Susmel, R. (2001), Volatility Dependence and Contagion in Emerging
Eq-uity Markets, Journal of Development Eco -nomics, 66(2): 505-532.
Glick, R. and Rose, A. (1998), Contagion and Trade: Why Are Currency Crises Regional?,
NBER Working Paper, 6808.
Hansen, P.R. and Lunde, A. (2005), A Fore-cast Comparison of Volatility Models: Does Anything Beat a Garch (1,1)?, Journal of
Applied Econometrics, 20(7): 873–889. Harris, L. (2003), Trading & Exchanges; Mar
-ket Microstructure for Practitioners, Oxford University Press.
Ingyu, C. (2011), The Volatility Transmission of Stock Returns Across Asia, Europe, and North America, Managerial Finance, 37(5): 442-450.
Kanas, A. (1998), Volatility Spillovers across Equity Markets: European Evidence, Ap-plied Financial Economics, 8 (3): 245-256. King, M.A and Wadhwani, S. (1990),
Transmis-sion of Volatility between Stock Markets,
Review of Financial Studies, 3(1): 5-33. Koutmos, G. (1998), Asymmetries in the
Con-ditional Mean and the ConCon-ditional Variance: Evidence from Nine Stock Markets, Journal
of Economic and Business, 50 (3): 277-290. Koutmos, G. and Booth, G. (1995),
Asymme-tries Volatility Transmission in International Stock Markets, Journal of International
Money and Finance, 14 (6): 747-762. Lestano and Sucito, J. (2010), Spillover
Volatil-itas Pasar Saham Indonesia dan Singapura,
Jurnal Akuntansi dan Keuangan, 12(1): 17-25.
Nam, K., Pyun, C.S., and Avard, S.L. (2001), Asymmetric Reverting Behavior of Short Horizon Stock Returns: An Evidence of Stock Market Overreaction, Journal of
Banking and Finance, 25 (4): 807-824. Rigobon, R. and Sack, B. (2003), Spillovers
across US Financial Markets, MIT Sloan
Working Papers, 4304-03.