ABSTRACT
THE PERFORMANCE OF INDONESIA‟s TEXTILE INDUSTRY Bernadette Robiani1
Textile industry in Indonesia is still known as one of key indutries , eventhough for last five years, it also known as a sunset industry. The implementation of China-AFTA since January 2010, raised some arguments about the survival of this industry. The facts that for last some years imported textile from China showed an increased market share in domestic market. Most of raw materials that are used in this industry are imported from other countries such as China.. In order to have a complete perspektif about textile industry, this paper discusses about its performance. It is believed that a good industry‟s performance will determine its existence in the market.
The Performance of Indonesia’s Textile Industry
1, INTRODUCTION
Manufacturing industry in Indonesia shows an important role in the creation of national income, eventhough Indonesia is known as an agricultural country. The contribution of manufacturing industry had overcomed the contribution of agriclture sector during 1980 era. As a comparison in 1983 share of agriculture sector was 30% while manufacturing sector was 15,1% and in 1993, share of agriculture decreased to be 17,9% while manufacturing sector increased to be 22,3%),
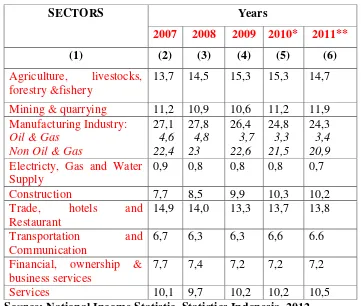
Table 1.1 Percentage Distribution of Gross Domestic Product at Current Market Prices by Industrial Origin, 2000
Source: National Income Statistic, Statistics Indonesia, 2012 *): preliminary figures
Table 1.1 above shows us the contribution of economy sectors to National absorbed, on the average, 40% of labour force while manufacturing industry absorbed , on the average 12%. As a comparison in year 2006, agriculture sector absorbed 44,4 % and manufacturing industry was 12,1%. This is unexpected condition if we related it to the dominant contribution of manufacturing industry to GDP Using value added per capita , Indonesia „s manufactring industry performed unsastified condition compare to ASEAN countries.
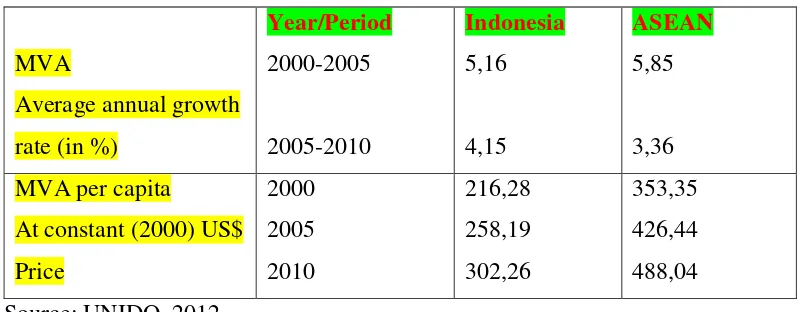
Table 1.2
Comparison Manufacturing Value Added (MVA) of Indonesia and ASEAN
growth compare to its of ASEAN. It deliveries a good investment prospect in manufacturing sector in Indonesia
In general, indeed, there are some classics problems in the industrial development in Indonesia such as the weak of industry linkages, undercapacities production, high cost production, uncompetitive prices, government regulation and law enforcement. These problems influence the performance and competitiviness of industrial sector.
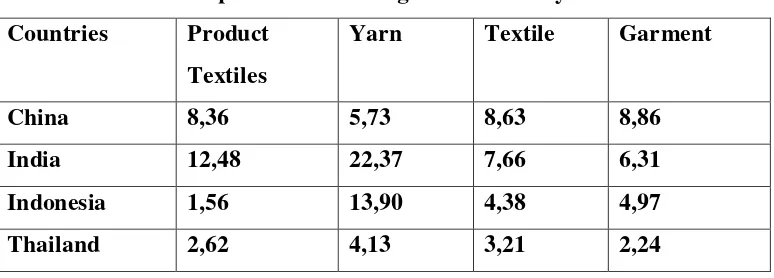
Textile and Product Textiles (TPT) industry is one that has a potential but dilematic position in Indonesia. Basically, this industry may create high value added and has high linkages to other industries in economy. However, these few years, it is classified as a “sunset industry” and has low competitiviness in world market. Data from Table 1.3 shows the Revealed Comparative Advantage of TPT industry in year 2008. It is shown that Indonesia‟s TPT still has low competitiviness compare to India and China.
Table 1.3
Revealed Comparative Advantage TPT Industry Year 2008 Countries Product
Textiles
Yarn Textile Garment
China 8,36 5,73 8,63 8,86
India 12,48 22,37 7,66 6,31
Indonesia 1,56 13,90 4,38 4,97
Thailand 2,62 4,13 3,21 2,24
Source: UNIDO, Statistics Indonesia, Ministry of Industry, Processed
Some weakness of Indonesia‟s TPT industry that effect its competitiviness are prices of the product, design product, labour productivity, market penetration.
There are some policies and programs that had been implemented by government to increase the performance of TPT industry such as restructurisation for machines and equipment program, training programs for human resources and others, however she still need some more efforts.
influence the economies of scale of industry. The lower the average variable cost will increase the economies of scale and further will increase its competitiviness. Tarmidi (1988) , Simarmata and Soesastro (1998) did research for some manufacturing industries in Indonesia and found that cost structure strongly influences the performance and competitiviness of industry.
II. PERFORMANCE of TPT INDUSTRY: Data and Analysis
This part will explain about the performance of TPT industry using input cost, labour productivity and efficiency. To describe Input cost I used ISIC Code 5 Digit. Input cost will analyze in two kind of cost, first is primary input cost that contains of expenses for labour, rent and depereciation. This expenses later creates value added of am industry. Second is Intermediate input cost that contains of raw and supporting material cost and energy cost.
II.1. Cost of Input
During 2005 – 2009, cost of input of TPT industry shows an increasing pattern Graph 1. below shows us the growth of Total Cost of Input.
Total Cost of Input
0 5E+10 1E+11 1,5E+11
2005 2006 2007 2008 2009
Years
Total
Graph 1
Growth of Cost Of Input Textile and Product Textile Industry
On the average, during observation year 2005-2009, the highest total input cost is in garment industry and the lowest is in Other Textile Industry
Table 2.1
Average Total Input Cost of Industry
On the average, the highest intermediate cost was in Other Textile industry and also gives the highest ratio to total input cost. The lowest intermediate cost was in Other Textile Fabric, however the lowest ratio is in Garment industry.
Ratio Interm ediate Input Cost to Total Cost
0,00
As mentioned before, intermediate input cost consists of raw material cost, supporting material cost and energy cost. There is an increasing ratio cost of raw and supporting material to intermediate cost during the observation year. . In year 2005 the ratio is 0,90 increased to be 0,93 in year 2009. This graph 4 below shows the allocation of intermediate input cost among TPT industry
Raw and Supporting Material and Energy Cost
0,00
There is a stable pattern for the ratio of raw and supporting material cost and also from energy cost among these five industries. The highest ratio cost of raw and supporting materials as much as 92% was in Garment and Fibre industry and it has lowest energy cost (10%). On the other hand, Yarn has the lowest raw and supporting material cost (88%) and highest cost energy (13%). Basically, the value of intermediate cost depends on the amount and the price of input tht has been used. The amount of input used can be determined by firms‟s production decision, as mentioned in production theory. Number of firms in industry will also determines the demand of input. The price of input will influence the demand for the input. Using Satistics Indonesia data for years 2006 – 2010 and ISIC Code 17 and 18, the number of firms decreased as much as 14,93 percent from 4095 unit firms decreased to be 3563 units. The dominant decreased came from Textile Industry (ISIC 17) that consist of from 1286 unit firms down to 978 unit firms.
During the observation years, it is known that about 45% of raw and supporting material cost came from imported cost. The pattern of imported raw and supporting cost tends to be fluctuated. In 2005, average imported material cost was 47% and in 2009 was 46%. There was a small decreased during those years, however there is a big decreased in year 2006 – 2007 from 46% down to 40%.
Ratio of imported raw and supporting material cost to raw and supporting material
On the average, highest imported material cost is in Fibre industry as much as 56%, and the lowest was in Textile fabric industry as much as 39%.
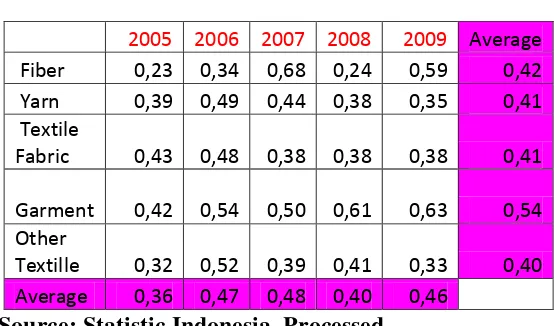
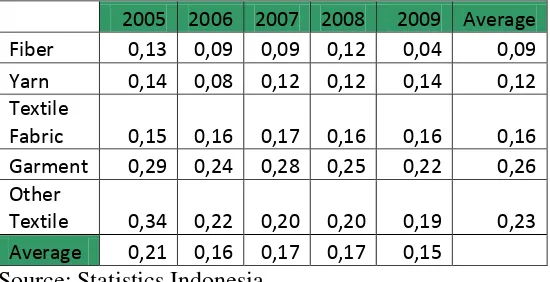
The primary input cost for TPT industry is the differences between total input cost and intermediate input cost. The high portion of intermediate cost results to small portion of primary input cost. As mentioned before, primary input cost consists of expenses for labour, rent, depereciation and other expenses. Table 2.2 shows the ratio of Primary input cost to total input cost. On the average, there is an increasing ratio primary input cost during observation years from 36% in 2005 to 46% in 2009. The highest ratio is in Garment industry and the lowest is in Other Textile industry
Table 2.2
Ratio Primary Input Cost to Total Input Cost
2005 2006 2007 2008 2009 Average
Fiber 0,23 0,34 0,68 0,24 0,59 0,42
Yarn 0,39 0,49 0,44 0,38 0,35 0,41 Textile
Fabric 0,43 0,48 0,38 0,38 0,38 0,41
Garment 0,42 0,54 0,50 0,61 0,63 0,54 Other
Textille 0,32 0,52 0,39 0,41 0,33 0,40 Average 0,36 0,47 0,48 0,40 0,46
Source: Statistic Indonesia, Processed
Table 2.3
Ratio Labor Expenses to Primary Input Cost
Labour productivity is defined as the ratio of value added to the number of paid workers. It indicates the employments capability producing goods. Table 2.3 shows labour productivity for TPT industry using 3 digit ISIC Code.
During observation years there is an increasing in labour productivity of TPT industry. On the average, the highest productivity came from Yarn and Textiles industry, as much as 76.6694 and the lowest productivity came from Kapok industry, as much as 10,8616. As mentioned in the definition, value added and number of labour will influence the productivity. Changing in both variables will determine productivity. Increasing in value added, assume number of labour constant, will increase labour productivity. Increasing in value added bigger than increasing in number of worker will result to higher productivity and means higher labour performance in one industry. During 2005 – 2009, there is a decreasing in number of labour/workers from 1129 people in year 2005 down to 948 people in year 2009, while value added increased from 38038 in year 2005 rose to 70769 in year 2009. This changing caused the increase in TPT labour productivity.
II. 3. Efficiency
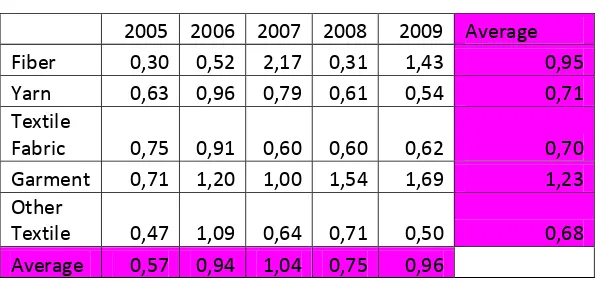
Efficiency is defined as the use of minimum resources to achieve maximum results, or comparing the received input and output. In this paper, efficiency is measured by the ratio of value added to intermediate input cost. Higher ratio means the more efficient an industry.
Table 2.4
Efficiency in TPT Industry
2005 2006 2007 2008 2009 Average Fiber 0,30 0,52 2,17 0,31 1,43 0,95 Yarn 0,63 0,96 0,79 0,61 0,54 0,71 Textile
Fabric 0,75 0,91 0,60 0,60 0,62 0,70 Garment 0,71 1,20 1,00 1,54 1,69 1,23 Other
Textile 0,47 1,09 0,64 0,71 0,50 0,68
Average 0,57 0,94 1,04 0,75 0,96
During observation years, there is an increasing efficiency in TPT industry from 0,57 in year 2005 increase to 0,96 in year 2009. On the average, the highest efficiency is in Garment industry, while the lowest efficiency is in other textile industry, see Table 2.4. This relate to the description of intermediate input above that Garment industry has low intermediate input cost and Other Textile industry has high intermediate cost.
III. Conclusion
The hypothesis of this paper is performance industry will effect the its competitiviness. From Part II, we have description of TPT industry‟s performance, first, there is an increasing cost of input; second, intermediate cost has dominant portion in cost of input and tends to decrease; third, about 90% of intermediate cost goes to raw and supporting material; fourth, about 45% of raw and supporting material is imported; fifth, the labour expenses portion is quite low; sixth, labour productivity is increasing; seventh, efficiency is increasing
The dependency to imported raw material, indeed will influence input sustainabilty and will effect to industry production. As mentioned before, TPT industry has strong backward and forward linkages, and therefore needs certainty for input. Since China and India country has double role in TPT industry , as the exported country for raw input and also as the producer of TPT product, both of them may have strong power to determine price of raw input. It put Indonesia‟s TPT in a dilematic situation.
REFERENCES
Hasibuan, Nurimansjah. (1993). Ekonomi Industri. Persaingan , Monopoli dan Regulasi. LP3ES. Jakarta
Martin, Stephen. (1994). Industrial Economics. Economic Analysis and Public Policy. Second Edition. Macmillan Publishing Company.
Scherer, F.M. 1980, Industrial Market Structure and Economi Performance. Second Edition, Rand Mc Nally, Chicago
Shepherd, William G. 1990. The Economics of Industrial Organization. Third Edition, Prentice Hall, New York.
Soesastro, Hadi. 1998. Daya Saing Industri Indonesia. Industri Elektronika. Perhimpunan Alumni Jerman.
Statistics Indonesia. Large and Medium Indicator, Some Years Publication