PHOTOCATALYTIC DECOLORIZATION STUDY OF METHYL ORANGE
BY TiO
2-CHITOSAN NANOCOMPOSITES
Imelda Fajriati
1,*, Mudasir
2, and Endang Tri Wahyuni
21
Department of Chemistry, State Islamic University Sunan Kalijaga, Jl. Marsda Adisucipto Yogyakarta 55281, Indonesia
2
Department of Chemistry, Faculty of Mathematics and Natural Sciences, Universitas Gadjah Mada, Sekip Utara Yogyakarta 55281, Indonesia
Received January 20, 2014; Accepted July 17, 2014
ABSTRACT
The photocatalytic decolorization of methyl orange (MO) by TiO2-chitosan nanocomposite has been studied.
This study was started by synthesizing TiO2-chitosan nanocomposites using sol-gel method with various
concentrations of Titanium(IV) isopropoxide (TTIP) as the TiO2 precursor. The structure, surface morphology,
thermal and optical property of TiO2-chitosan nanocomposite were characterized by X-ray diffraction (XRD), fourier
transform infra red (FTIR) spectroscopy, scanning electron microscopy (SEM), thermogravimetric analysis (TGA), and diffuse reflectance ultra violet (DRUV) spectroscopy. The photocatalytic activity of TiO2-chitosan nanocomposite
was evaluated by photocatalytic decolorization of methyl orange as a model pollutant. The results indicate that the particle size of TiO2increases with increasing of the concentration of TTIP, in which TiO2with smallest particle size
exhibit the highest photocatalytic activity. The highest photocatalytic decolorization was obtained at 5 h of contact time, initial concentration of MO at 20 ppm and at solution pH of 4. Using these conditions, over 90% of MO was able to be decolorized using 0.02 g of TiO2-chitosan nanocomposite under UV light irradiation. The TiO2-chitosan
nanocomposite could be reused, which meant that the TiO2-chitosan nanocomposites can be developed as an
effective and economical photocatalyst to decolorize or treat dye in wastewater.
Keywords:TiO2-chitosan nanocomposites; decolorization; methyl orange
ABSTRAK
Telah dilakukan studi reaksi dekolorisasi metil orange (MO) terkatalisis nanokomposit TiO2-kitosan. Studi
diawali dengan sintesis nanokomposit TiO2-kitosan menggunakan metode sol gel dengan variasi konsentrasi
titanium (IV) isopropoksida (TTIP) sebagai prekursor. Struktur, morfologi, sifat termal dan optis dikarakterisasi menggunakan X-ray diffraksi (XRD), Fourier transform infra red (FTIR) spektroskopi, scanning electron microscopy (SEM), thermogravimetric analysis (TGA), dan diffuse reflectance ultra violet (DRUV) spektroskopi. Aktivitas fotokatalitik nanokomposit TiO2-kitosan diuji dalam reaksi fotokatalisis dekolorisasi terhadap larutan metil orange
(MO) sebagai model polutan. Hasil eksperimen menunjukkan bahwa kenaikan konsentrasi TTIP akan meningkatkan ukuran partikel TiO2, di mana ukuran partikel TiO2 terkecil menghasilkan aktivitas fotokatalitik tertinggi. Reaksi
dekolorisasi fotokatalitik tertinggi dicapai menggunakan waktu kontak selama 5 jam, konsentrasi MO mula-mula sebesar 20 ppm dan pH 4. Pada kondisi tersebut, lebih dari 90% MO dapat terdekolorisasi menggunakan 0,02 g fotokatalis nanokomposit TiO2-kitosan. Lebih lanjut, nanokomposit TiO2-kitosan juga dapat diregenerasi, hal ini
berarti nanokomposit TiO2-kitosan dapat dikembangkan menjadi fotokatalis yang efektif dan ekonomis untuk
mendekolorisasi zat warna dalam limbah cair.
Kata Kunci:nanokomposit TiO2-kitosan; dekolorisasi; metil orange
INTRODUCTION
Methyl orange (MO) is one of the azo dyes that has been widely used in many applications because it is inexpensive and relatively stable during the dyeing. Methyl orange (MO) has a variety of uses such as in textiles, foodstuffs, pulp and paper, and leather industry. About 20% of synthetic dyes produced are lost in waste
Many physical and chemical processes have been applied in dye removal, including coagulation and flocculation, biosorption, photo-decomposition and ultrafiltration, membrane and electrochemical processes [2]. However, such processes still possess a number of disadvantages, as they need waste disposal sites and more advanced treatment to reduce the waste toxicity. Furthermore, treatment of liquid waste with such methods may take a longer time, much more energy as well as price.
Photocatalytic treatment is an attractive alternative technique for the removal of dyes. It can result in complete mineralization of organic compounds to carbon dioxide, water and mineral acids. The major advantages of photocatalysis technology are as follows [3]: (i) Photocatalysis offers a good substitute for the energy-intensive conventional treatment methods for using renewable and pollution-free solar energy, (ii) This process can be used to destroy a variety of organic hazardous compounds in different wastewater streams, and (iii) Secondary waste generation is minimalized.
Among many photocatalysts that have been used, so far TiO2is one of photocatalyst that has been found to
be good for treating dye containing waste. However, its application in photocatalytic degradation is limited due to difficulty in separating the photocatalyst and it is normally less active photocatalyst. In order to address the problem, a number of researchers have focuses their attention to prepare nano-size TiO2 as well as modify
TiO2by immobilization in a host material by making TiO2
in the nanoparticle. TiO2 nanoparticle can improve their
photocatalytic activity because then surface area increases as a result of smaller particle size. It is concomitant with enhancement of chemical activity of TiO2. The chemical activity is connected with several
structural and electronic size-related effects and also the photochemical and photophysical activities by reduction of light scattering [4]. In addition, immobilization of TiO2
in a host material may leads to easier handling and separating of TiO2from the water phase easier.
A number of host materials have been used as supporting agent for TiO2 immobilization, such as resin
[5], zeolite [6], active carbon [7], silica [8] and fiberglass [9]. The resulted materials are usually quite rigid, expensive and not environmentally friendly. The recent research demonstrated that biomaterials are considered as a good choice for supporting inorganic materials such as metal oxide photocatalyst, resulting in organic/inorganic hybrid and nanocomposites [10-11]. Chitosan has been reported to be one of biomaterials deemed suitable and excellent bio-matrix for the synthesis of nanosized particles or quantum dots of various inorganic photocatalysts. Chitosan can effectively prevent nanoparticles from agglomeration during growth [12]. Immobilization of TiO2 nanoparticles
in the chitosan matrix is expected to solve the recovery problem of nanosized powder materials.
In the present study, therefore we investigated the use of chitosan as an alternative supporting agent to prepare TiO2nanoparticle photocatalyst. The synthesis
of TiO2 nanoparticles was carried out in-situ in the
chitosan matrix at room temperature followed by an aging process [13]. The photocatalytic activity of the obtained photocatalyst was systematically examined in the decolorization process of a model dye pollutant.
Methyl orange (MO) was selected as a model dye pollutant to evaluate the decolorization activity of the photocatalytic TiO2-chitosan nanocomposites. The
synthesis of TiO2-chitosan nanocomposite was
conducted using various concentrations of Titanium(IV) isopropoxide (TTIP) as the TiO2 precursor in order to
obtain the nanocomposite composition with the highest photocatalytic activity. A number of factors influencing the photocatalytic decolorization of the dye were studied, including the contact time between photocatalyst and MO, the initial pH as well as the initial concentration of MO solution. As a reference, TiO2 powder (bulk) was also used in the photocatalytic
process of MO decolorization using the same conditions.
EXPERIMENTAL SECTION
Materials
Titanium(IV) isopropoxide (TTIP) was purchased from Sigma-Aldrich. Acetic acid 99.8% and Methyl orange (C14H14O3N3SNa) was purchased from Merck.
Chitosan (with 87% degrees of deacetylation) was purchased from Biotech Surindo Cirebon of Indonesia. aquabidestilate and deionized water were supplied by Pharmaceutical Laboratories Jakarta. All chemicals were of reagent grade, and no additional purification was done.
Instrumentation
Magnetic stirrer hotplate (Cimarec Barnstead Thermolyne) was used to prepare the solutions, centrifugation was carried out using Boeco C-28 Centrifuge (Model BOE 1205-13, Boeckel & Co, Hamburg, Germany) and the drying process was done using an oven (Thermoline Electric from Heareus). The photocatalytic decolorization of MO was conducted using a closed photoreactor equipped with 40 watt of UV lamp, operated at 290–390 nm as well as magnetic stirrer [14].
sample was heated from 30 °C to 900 °C at the scanning rate of 10 °C. min-1under dynamic nitrogen atmosphere. The structure, phase composition and the average crystallite size of TiO2-chitosan nanocomposites were
determined using the powder and plate XRD technique. The patterns were recorded on a Shimadzu X-ray Diffractometer 6000 (XRD) using Cu Kα X-ray tube at 1.5460 Å, 40 kV and 30mA with scan steps of 1° min−1 over the 2θ range of 20°–80°. The chemical functional groups were examined using a Fourier Transform Infrared Spectrophotometer (Shimadzu) and a KBr pellets in the wavelength range of 400.0–4000.0 cm-1. The surface morphology was studied by scanning electron microscope (SEM) using JEOL JSM–6360. The optical property was studied by Diffuse Reflectance UV-VIS Spectra Shimadzu UV 1700 Pharmaspec. The decolorization process of MO was monitored by Spectrophotometric Ultraviolet Visible Shimadzu at 464 nm.
Procedure
Preparation of TiO2sol by aging at room temperature The chitosan solution was prepared by dissolving 3 g chitosan in 100 mL acetic acid 1% solution, followed by vigorous stirring at room temperature for 24 h. Fifty milliliters of Titanium(IV) isopropoxide (TTIP) was added dropwise into 500 mL of deionized water containing 50 mL of acetic acid solution under vigorous stirring at room temperature for 24 h. The obtained mixture is labeled as TTIP sol. Freshly prepared TTIP sol was then stored without stirring at room temperature and atmospheric pressure. It became transparent within one week.
Preparation of TiO2-chitosan nanocomposites and TiO2powders
TTIP sol was used to prepare TiO2-chitosan
nanocomposites by sol-gel technique. Different amount of the TTIP sol was added to chitosan solution 3% (w/v) to reach the desired concentrations of TTIP (mol/L): 0.13, 0.33, 0.65 and 1.3, under vigorous stirring at room temperature for 24 h. The resulted nanocomposites was then stored without stirring at room temperature and atmospheric pressure in two weeks (14 days). The nanocomposites was then dried at 80 °C for 60 min in a preheated oven. Finally, the nanocomposites was washed with aquabidestilate until pH 6–7, and then dried again at 80 °C for 60 min in a preheated oven. Various TTIP concentration of 0.13, 0.33, 0.65 and 1.3 mol/L were used to prepare different TiO2-chitosan
nanocomposites to produce samples named as NK 0.13, NK 0.33, NK 0.65 and NK 1.3 respectively.
TiO2 powder (bulk): Fifty milliliters of 3% sodium
carbonate solution were added dropwise into the
corresponding TTIP sols under vigorous stirring until precipitation occurred. The formed suspension were centrifuged at 3000 rpm for 5 min, followed by removal of the liquid phase. The precipitates of TiO2 bulk were
then washed with water and dried at 100 °C for 60 min in a preheated oven. Finally, the precipitates of TiO2
bulk crushed to TiO2powder.
Photocatalytic decolorization of methyl orange (MO) by TiO2-chitosan nanocomposites
0.02 g of each TiO2-chitosan nanocomposite (NK
0.13, NK 0.33, NK 0.65 and NK 1.3) were added to 20 mL of MO (20 mg/L) in an Erlenmeyer flask and placed in the photoreactor, and it was allowed to react a different contact time (1–8 h, with one hour interval). Afterwards, the mixture was centrifuged at 3000 rpm for 5 min. The filtrate was taken out and measured by UV-Vis at 464 nm. This experiment was then repeated for different concentrations of MO (10, 20, 30, 40 and 50 mg/L) and pH (2, 3, 4, 5, 6, 7, 8). As a reference, TiO2powder (bulk) was also used for the photocatalytic
process using the same conditions.
RESULT AND DISCUSSION
Characteristics of TiO2-Chitosan Nanocomposites
FTIR Spectroscopy
Functional group of TiO2-chitosan nano
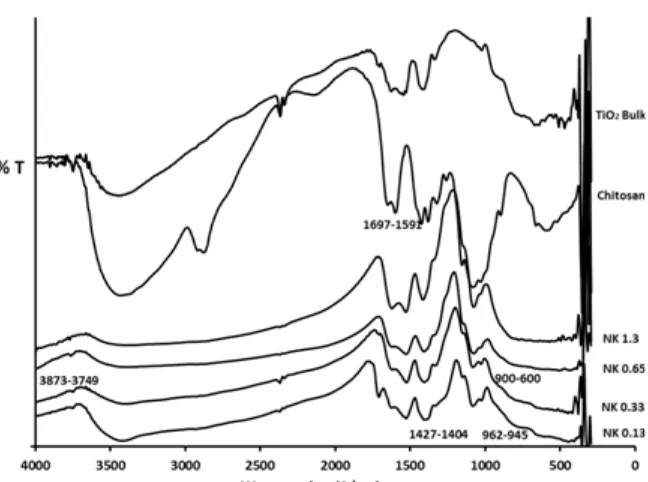
composites at various TTIP concentrations were characterized by Fourier Transform Infra Red (FTIR) spectroscopy. Fig. 1 compares the FTIR spectra of chitosan bulk, TiO2 bulk and TiO2-chitosan
nanocomposites (NK 0.13, NK 0.33, NK 0.65 and NK 1.3).
Close examination of the absorption bands of the IR spectra of TiO2, chitosan bulk and the IR spectra of
the TiO2-chitosan nanocomposite, it reveals that the IR
spectra in general exhibit similar shifts of some the typical absorption bands as well as new absorption bands as TTIP concentration in the nanocomposites is varied. The IR spectra of TiO2and chitosan bulk clearly
show a new wide O–Ti–O band at the range of 600– 900 cm−1, which can be ascribed to the presence of TiO2 network on chitosan matrix. This interpretation is
supported by the existence of inter-phase compatibility which can be observed from the appearance of bands at 962 cm−1 and 945 cm−1, indicating that the interaction of Ti Lewis sites with the NH2 groups from
chitosan chain exists [15]. The increase in the band intensity probably corresponds to the increase of TTIP concentration in the nanocomposites.
In addition, the band shift at around 1427 cm-1to 1404 cm−1 in TiO2-chitosan nanocomposite can be
Fig 1.FTIR spectra of chitosan bulk, TiO2bulk and TiO2–chitosan nanocomposites (NK 0.13, NK 0.33, NK.1.65 and
NK 1.3)
Fig 2.The hypothetic interaction between TiO2and chitosan
in the chitosan structure which forms hydrogen bond to Ti site [16]. In the region wavenumber of 3749 to 3873 cm−1, the spectral transmittance also appears as sharper bands in TiO2-chitosan nanocomposites,
indicating that hydroxyl groups of chitosan has been attached to titania network. From this evidence, it can be assumed that hydrogen bond is one of the possible interactions between chitosan and TiO2 [17]. The
hypothetic interaction between chitosan and TiO2 is
illustrated in Fig. 2.
Some researchers has suggested that the formation of Lewis acid-base interaction and hydrogen bond between the functional groups in chitosan and other substances can also be considered as a way for chitosan to stabilize its interactions. Thus, the insertion of TiO2 into the chitosan matrix may result in two
possible interactions, hydrogen bond and Lewis
acid-base interaction between the functional group of chitosan and Ti site as can be seen in Fig. 2.
Thermogravimetric Analysis (TGA)
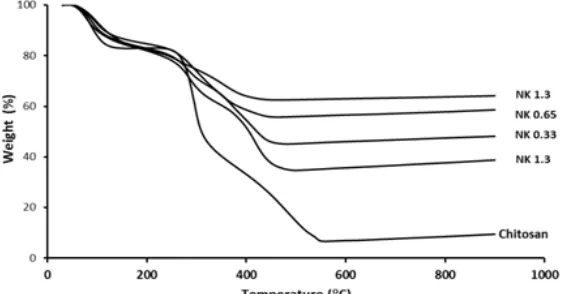
The thermal stability of chitosan bulk and TiO2
-chitosan nanocomposites (NK 0.13, NK 0.33, NK 1.65 and NK 1.3), has been thoroughly investigated to determine the amount of TiO2 particles bound to the
chitosan matrix. The result of TGA measurement is shown in Fig. 3 as a TG curve.
As clearly seen in Fig. 3, TG curves of the TiO2
Fig 3.TG curve of chitosan bulk and TiO2–chitosan nanocomposites (NK 0.13, NK 0.33, NK 0.65, and NK 1.3)
Table 1.Influence of TTIP concentrations (mol/L) introduced into the chitosan matrix on the amount of loaded TiO2
Types of TiO2– chitosan
nanocomposite
[TTIP] (mol/L)
Amount of loaded TiO2
in the TiO2–chitosan nanocomposite
(% w/w, TGA)
NK 0.13 0.13 30
NK 0.33 0.33 35
NK 0.65 0.65 45
NK 1.3 1.30 55
absorbed water on the surface of chitosan bulk and TiO2-chitosan nanocomposites. The second stage
weight loss started from 250 to 450 °C observed for TiO2-chitosan nanocomposite may be correlated to the
decomposition of chitosan and vaporization and elimination of volatile products [18]. The weight loss at this stage can also be correlated with the amount of titania introduced/immobilized into the chitosan matrix frame. The increasing amount of the TTIP in the chitosan matrix results in the decrease of the decomposition temperature of nanocomposite due to less amount of chitosan available in the nanocomposites.The third stageof TG curve shows that the curves for TiO2-chitosan nanocomposite reach a
plateau at about 450 °C, indicating the complete degradation of chitosan. While chitosan bulk leaves weight percentage of residue of 10% at 900 °C which is proportional to the residual organic group [19], TiO2-chitosan nanocomposite at the same temperature
still have left weight of around or higher than 40% relative to their initial weight, suggesting that the TiO2
-chitosan nanocomposites exhibits better thermal stability than the chitosan bulk [16].
The influence of TTIP concentration introduced into the chitosan matrix on the weight of TiO2 formed after
complete thermal degradation for TiO2-chitosan
nanocomposites (%wt/wt) is summarized in Table 1. Table 1 shows that the increase in TTIP concentration leads to the increase of the weight of TiO2
formed in the TiO2-chitosan nanocomposite. This
indicates that the increase of TTIP concentration as TiO2
precursor enhances the seed required for growth of TiO2
crystal. As a result, the amount of TiO2 that can be
loaded into the TiO2-chitosan nanocomposite also
increases.
XRD Spectroscopy
X-Ray Diffraction (XRD) analysis was carried out to confirm the presence of TiO2polymorphs and crystal
phases. X-Ray diffraction pattern of the TiO2-chitosan
nanocomposite at various TTIP concentrations is shown in Fig. 4. It can be seen that the only observed peaks are at 2 of 25.4°, 38.0° and 48.0° which characteristically correspond to anatase crystal phase, and there is no single peak observed for brookite in the nanocomposite, suggesting that only TiO2 anatase is
formed during the preparation of nanocomposites. Striking examination of Fig. 4 also reveals that the increase in the TTIP concentration increases the amount of the crystal phase in the TiO2-chitosan
nanocomposite, as indicated by higher relative intensities of the peaks for NK 1.3. This result is in good agreement with that of previous finding from TGA analysis. The peak sharpness of the XRD patterns also indicates the particle size of TiO2, the sharper the band,
the smaller the particle size. The crystallite size of TiO2
in nanocomposite can be calculated from XRD line broadening using the Scherrer equation:
cos K
L
(1)
where L is the crystallite size of TiO2 in
Fig 4.XRD Patterns of chitosan bulk, TiO2bulk, and TiO2–chitosan nanocomposite (NK 0.13, NK 0.33, NK 0.65, and
NK 1.3)
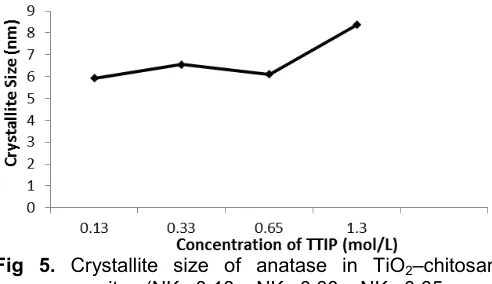
Fig 5. Crystallite size of anatase in TiO2–chitosan
nanocomposite (NK 0.13, NK 0.33, NK 0.65, and NK 1.3)
half-peak width, and θ is the half diffraction angle of the centroid of the peak in degree. The average crystallite sizes of anatase in TiO2-chitosan nanocomposite in Fig.
5.
Fig. 5 gives the typical values of anatase crystallite size in TiO2-chitosan nanocomposite as calculated using
Scherrer`s equation. It is clearly shown that the crystallite size of anatase is in the range of 5–10 nm. This size of TiO2 in chitosan indicates that chitosan
biopolymer is able to hinder the crystal growth of titania as indicated by the uniformed value of the particle size of TiO2. Fig. 5 also shows that increasing TTIP
concentration (NK 0.13 up to NK 1.3) results in the increase of the particle size of TiO2. Thus, it is obvious
that at higher TTIP concentration, the TiO2 nanoparticle
seeds formed during the preparation became relatively close to each other and this shorter inter-particle distance give good facilities for the particle growth. Therefore, it may then be concluded that in addition to the chitosan matrix that gives limited space for TiO2 to
grow, the precursor concentration can also contribute to the formation of the particle size [20].
It was also observed, however, that there is a trend change when TTIP concentration is increased for NK 0.13 to NK 0.33, where the crystallite size of TiO2is
becoming smaller with the increase in the concentration of TTIP. This is probably due to the structural change of chitosan from a stretched chain into a coiled one, and finally it changes into inter-twisted coils or four-fold helix to produce an asymmetric disaccharide unit [21]. This process is expected to be the limiting factor of the crystal growth. Further increase of TTIP concentrations at higher concentration than 0.65 mol/L as found in NK 0.65, however, causes TTIP to form bulkier structure outside the structure of chitosan, leading to the formation of larger particles.
According to Wang et al. [20], chitosan plays an important role in TiO2 nanoparticles growth. The
proportion of chitosan between acetylated and non-acetylated residues is considered to be responsible for the balance between hydrophilic and hydrophobic interactions. Researchers have concluded that chitosan molecular chains are able to form some hydrophobic microdomains because of their self aggregation behavior. Chitosan chains may undergo structural transformation from stretched chains into coils and further transformed into inter-twisted coils which is a hydrophobic microdomains with increasing concentration of TTIP during the aggregation process. The macromolecule structure of inter-twisted coils becomes quite compact so that the movement of the macromolecule is restricted. Such properties of chitosan enable the formation of a dispersed chitosan nanoparticles. As a result, TiO2 nucleation and growth
Fig 6. Ultraviolet spectra of nanocomposite TiO2
-chitosan (NK 0.13, NK 0.33, NK 0.65 and NK 1.3)
Fig 7. SEM images of chitosan bulk and TiO2-chitosan
nanocomposite (NK 0.13, NK 0.33, NK 0.65 and NK 1.3)
Table 2. The band gap energy of TiO2-chitosan
nanocomposites Type of TiO2-Chitosan
Nanocomposite
Wavelength Edge (nm)
Eg (eV)
NK 0.13 388 3.192
NK 0.33 391 3.166
NK 0.65 380 3.258
NK 1.3 403 3.073
DR-UV Spectroscopy
Diffuse Reflectance Ultraviolet (DR-UV) Spectroscopy has been used to investigate optical properties and electronic band of TiO2-chitosan
nanocomposite at various TTIP concentrations. Fig. 6 shows the absorption spectra of the TiO2-chitosan
nanocomposites (NK 0.13, NK 0.33, NK 0.65, and NK 1.3). From this figure, it is observed that the TiO2-chitosan nanocomposite exhibits an absorption
edge ranging from 300 to 450 nm which corresponds to the absorption edge of semiconductor material.
It is clear that the increase in TTIP concentration shifts the absorption bands of TiO2 to a higher
wavelength (red shift), which also indicates an increase in particle size of TiO2. This should mean that the
particle size can be arranged as NK 0.13 < NK 0.33 < NK 1.3. However, the NK 0.65 has the shortest max,
indicating that its particle size is the smallest. This result agrees very well with that obtained from the calculation of particle size using Scherrer equation as previously discussed.
Table 2 shows the band gap energy of TiO2-chitosan nanocomposites obtained from DR-UVS
analysis. The band gap (Eg) determination has been extracted by calculating the absorbance of TiO2-chitosan nanocomposites, while the edge
wavelength is obtained by extrapolating the wavelength curve (Fig. 6) to intersect with X-axis [22].
As can be seen in Table 2, the increase in TTIP concentration in the chitosan matrix for NK 0.13 up to NK 1.3 increases the amount and bulk of TiO2 formed
in TiO2-chitosan nanocomposite. The bulk of TiO2
results in the increase of the particle size and therefore decreases the band gap energy. The result of the calculation of band gap energy is in agreement with the result obtained from the determination of TiO2 particle
size as previously discussed in Fig. 6, i.e. the increase in particle size gives rise to the lower band-gap energy.
SEM images
In this study Scanning Electron Microscope (SEM) has been used to analyze the morphology of the TiO2-chitosan nanocomposite. The morphology of the
TiO2-chitosan nanocomposites for NK 0.13, NK 0.33,
NK 0.65 and NK 1.3 can be observed from SEM images in Fig. 7.
Fig. 7 shows the change in the morphology and texture of the surface of TiO2-chitosan nanocomposite.
The images show that there is an increasing roughness throughout the surface of the TiO2-chitosan
nanocomposite with the increase of loaded titania. It can also be seen that the macroreticular structure of TiO2 particles observed on the surface area of
TiO2-chitosan nanocomposite increases tremendously
Fig 8.The influence of contact time on the photocatalytic decolorization of methyl orange (MO) by TiO2 bulk and
TiO2-chitosan nanocomposites for NK 0.13, NK 0.33,
NK 0.65 and NK 1.3 (MO concentration: 20 ppm; TiO2
bulk and TiO2-chitosan nanocomposite dosage: 0.02 g)
Fig 9. The influence of pH of MO solution on the
photocatalytic decolorization of methyl orange (MO) by TiO2 bulk and TiO2-chitosan nanocomposites for
NK 0.13, NK 0.33, NK 0.65 and NK 1.3 (MO concentration: 20 ppm; TiO2 bulk and TiO2
-chitosan nanocomposite dosage: 0.02 g)
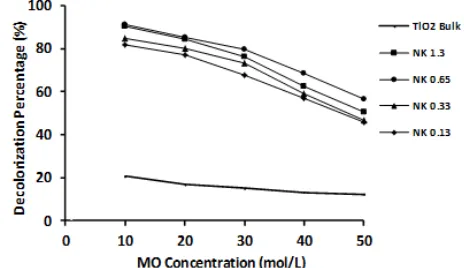
Fig 10. Influence of initial concentration of MO solution on the photocatalytic decolorization of methyl orange (MO) by TiO2 bulk and TiO2-chitosan for NK 0.13,
NK 0.33, NK 0.65 and NK 1.3 (MO concentration: 20 ppm; TiO2 bulk and TiO2-chitosan nanocomposite
dosage: 0.02 g)
particles is the outcome of synthesis process that takes place during the condensation stage. Homogeneous dispersion of TiO2 nanoparticle in chitosan matrix is one
of the most important factors to increase the photocatalytic activity of the nanocomposites [23].
Photocatalytic Decolorization of Methyl Orange by TiO2-Chitosan Nanocomposites
Influence of contact time, pH and initial
concentration of MO solution
Contact time, pH and initial concentration of MO solution are important parameters to be studied systematically in this experiment. In real application, these parameters play an important role in dye wastewater treatment and become important parameters influencing photo-oxidation process. The influence of these parameters on the photocatalytic decolorization of
MO by TiO2-chitosan nanocomposites was investigated
using spectrometric analysis. The influence of contact time, pH and initial concentration on the photocatalytic decolorization of methyl orange is illustrated in Fig. 8-10.
Fig. 8-10 shows that the decolorization of MO using TiO2 bulk is much lower than that of
TiO2-chitosan nanocomposites. This may be due to the
particle size of TiO2 bulk which is relatively larger, and
thus reducing the effectiveness of the decolorization. At smaller particle size, quantum size effect occurs, resulting in a higher energy (favorable for the occurrence of photodegradation), which produces a much higher surface area of the titania. The higher surface area facilitates more contact between the photocatalyst and MO substrate. From the study it has been found that the optimum photocatalytic decolorization was achieved at 5 h of contact time. After 5 h, the photocatalytic decolorization did not show any significant increase as shown in Fig. 8.
The influence of pH of medium solution on the photocatalytic decolorization of MO can be seen in Fig. 9. The results show that the optimum photocatalytic decolorization of MO using TiO2-chitosan
nanocomposites is achieved at pH 3. The influence of pH on the decolorization process of MO might be related to the ionization state of MO as well as to the surface state of the photocatalyst, as well explained by Eq. 2 and 3, as also by Fig. 11.
The surface of TiO2 can be denoted as >TiOH
(titanol group) in aqueous solution. When pH of the solution is higher than 7, however, the surface state of photocatalyst becomes negatively charged according to the following ionization equilibrium [24]:
-2
N
Fig 11. The effects of pH on the ionization state of methyl orange molecule
Fig 12. Recycle and reuse of NK 0.65 for MO
decolorization (MO concentration: 20 mg/L; TiO2
-chitosan nanocomposite dosage: 0.02 g, pH 4; irradiation time: 5 h)
And at pH below 4, the ionization equilibrium is: + +
2
TiO + H TiOH (3)
It can be seen from Eq. 2 and Eq. 3 that TiO -species on the surface of photocatalyst is dominant at alkaline condition while TiOH2
+
species is dominant at acidic condition. Similarly, the ionization state of MO is also pH dependent as illustrated in Fig. 11 [25].
According to Barka et al. [25], the rate constant of MO degradation decreases at pH higher than 3, which corresponds to the decreasing amount of TiOH2
+
species. On the other hand, the adsorption of MO on the surface of photocatalyst becomes unfavorable at alkaline solution (higher pH) due to electrostatic repulsion forces between-SO3
-of MO and TiO- species on the surface of photocatalyst which are predominant in this range of pH. Therefore, it is reasonable to observe that the highest activity of photocatalytic decolorization of MO is achieved at pH 3.0 because at this pH the electrostatic attraction between the positively charged catalyst surface and MO anion is most favorable, leading to the increase the degree of adsorption of substrate in the surface of photocatalyst and hence speed up the photodecolorization process of MO.
The influence of the initial concentration of MO on the photocatalytic decolorization by TiO2-chitosan
nanocomposites were evaluated using different initial MO concentration of 10.0, 20.0, 30.0, 40.0 and 50.0 mg/L and the result is given in Fig. 11. In general, it can be observed that the decolorization percentage for all variation of TTIP concentration decreases markedly with the increase in the initial dye concentration. As the amount of photocatalyst in the solution is constant, this decrease can be attributed to the capacity of TiO2-chitosan nanocomposite in
adsorbing ionic groups of dye compounds on the photocatalyst surface as the concentration of MO increases, thus the capability of photocatalyst to initiates photo-oxidation also decreases.
Recycling/Reuse of the TiO2-chitosan nano composite
For the purpose of further practical implementation such as in the real waste water treatment, it is important to evaluate the stability and durability of photocatalyst. In this study, we have made the 5 running experiments using the same photocatalyst to test its stability and durability and the results are shown in Fig. 12. For each running experiment, the same photocatalysts have been used for the decolorization of freshly prepared MO solutions under similar conditions after filtering, washing and drying photocatalyst that has been used in the previous running experiment.
As can be seen in Fig. 12, the percentage of MO decolorization slightly decreases after the second running/cycle. The results indicate that the photocatalytic activity of the TiO2-chitosan
that the TiO2-chitosan nanocomposite photocatalyst
could be reused.
CONCLUSION
TiO2-chitosan nanocomposite has been
synthesized successfully by sol gel method using various TTIP concentrations. The characterization results suggest that TiO2 nanoparticle has been formed
in the chitosan matrix. The particle size of TiO2formed in
the chitosan matrix is influenced by concentration of TTIP. Increasing TTIP concentration has been found to increase the particle size of TiO2, leading to the lower
band gap energy.
Results of photocatalytic decolorization study of MO demonstrate that smaller particle size of TiO2
exhibits the higher photocatalytic activity. Experimental parameters including contact time, pH and initial concentration of MO solution affects significantly the photocatalytic activity. The optimum photocatalytic decolorization achieves at 5 h of contact time, MO initial concentration of 20 ppm and solution pH of 4. At these conditions of experiment, over 90% of MO has been able to decolorize using 0.02 g of TiO2-chitosan
nanocomposite under irradiation by UV light. From the recycling study of the TiO2-chitosan nanocomposite, it
has been observed that the photocatalyst is still able to decolorize MO solution up to five times of usage. This finding should indicate that TiO2-chitosan
nanocomposite photocatalyst could be used at a relatively low cost and therefore would be very beneficial in the practical application such as in the dye wastewater treatment.
ACKNOWLEDGEMENT
First author (IF) gratefully acknowledges The Institute for Educational Fund Management (LPDP), Ministry of Finance RI for the partial support of this research in the year of 2013.
REFERENCES
1. Guettai, N., and Amar, H.A., 2005,Desalination, 185 (1-3), 439–448.
2. Robinson, T., McMullan, G., Marchant, R., and Nigam, P., 2001, Bioresour. Technol., 77 (3), 247– 255.
3. Kabra, K., Chaudhary, R., and Sawhney, R.L., 2004, Ind. Eng. Chem. Res., 43 (24), 7683–7696.
4. Fernández-García, M., Wang, X., Belver, C., Hanson, J.C., and Rodriguez, J.A., 2007, J. Phys. Chem. C, 111 (2),674-682.
5. Wahyuni, E.T, Kunarti, E.S., and Mudasir, 2010, J. Ion Exch., 21 (3), 304–309.
6. Fatimah, I., and Wijaya, K., 2006,Teknoin, 10 (4), 257–267.
7. Andayani, W., and Sumartono, A., 2007, Indo. J. Chem., 7 (3), 238–241.
8. Pandiangan, D.K., and Simanjuntak, W., 2013, Indo. J. Chem., 13 (1), 47–52.
9. Shifu, C., Xueli, C., Yaowu, T., and Mengyue, Z., 1998, J. Chem. Technol. Biotechnol., 73 (3), 264– 268.
10. Zhao, X., Li, Q., Zhang, X., Su, H., Lan, K., and Chen, A., 2010,Environ. Prog. Sustainable Energy, 30 (4), 567–575.
13. Fajriati, I., Mudasir, and Wahyuni, E.T., 2013, Proceeding of The 3rd Annual Basic Science Int`l Conference 2013, Faculty Mathematic and Natural Science, University of Brawijaya, Malang of Indonesia, C1–C10.
14. Wahyuni, E.T., Aprilita, N.H., Hayu, A.H. F., Nurhayati, F.S., 2008, Jurnal Manusia dan Lingkungan, 15 (1), 10–15.
15. Al-Sagheer, F.A., and Merchant, S., 2011, Carbohydr. Polym., 85 (2), 356–362.
16. Tao, Y., Pan, J., Yan, S., Tang, B., and Zhu, L., 2007,Mater. Sci. Eng., B, 138 (1), 84–89.
17. Li, Q., Su, H., and Tan, T., 2008,Biochem. Eng. J., 38 (2), 212–218.
18. Zhu, H., Jiang, R., Fu, Y., Guan, Y., Yao, J., Xiao, L., and Zeng, G., 2012,Desalination, 286, 41–48. 19. Zhua, H., Jiang, R., Xiao, L., Chang, Y., Guan, Y.,
21. Lertworasirikul, A., Noguchi, K., Ogawa, K., and Okuyama, K., 2004, Carbohydr. Res., 339 (4), 835–843.
22. Murphy, A.B., 2007, Sol. Energy Mater. Sol. Cells, 91 (14), 1326–1337.
23. Díaz-Visurraga, J., Meléndrez, M.F., García, A., Paulraj, M., and Cárdenas, G., 2010, J. Appl. Polym. Sci., 116 (6), 3503–3515.
24. Hoffmann, M.R., Martin, S.T., Wonyong, C., and Bahnemann, D.W., 1995,Chem. Rev., 95 (1), 69– 96.