Enforcement on Fertility, Parental
Investments, and Child Well-Being
Anna Aizer
Sara McLanahan
A B S T R A C T
Increasing the probability of paying child support, in addition to increasing resources available for investment in children, also may alter the incentives faced by men to have children out of wedlock. We find that strengthening child support enforcement leads men to have fewer out-of-wedlock births and among those who do become fathers, to do so with more educated women and those with a higher propensity to invest in children. Thus, poli-cies that compel men to pay child support may affect child outcomes through two pathways: an increase in financial resources and a birth selection process.
I. Introduction
Between 1970 and 1989, the proportion of children living in poverty grew by nearly one third, with most of the increase attributable to the increase in sin-gle-mother families (Lerman 1993). In response to these changes, and in an effort to compel absent fathers to provide financially for their children, federal and state government officials began pursuing policies designed to strengthen child support enforcement. Not only have child support payments increased during the past 20 years (Case, Lin, and McLanahan 2003), but income from child support appears to have beneficial effects on children over and above income from other sources (Knox and
Anna Aizer is a professor of economics at Brown University and NBER; Sarah McLanahan is a professor of economics at Princeton University. The authors would like to thank Jeanette Chung, Janet Currie, Pedro Dal Bó, Angie Fertig, Len Lopoo, Irv Garfinkel, Princeton University seminar participants, and the MacArthur Network on the Family and the Economy for useful comments. The authors would also like to thank the Bendheim-Thoman Center for Research on Child Wellbeing at Princeton University which is supported by grant 5 R01 HD36916 from the NICHD and the Office of Population Research at Princeton University which is supported by grant 5 P30 HD32030 from the NICHD and the Center for Health and Well-being at Princeton University. The data used in this article can be obtained beginning August 2006 through July 2009 from Anna Aizer, Brown University Department of Economics, 64 Waterman Street, Providence, RI 02912 or by emailing aizer@brown.edu.
[Submitted April 2004; accepted June 2005]
Bane 1994; Graham, Beller, and Hernandez 1994; Knox 1996). To account for the lat-ter, researchers hypothesize five potential mechanisms: (1) child support income is more likely to be spent on children, as compared with other income; (2) child support alters family dynamics (between mothers and fathers) in a positive way; (3) child sup-port reduces mothers’ reliance on welfare and increases employment and marriage; (4) mothers invest more in their children as a signal to absent fathers of their com-mitment to the child in order to obtain more child support in the future; and finally (5) child support is positively correlated with father-involvement and commitment to the child. The first four mechanisms are typically characterized as causal, while the last is considered a selection effect (Argys, Peters, Brooks-Gunn, and Smith 1998).
Attempts to distinguish among the five mechanisms have been hampered by the dif-ficulties inherent in empirically identifying the separate effects.1We posit an alter-native explanation that can be identified empirically—that stricter child support enforcement creates incentives for men to have fewer children outside marriage, and for those who do, to partner with women who are more likely to invest in their chil-dren independent of child support receipt. Thus unlike previous research that posits eithera causal effect orselection, we posit that stricter child support enforcement causes positive selection on the maternal qualitywhere quality refers to a mother’s own level of human capital and propensity to invest in her children. As such, we might expect current policies of stricter child support enforcement to have positive effects on bothpresent and future child outcomes. Positive maternal selection also provides theoretical support for two of the five previously mentioned mechanisms (that child support income is more likely to be spent on the child and that child support may reduce reliance on welfare) since higher quality mothers are more likely to invest in their children and less likely to rely on welfare.
In the first part of this paper we discuss the incentives generated by stricter child support enforcement policies, how they affect the fertility of single women, and how they change the average underlying characteristics of single mothers. The discussion incorporates the interaction between state policies of stricter child support enforce-ment and the major public program serving single women with children—the AFDC program. We predict that under certain assumptions, increasing the probability that fathers will be required to pay child support results in (1) fewer children born to moth-ers who are most likely to use AFDC, and (2) more births to women with a higher underlying propensity to invest in children.
The intuition behind the first prediction is based on the fact that all child support payments received by women on welfare are taxed nearly 100 percent by the state. Thus stricter enforcement does not provide single women who are likely to rely on welfare with incentives to have children. In contrast, stricter enforcement provides
men with clear disincentives to have children, especially if their payments go to the state rather than to the mother of their child. The intuition behind the second predic-tion—that stricter child support enforcement will lead to a change in the underlying composition of single women—is that, given men’s inability to control how their child support dollars are spent (on the child or the mother), stronger child support enforcement provides them with an incentive to have children with women who have a greater underlying preference for investing in children.
In the second part of this paper we provide empirical support for the two predictions of the model and employ an identification strategy that enables us to isolate this par-ticular mechanism empirically. First, we use annual data on state expenditures for child support enforcement and on natality for the period 1985–98 to estimate the impact of increasing the probability that fathers will have to pay child support on nonmarital childbearing and maternal investments in children born outside marriage.2We find that more stringent child support enforcement results in fewer births, especially among less educated single women, and, conditional on education, greater use of early prenatal care (a measure of the underlying propensity to invest in children), both of which sug-gest positive selection on maternal quality.3By focusing on the impact of increases in state expenditures on child support enforcement that were largely driven by federal leg-islation (as opposed to state laws), and by using a within state difference-in-difference framework that enables us to control for factors that vary at the state-year and that might be correlated with both child support enforcement and fertility, we limit the potential for policy endogeneity bias in the findings. And because our measure of maternal investment is prenatal care that is initiated prior to the receipt of any child support, any positive impact of child support enforcement on this measure of maternal investment is unlikely related to an increase in available financial resources.
The findings that stricter child support enforcement leads to a decline in the number of out-of-wedlock births and an average increase in both maternal education and child investment suggests positive selection on maternal quality as hypothesized. However, it does not rule out alternative mechanisms. Two alternative mechanisms that would give rise to similar empirical findings are (1) fathers who anticipate child support obli-gations in the future will (voluntarily) provide financial support to mothers during the prenatal period in order to increase mothers’ own prenatal investments in the child; and (2) mothers who anticipate child support payments in the future will experience an increase in their permanent income that enables them to increase their prenatal invest-ments by borrowing against future child support payinvest-ments. These two mechanisms may be classified as income effects as opposed to a composition or selection effect.
To determine whether either of these two mechanisms is operating, we use data from the Fragile Families and Child Wellbeing Study, a longitudinal survey of new
2. We chose 1984 as the starting year because it is the first year in which the CDC natality files include the universe of births, not a sample.
mothers that includes information on future child support, receipt of financial assis-tance during the prenatal period, prenatal investments (by mothers and fathers), and mothers’ ability to borrow. We find that mothers who receive child support at Year 1 are more likely to make greater prenatal investments. However, even when we condi-tion on prenatal financial transfers from the father, the positive impact of future child support on maternal investment in the prenatal period remains. That is, even among mothers who receive no prenatal transfers, those with future child support payments are still more likely to invest in the prenatal period. This finding is inconsistent with the first mechanism—that fathers who expect to pay child support in the future will invest more during the prenatal period which enables mothers to invest more in pre-natal care.
Nor do we find evidence to support the second mechanism—that mothers who receive child support in the future will invest more in prenatal care because they are able to borrow against future child support payments. We find no difference in the impact of future child support receipt on prenatal investment between mothers who are able to borrow and those who are not. The results from the Fragile Families data suggest that selection on fertility, rather than an income effect, is driving the finding that increases in the probability of future child support payments lead to an increase in the average probability of maternal prenatal investment in children.
Our analysis has implications for a broad range of research that examines the effect of policies on child outcomes. Insofar as policies affect fertility decisions as well as subsequent parental behavior and child outcomes, failing to take account of the for-mer may lead to incorrect estimates of the true effect of the policies.
The rest of the paper is laid out as follows: In Section II, we explore the incentive effects of stricter child support enforcement and their implications in terms of poten-tial selection on the birth mother and review the relevant literature. In Section III we discuss our identification strategy and present the results from the aggregate state-level analysis of births from vital statistics data. In Section IV we present results from the Fragile Families analyses, which explores the mechanism(s) behind the finding that more stringent child support enforcement leads to increased prenatal investment. Section V concludes by discussing the implications of our findings regarding estima-tion of the impact of child support on child wellbeing.
II. Incentive Effects of Stricter Child support
enforcement
A. Impact of stricter Child support enforcement on Fertility—Background Literature
The empirical evidence with respect to the impact of child support enforcement on fertility suggests that the incentive effects of stricter CSE for men outweigh those for women: states with stricter child support enforcement have witnessed a decline in out-of -wedlock births.4These studies rely on changes in state laws governing child sup-port enforcement (paternity establishment, immediate withholding, etc.) to identify the impact of stricter child support enforcement on fertility.5Examples of this litera-ture include Sonenstein, Pleck, and Ku (1994) who find that adolescent males are aware of paternity establishment policies and modify their sexual behavior and contraceptive use accordingly. Garfinkel and his colleagues (Garfinkel, Huang, McLanahan, and Gaylin 2003; Plotnick, Garfinkel, McLanahan, and Ku 2004) link higher paternity establishment rates to nonmarital childbearing and find that higher paternity establishment rates reduce nonmarital child. Though most of these studies employ state and year fixed effects, endogeneity of the child support enforcement policies still poses a problem if the timing of the policies within each state is driven by unobservable characteristics related to fertility and nonmarital childbearing that are changing over time. We address the potential policy endogeneity of stricter child support enforcement and describe our identification strategy in Section III.
Although there is considerable empirical evidence regarding the impact of stricter CSE on fertility, there is no research on how child support affects the composition or quality of parents. We provide the first such empirical estimates of the impact of stricter CSE on the composition of mothers and thus the potential quality of parent-ing and child outcomes.
B. Impact of Stricter Child support enforcement on Composition of Mothers
A simple model of the decision of an unmarried couple to have a child illustrates how the composition of mothers may change if child support enforcement increases. In such a model, fathers’ utility (Um) depends on their own consumption (cm) and the
quality or capital of their children (q). Q increases with financial resources devoted to the child—a fraction of both the mother’s income (Iw) and any child support payments
received (cs). Fathers choose their consumption level (cm) and how much child
sup-port to provide (cs). Likewise, mothers care about their own consumption (cw) and q
and choose how much of Iwand csto invest in the child. Some mothers invest a greater
portion of their income in their children than others. We can think of these mothers as having a greater preference for child quality, denoted α.
4. Another possibility is that stricter CSE is not negatively affecting fertility, but positively affecting mar-riage if the cost of being a single father increases relative to being married. Heim (2003) finds no impact of child support enforcement on divorce rates; Nixon (1997) finds a negative relationship between child sup-port enforcement and divorce as does Huang (2002). For our purposes, however, it doesn’t matter which mechanism is responsible. Though it is interesting to note that if stricter CSE were lowering out-of-wedlock births by encouraging marriage (as opposed to lowering fertility), we would expect those marrying to come from the upper tail of the distribution of “quality” single mothers—that is, mothers with higher education. As such, the underlying quality/education of single mothers would decline. That is not what we find, sug-gesting that stricter child support enforcement in not affecting the composition of single mothers by increas-ing the incentives for marriage.
Although a noncohabitating father is unable to ensure that all child support pay-ments to the mother are spent on the child and not on her own consumption (Willis 1999), he may observe a mother’s α. Because αdetermines how much of her income and child support she will invest in her child, men always will prefer to have children with women with a greater α.
When deciding whether to have a child, a man will compare the indirect utility gained from not having a child (income spent on his consumption only) and having a child with a woman with a given α(income spent on consumption and child support). A critical level of αexists above which his utility from having a child exceeds that of not having one. This critical level increases with the probability that he will be forced to pay child support and with the probability that the woman will rely on welfare (AFDC/TANF). The intuition behind the latter is that, with some exceptions (some states allow for a $50 pass through each month), most child support payments to mothers on welfare are taxed 100 percent by the state. As such, men receive little if any additional benefit (in the form of higher child quality) from their child support payments if the mother relies on welfare.6Thus when forced to pay child support, men will want to have children with women with a greater αand when women are likely to use welfare, men will require an even higher αto have a child with her.
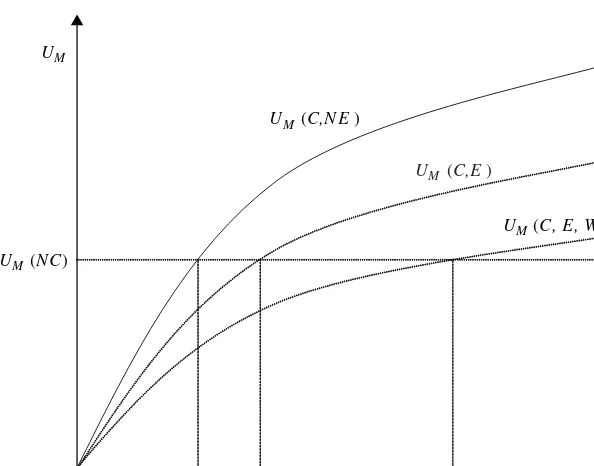
Figure 1 illustrates these points. In the figure, the horizontal line Um(NC)
rep-resents a father’s utility associated with not having a child (NC). Utility does not change with αbecause it is only a function of income (Im). The dark line Um(C, NE)
represents a father’s utility from having a child with no child support enforcement, and the line Um(C, E) represents his utility from having a child with child support
enforcement. α*NErepresents the minimum αrequired for the utility of having a child
to exceed that of not having one (Um(C, NE)> Um(NC)) under no enforcement. As
is evident from the graph, this critical value is lower than that under enforcement α*NE
< α*E. The intuition behind this is simply that the constraint introduced by child
support enforcement (if it is binding) lowers a father’s utility for any given α. The fourth line (Um(C,E,W)) represents the indirect utility associated with having a child
with a woman on welfare under a regime of strict child support enforcement. The critical value α*EW, above which men will choose to have children, is higher still.
III. Child support enforcement, Prenatal Investments
and Birth Outcomes: Evidence from Vital Statistics
Data
Our analysis of the impact of stricter child support enforcement on birth rates, prenatal investment and birth outcomes differs in important ways from previous research. Previous studies have examined the impact of state child support policies on the number of births among single mothers (Case 1998; Garfinkel, Huang,
McLanahan, and Gaylin 2003). We are the first to examine the impact of stricter child support enforcement on the composition/quality of mothers (as measured by their educational attainment) and the prenatal investments they make in their children as measured by their early initiation of prenatal care and number of prenatal visits.
Another important distinction lies in our empirical methods. A major challenge of estimating the impact of stricter child support enforcement on fertility and maternal investment is to identify the effect of child support enforcement separate from other potentially unobservable factors that might affect both the state’s child support poli-cies and fertility or investment in children. Previous studies of the impact of child sup-port enforcement policies on fertility attempt to control for unobserved influences using a variety of methods. Most compare changes in fertility over time between states that adopt stricter child support enforcement and those that do not (also referred to as a state fixed effect approach). This provides some control for policy endogene-ity by controlling for state-level factors that are fixed and do not vary over time, but not factors that might vary within state over time.7In this paper we adopt an alterna-tive approach that controls for time-varying unobservable factors within a state that
UM
UM (N C)
UM (C,N E)
UM (C,E)
UM (C, E, W)
α*(N E) α*(E) α*(E,W) α
Figure 1
Stricter Child support enforcement and the Composition of Mothers
might affect child support enforcement and fertility/investment. Examples of such factors might include changes in society values and norms or changes in the avail-ability and cost of contraception.
To do this we obtain within statedifference-in-differences estimates of the effect of stricter child support enforcement. This estimate is obtained by defining two groups: a treatment or experimental group and a control group. Because state child support enforcement expenditures target single women, we define single women as the treat-ment and married women as the control group. We therefore construct our estimates of the impact of stricter child support enforcement by comparing its impact on the fer-tility/investment decisions of single mothers relative to married mothers residing in the same state. The assumption of this identification strategy is that changes over time in the behavior of men and women that are unrelated to child support enforcement are common to single and married women. It also assumes that married women are unaf-fected by child support enforcement. While this assumption is restrictive, it is prefer-able to simply comparing fertility/investment decisions under strict child support enforcement regimes with those under more lenient regimes because it allows one to identify the effect of stricter child support enforcement separate from broader changes in social norms, the cost of investing in children or other factors as measured by the behavior of married women.
Because these single-married fertility/investment differentials can be computed within cells defined by state and year, our approach implicitly controls for all time-varying state specific factors by allowing us to include not only individual state and year fixed effects but state*yearfixed effects (as discussed further in the next section). The state*yearfixed effects subsume the individual state and year main effects so that they need not be included separately. In other words, the vector of state*yearfixed effects includes individual state and year fixed effects as well as an interaction between them.
A. Data and Estimation
Data on all births in the United States come from the 1985-99 Natality Detail Files collected by the CDC.8Summary statistics are provided in Appendix Tables A1 and A2. Rather than perform the analysis on a data set of all individual births, we aggre-gated the data to the group level with groups defined by year, state, age group, race, education, and marital status.9 We matched these data with data on child support enforcement by the year in which the child was conceived (calculated using gesta-tional age and date of birth). Our measure of child support enforcement is expendi-tures on child support that come from the annual reports of the Office of Child support enforcement, U.S. Department of Health and Human Services. This represents a departure from other work that has focused on either specific policies/laws with respect to child support enforcement and/or child support expenditures. We focus on
expenditures for the following reasons: (1) Previous work has found the data on child support policies to be “incomplete and in some places inconsistent” (Freeman and Waldfogel 1998); and (2) multiple policies and laws require selection of an arguably arbitrary subset. However, we do repeat the analysis with a single policy—whether child support is withheld from father’s wages; we discuss those results in the follow-ing section.
The equation estimated takes the form:
(1) Ysymrae= β1singlem+ β2ln(CSE)*singlemsy-1+ β3Racer+ β4Educatione
+ β5Agea+ β6state*yearsy-1+ εsymrae
In the above equation CSErefers to the average annual expenditures in the state in the three years prior to the year of conception. We do this because we believe that the effects of increased child support enforcement are not immediate but are lagged, and also to further limit the potential for policy-endogeneity bias. Single is an indicator equal to one if the birth mother is single (representing the treatment group). Thus the coefficient on the term lnCSE*single(β2) represents the within-state difference-in-dif-ferences estimate: the impact of the child support enforcement on single women rel-ative to married women in states that experience large increases in CSErelative to those in states with small changes in CSE. The vector Race includes the dummy vari-ables for the race of the mother (black, white, Hispanic, Asian, and other is the omit-ted group), the vector Age includes dummies for the age of the mother (teen, age 20–29, age 30–39, and age 40–55 is the omitted group) and Education includes the educational status of the mother (less than HS, HS, HS+). For this analysis, we dropped college-educated mothers as single college educated mothers are quite rare and unrepresentative. Recall that because the data are aggregated to the cell level based on state, year, race, marital status, age, and education, only binary indicators for these measures, not continuous variables, can be included.
As noted previously, the inclusion of state*year fixed effects subsumes individual state and year fixed effects, so they are not included separately in the analysis (in other words, they are included in the state*year fixed effects).10Including state*year fixed effects also controls for all factors that may vary within states over time, such as unem-ployment rates and AFDC benefits that may be correlated with both the state’s child support policies and birth outcomes as well as any other factors that vary within state over time that affect the whole population.11In addition, the vector of state*year fixed effects subsumes the main CSEterm (since it varies by state and year) but not the term ln(CSE)*single—enabling identification of the impact of CSEon birth outcomes.
The outcomes (Y) are the (1) log of the number of births, (2) the proportion of mothers in the cell who initiated prenatal care in the first trimester, (3) the average number of prenatal visits, and (4) the proportion of low birth weight (LBW) births.
10.State*year fixed effectsinclude individual state and year fixed effects. This is can be shown with the fol-lowing short example. Consider two years and two states. If state*year fixed effects are included, there would be three dummies included: state1*year1, state1*year2 and state2*year1(state2*year2is the omitted or ref-erence category) which is the equivalent of two main effects and an interaction (we are grateful to the editor for suggesting this illustrative example).
For the first of these, we also include the log of the number of women in the cell (the denominator) as a covariate and weight by the size of the denominator.12For the sec-ond, third, and fourth we weight by the number of births in the cell.
B. Results
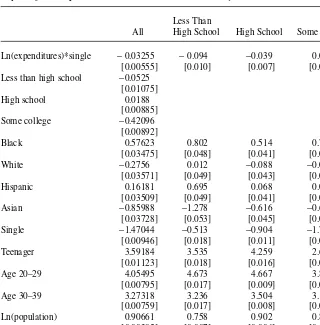
Estimates of the impact of CSEon the number of births are presented in Table 1. The first column displays estimates of the impact of stricter CSEon the number of births. Consistent with previous work, we find that stricter child support enforcement leads to a significant decline in births to single women relative to married women. The esti-mated coefficient β2(−0.033) can be interpreted as the elasticity of the birth rate with respect to changes in child support expenditures. That is, a 1 percent increase in expenditures leads to a decline in single (nonmarital) fertility relative to marital fer-tility of 0.03 percent. In the next three columns of Table 1, we examine whether stricter CSEdifferentially affects the fertility of some single women more than others, thereby potentially altering the average underlying characteristics of single mothers and their children. We previously predicted that the fertility of those single mothers most likely to use the AFDC program would decline relative to others. Though we do not have an exact measure of a woman’s propensity to use welfare, we do have meas-ures of maternal education, which is highly negatively correlated with welfare use. In Columns 2–4 we present the results stratified by maternal education. Consistent with our prediction, stricter CSEappears to have the greatest negative impact on the fertil-ity of the women who have the least education and therefore are most likely to use welfare. The estimated elasticity is −0.094 for women without a high school degree and −0.039 for women with a high school degree. In contrast, for women with some college, the elasticity is slightly positive (0.023).
In Table 2 we present estimates of the impact of stricter CSE on two measures of prenatal investments of mothers—early initiation of prenatal care and the number of prenatal visits. Column 1 presents estimates of the impact of increasing child support expenditures on the proportion of single mothers in the state that initiate care in the first trimester, controlling for age, education and race. We find that sin-gle women in states with stricter child support enforcement are more likely to initi-ate care in the first trimester. Over the period 1984–98, the share of single women initiating care in the first trimester increased from 0.548 to 0.708 (see Appendix Table 2). Given that CSEincreased on average 300 percent over this period, the esti-mated coefficient of 0.018 suggests that half of this increase can be attributed to the increase in child support enforcement.13Similarly in Column 2 we present results which suggest that the increase in child support enforcement also led to a positive and significant increase in the number of prenatal visits among single women and was responsible for 6 percent of the observed increase in prenatal visits over this period. Finally, in Column 3, we present results for LBW. The proportion of single
12. The denominator (the number of women of a given race, education level, age and marital status in a given state) was calculated from the 1990 Census.
women with LBW babies declined from 0.112 to 0.099 over this period. The results suggest that the increase in child support enforcement over this period explains 13 percent of this decline.
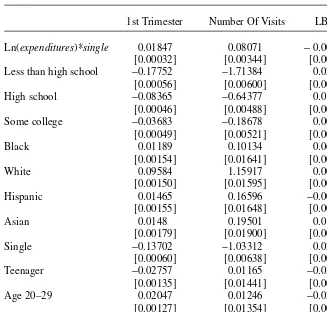
In Table 3, we present estimates of the impact of stricter child support enforce-ment on fertility, prenatal investenforce-ment, and birth outcomes stratified by race. For non-black mothers (Columns 1–4), increasing expenditures on child support leads to a reduction in the number of births, an increase in the proportion of women initiating early prenatal care and the number of visits, and a decline in the proportion of LBW births. For black mothers, however, while the number of births decline and the pro-portion initiating prenatal care early increases as does the number of prenatal visits,
Table 1
Impact of Ln(Expenditures)on Ln(Births), U.S. Natality Data 1985–98
Less Than
All High School High School Some College
Ln(expenditures)*single −0.03255 −0.094 −0.039 0.023
[0.00555] [0.010] [0.007] [0.007]
Less than high school −0.0525
[0.01075]
High school 0.0188
[0.00885]
Some college −0.42096
[0.00892]
Black 0.57623 0.802 0.514 0.71
[0.03475] [0.048] [0.041] [0.047]
White −0.2756 0.012 −0.088 −0.098
[0.03571] [0.049] [0.043] [0.052]
Hispanic 0.16181 0.695 0.068 0.085
[0.03509] [0.049] [0.041] [0.048]
Asian −0.85988 −1.278 −0.616 −0.602
[0.03728] [0.053] [0.045] [0.050]
Single −1.47044 −0.513 −0.904 −1.739
[0.00946] [0.018] [0.011] [0.012]
Teenager 3.59184 3.535 4.259 2.689
[0.01123] [0.018] [0.016] [0.019]
Age 20–29 4.05495 4.673 4.667 3.83
[0.00795] [0.017] [0.009] [0.010]
Age 30–39 3.27318 3.236 3.504 3.139
[0.00759] [0.017] [0.008] [0.010]
Ln(population) 0.90661 0.758 0.902 0.896
[0.00385] [0.007] [0.006] [0.007]
Observations 62,026 16,680 17,393 16,041
R-squared 0.91 0.93 0.97 0.96
birth outcomes do not appear to improve. For black mothers, we find no significant effect of child support enforcement on LBW.
To provide additional evidence in support of this finding, we also estimate a dis-crete time duration model of the impact of CSE on time until first birth, using data on individual women from the NLSY79. The NLSY79 consists of a nationally represen-tative sample of 12,686 young men and women age 14–22 in 1979 interviewed annu-ally from 1979 to 1994 and then bienniannu-ally until 2000. The NLSY includes 6,283 women of whom 5,762 are included in this analysis (521 are excluded because they already had at least one child by 1979). Individual data allow us to include additional
Table 2
Impact of Ln(expenditures)on Prenatal Investments and Birth Outcomes, U.S. Natality Data 1985–98
1st Trimester Number Of Visits LBW
Ln(expenditures)*single 0.01847 0.08071 −0.00154
[0.00032] [0.00344] [0.00012]
Less than high school −0.17752 −1.71384 0.02879
[0.00056] [0.00600] [0.00021]
High school −0.08365 −0.64377 0.01509
[0.00046] [0.00488] [0.00017]
Some college −0.03683 −0.18678 0.00647
[0.00049] [0.00521] [0.00018]
Black 0.01189 0.10134 0.06202
[0.00154] [0.01641] [0.00058]
White 0.09584 1.15917 0.0066
[0.00150] [0.01595] [0.00056]
Hispanic 0.01465 0.16596 −0.00111
[0.00155] [0.01648] [0.00058]
Asian 0.0148 0.19501 0.01646
[0.00179] [0.01900] [0.00067]
Single −0.13702 −1.03312 0.02737
[0.00060] [0.00638] [0.00022]
Teenager −0.02757 0.01165 −0.03487
[0.00135] [0.01441] [0.00051]
Age 20–29 0.02047 0.01246 −0.03367
[0.00127] [0.01354] [0.00047]
Age 30–39 0.04158 0.05192 −0.02104
[0.00128] [0.01362] [0.00048]
Observations 80,180 80,038 80,233
R-squared 0.91 0.89 0.79
The Journal of Human Resources Table 3
Impact of Ln(expenditures)on Ln(births), Prenatal Investments and Birth Outcomes, US Natality Data 1985–1998
NonBlack Black
Ln(births) 1st trimester visits LBW Ln(births) 1st trimester visits LBW Ln(expenditures)*single −0.01511 0.0183 0.0544 −0.00232 −0.04744 0.01987 0.12508 0.00031
[0.00534] [0.00037] [0.00364] [0.00012] [0.00816] [0.00058] [0.00738] [0.00039] Less than high school −0.16123 −0.18048 −1.62238 0.02486 −0.01642 −0.18414 −2.44953 0.04905
[0.01049] [0.00061] [0.00605] [0.00020] [0.01455] [0.00107] [0.01359] [0.00072] High school −0.05608 −0.07875 −0.56244 0.01335 0.2103 −0.12331 −1.38734 0.02719
[0.00848] [0.00049] [0.00480] [0.00016] [0.01364] [0.00097] [0.01237] [0.00065] Some college −0.43342 −0.03466 −0.19049 0.00578 −0.2356 −0.06526 −0.52301 0.01352
[0.00854] [0.00052] [0.00514] [0.00017] [0.01355] [0.00102] [0.01297] [0.00069]
White 0.04034 0.0953 1.20375 0.00597
[0.03324] [0.00151] [0.01489] [0.00048]
Hispanic 0.48434 0.01717 0.17993 −0.00047
[0.03226] [0.00157] [0.01543] [0.00050]
Asian −0.61718 0.01589 0.26076 0.01615
[0.03402] [0.00180] [0.01774] [0.00058]
Single −1.56094 −0.13847 −0.91369 0.0258 −0.52595 −0.12778 −1.315 0.03519 [0.00986] [0.00069] [0.00681] [0.00022] [0.01356] [0.00093] [0.01188] [0.00063] Teenager 3.52408 −0.0273 −0.05894 −0.02645 3.8224 −0.03509 0.28164 −0.07185
[0.01128] [0.00147] [0.01448] [0.00047] [0.01197] [0.00244] [0.03109] [0.00164] Age 20-29 3.90212 0.02001 0.00035 −0.03044 4.15971 0.01969 0.08084 −0.05642
[0.00776] [0.00136] [0.01343] [0.00044] [0.00959] [0.00238] [0.03033] [0.00160] Age 30-39 3.19704 0.04094 0.04937 −0.02096 3.06756 0.04283 0.08648 −0.02192
[0.00738] [0.00137] [0.01349] [0.00044] [0.00939] [0.00241] [0.03069] [0.00162]
Observations 63473 63423 63301 63473 16760 16757 16737 16760
R-squared 0.91 0.9 0.89 0.58 0.96 0.94 0.93 0.62
controls that might affect fertility such as AFQT score (the score on the Armed Forces Qualifying Exam, a measure of cognitive ability), whether her mother worked when she was 14 years old, and the highest grade completed by her mother.
Though sample sizes prevent us from obtaining precise estimates, the hazard mod-els do suggest that the probability that single women will have a child in a given year, conditional on not having had a child to date, is lower in states that spend more on child support enforcement. Increasing expenditures on child support enforcement two standard deviations around the mean decreases the probability of birth for a single woman from 4.5 to 1.7 percent.14We also find that though the likelihood of having a child decreases for single women when child support enforcement increases, it does so at a slower rate for those with more education. This is consistent with our findings based on aggregate birth certificate data: stricter child support enforcement has the greatest negative impact on the fertility of women most likely to use AFDC—those with the least education.
Our choice of expenditures as the measure of child support enforcement is subject to the criticism that it might be confounded with efficiency or with the difficulty of the caseload of delinquent fathers. If, for example, expenditures were confounded with efficiency—that is, greater expenditures in states with less efficient child support collection systems—then the results would be biased downward. Similarly, if expen-ditures were confounded with caseload difficulty (that is, states that increase their expenditures are those that already collect from those least reluctant to contribute and are attempting to collect child support from more reluctant fathers), this might also bias our estimates downward. On the other hand, if states with more efficient or less difficult caseloads spend more because the marginal benefit of expenditures is greater, then our results would be biased upward.
As a check, we estimate the impact of an alternative measure of child support enforcement—an indicator for enactment of a law that automatically withholds child support payments from the wages of absent fathers. While the withhold represents an alternative measure, it is still positively correlated with child support expenditures (as are other child support laws). We find that, for example, adoption of the automatic withhold would explain 36 percent of the increase in first trimester prenatal care (less than the 50 percent explained by the increase in child support enforcement expendi-tures). While the results are qualitatively similar, they suggest a possible small upward bias to the results based on child support expenditures.
IV. Child support and Prenatal Investments: Evidence
from the Fragile Families Study
In this section we investigate potential mechanisms behind our find-ing that increased child support enforcement leads to an increase in prenatal invest-ment. In particular, we wish to know whether this increase is due to positive selection as we hypothesize or some alternative mechanism. Two possible alternative mecha-nisms include: (1) increases in paternal income transfers during the prenatal period (in
anticipation of future support obligations); and (2) increases in mother’s ability to bor-row against future child support payments during the prenatal period (as a result of a positive permanent income effect). We use data from the Fragile Families Study to determine to what extent the increase may be attributed to either of these two alter-native mechanisms. Lack of evidence for either of these mechanisms would provide yet further support for our hypothesis of positive selection.
A. The Fragile Families Data
The Fragile Families and Child Well Being Study interviews approximately 3,700 new unwed couples residing in 20 cities in 15 states shortly after the birth of their child. Parents are interviewed again when the child is between 12 and 18 months old. About 1,900 of these parents were not cohabiting at the time of the follow-up inter-view and therefore were eligible for child support and inclusion in our sample. A unique aspect of the Fragile Families data is the extensive information (taken from both maternal and paternal surveys) on noncohabiting fathers.
These data include information on whether a formal or informal child support agreement exists at 12–18 months (34 percent). These data also include information on child investments during the prenatal period: the date when the mother initiated prenatal care and whether the father provided financial assistance to her during this period. Lastly, the data contain information on whether the mothers can borrow money (at least $200) if they need to—a measure of their credit constraint.
B. Results from Fragile Families
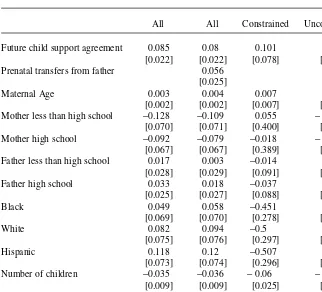
In the first two columns of Table 4 we present evidence regarding the impact of future child support receipt and prenatal transfers on prenatal investments. In the first column we explore the relationship between future child support receipt and early initiation of prenatal care. We find that those mothers who receive future child support are more likely to initiate prenatal care early (0.085), as expected. Even when we control for whether prenatal transfers were received from the father in Column 2, the positive effect of future child support receipt remains (0.080), suggesting that the receipt of prenatal transfers cannot explain the positive impact of future child support receipt on prenatal investments. In results not presented, we find that the same pattern emerges for LBW: Future child support receipt leads to a decline in LBW and the effect remains even when we control for prenatal trans-fers, but the effects are imprecisely estimated, most likely due to small sample sizes.
con-strained. The empirical evidence from the Fragile Families does not support this, but rather rules out the idea that the empirical findings based on the birth certificate data were simply due to increased resources, not positive selection.
V. Discussion
This paper is the first to examine how the composition of mothers changes in response to an increase in the probability of future child support payments brought about by stricter state child support enforcement. We find that the average education of mothers increases, as does the level of maternal investments in children
Table 4
Relationship Between Future Child Support Agreement, Prenatal Transfers and Maternal Investment
All All Constrained Unconstrained
Future child support agreement 0.085 0.08 0.101 0.088
[0.022] [0.022] [0.078] [0.023]
Prenatal transfers from father 0.056
[0.025]
Maternal Age 0.003 0.004 0.007 0.003
[0.002] [0.002] [0.007] [0.003]
Mother less than high school −0.128 −0.109 0.055 −0.128
[0.070] [0.071] [0.400] [0.072]
Mother high school −0.092 −0.079 −0.018 −0.078
[0.067] [0.067] [0.389] [0.068]
Father less than high school 0.017 0.003 −0.014 0.02
[0.028] [0.029] [0.091] [0.030]
Father high school 0.033 0.018 −0.037 0.039
[0.025] [0.027] [0.088] [0.027]
Black 0.049 0.058 −0.451 0.092
[0.069] [0.070] [0.278] [0.072]
White 0.082 0.094 −0.5 0.132
[0.075] [0.076] [0.297] [0.078]
Hispanic 0.118 0.12 −0.507 0.175
[0.073] [0.074] [0.296] [0.076]
Number of children −0.035 −0.036 −0.06 −0.032
[0.009] [0.009] [0.025] [0.010]
Poverty level 0.001 0.003 −0.007 0.001
[0.009] [0.009] [0.047] [0.009]
Observations 1,698 1,657 203 1,489
R-squared 0.04 0.05 0.1 0.05
(as measured by early investment in prenatal care), with stronger child support enforcement. What is notable about these results is that the increase in maternal investment occurs prior to the receipt of any child support payments, suggesting that stricter child support enforcement, in addition to increasing the material resources available to children, may benefit children through a birth selection process. That is, stricter child support enforcement reduces fertility, especially among mothers who are less likely to invest in their children, regardless of actual child support receipt. As a result, we might expect current policies of child support enforcement to affect both current and future child outcomes. Existing research on the impact of child support receipt on child outcomes has not considered this mechanism. To fully understand the impact of any changes in state policies affecting child support enforcement on child outcomes, it is necessary to understand how policies might affect both the birth selec-tion process as well as the receipt of financial resources, condiselec-tional on the birth of the child.
Appendix Table A1
Summary Statistics From Birth Certificate Data 1985–98
All Single Married
Single 0.381
Prenatal care initiated in 1st trimester 0.755 0.634 0.82
Number of prenatal visits 10.9 9.9 11.5
Share LBW 0.077 0.106 0.062
Less than high school 0.278 0.439 0.191
High school 0.458 0.413 0.482
Some college 0.253 0.136 0.312
White 0.614 0.4 0.73
Black 0.184 0.375 0.081
Hispanic 0.163 0.192 0.147
Appendix Table A2
Trends in CSE, Prenatal Investment and Birth Outcomes for Single Women
1985 1998 1998–85 Percent Change
Prenatal care initiated in 1st trimester 0.548 0.708 0.16 29.2%
Number of prenatal visits 9.1 10.67 1.57 17.3%
Share LBW 0.112 0.099 −0.013 −11.6%
References
Argys, Laura, Elizabeth Peters, Jeanne Brooks-Gunn, and Judith Smith. 1998. “The Impact of
Child Support on Cognitive Outcomes of Young Children.” Demography. 35(2):159–73.
Argys, Laura, Elizabeth Peters, and Donald Waldman.1995. “Can the Family Support Act Put Some Life Back Into Deadbeat Dads? An Analysis of Child Support Guidelines, Award
Rates, and Levels.” The Journal of Human Resources36(2):226–52.
Auginbaugh, Alison. 2001. “Signals of Child Achievement as Determinants of Child
Support.” American Economic Review Papers and Proceedings91(2):140–44.
Beller, Andrea, and John Graham. 1991. “The Effect of Child Support Enforcement on Child
Support Payments.” Population Research and Policy Review10:91–116.
Case, Anne. 1998. “The Effects of Stronger Child Support Enforcement on Non-Marital
Fertility.” In Fathers under Fire: The Revolution in Child Support Enforcement, ed. Irwin
Garfinkel, Sara McLanahan, Daniel Meyer, and Judith Seltzer, 191–25. New York: Russell Sage Foundation.
Case, Anne, I-Fen Lin, and Sara McLanahan. 2003. “Explaining Trends in Child Support:
Economic, Demographic, and Policy Effects.” Demography40(1):171–89.
Del Boca, Daniela, and Christopher Flinn. 1994. “Expenditure Decisions of Divorced Mothers
and Income Composition.” Journal of Human Resources29(3):742–61.
Freeman, Richard, and Jane Waldfogel. 1998. “Dunning Delinquent Dads: The Effect of Child Support Enforcement Policy on Child Support Receipt by Never Married Women.” NBER working paper 6664.
Garfinkel, Irwin, Daniel Gaylin, Chung Huang, and Sara McLanahan. 2003. “Will Child Support
Enforcement Reduce Nonmarital Childbearing.” Journal of Population Economics. 16:55–70.
Hernandez, Pedro, Andrea Beller, and John Graham. 1995. “Changes in the Relationship Between Child Support Payment and Educational Attainment of Offspring, 1979–1988.”
Demography32(2):249–59.
Heim, Bradley. 2003. “Does Child Support Enforcement Reduce Divorce Rates? A
Reexamination.” Journal of Human Resources38(4):773–91.
Huang, Chien-Chung. 2002. “The Impact of Child Support Enforcement on Nonmarital and
Marital Births: Does It Differ by Racial and Age Groups?” Social Service Review76(2):
275–301.
Knox, Virgina, and Mary Jo Bane. 1991. “Child Support and Schooling.” In Child Support
and Child Well-Being, eds. Irwin Grafinkel, Sara McLanahan, and Philip Robins, 285–316. Washington D.C.: The Urban Institute Press.
Knox, Virginia. 1996. “The Effects of Child Support Payments on Developmental Outcomes
for Elementary School-Age Children.” The Journal of Human Resources31(4):816–40.
Lerman, Robert. 1993. “Policy Watch: Child Support Policies.” Journal of Economic
Perspectives. 7(3):171–82.
Miller, Cynthia, Irwin Garfinkel, and Sara McLanahan. 1997. “Child Support in the U.S.: Can
Fathers Afford to Pay More?” Review of Income and Wealth43(3):261–81.
Nixon, Lucia. 1997. “The Effect of Child support enforcement on Marital Dissolution.”
Journal of Human Resources32(1):159–81.
Plotnick, Robert, Irwin Garfinkel, Sara McLanahan, and Inhoe Ku. 2004. “Better Child
Support Enforcement: Can it Reduce Teenage Childbearing?” Journal of Family Issues
25(5):634–57.
Sonenstein, Freya, Joseph Pleck, and Leighton Ku. 1994. “Child Support Obligations and Young Men’s Contraceptive Behavior: What do Young Men Know? Does it Matter?” Paper Presented at the Annual Meeting of the Population Association of American, Miami May 7, 1994.
Willis, Robert. 1999. “A Theory of Out-of-Wedlock Childbearing.” Journal of Political
![Table 3The Journal of Human ResourcesSome collegeHigh schoolLess than high schoolImpact of Ln(expenditures) on Ln(births), Prenatal Investments and Birth Outcomes, US Natality Data 1985–1998NonBlackBlackLn(births)1st trimestervisitsLBWLn(births)1st trimestervisitsLBWLn(expenditures)*single− 0.015110.01830.0544− 0.00232− 0.047440.019870.125080.00031[0.00534][0.00037][0.00364][0.00012][0.00816][0.00058][0.00738][0.00039]−0.16123−0.18048− 1.622380.02486− 0.01642−0.18414− 2.449530.04905[0.01049][0.00061][0.00605][0.00020][0.01455][0.00107][0.01359][0.00072]−0.05608−0.07875− 0.562440.013350.2103−0.12331− 1.387340.02719[0.00848][0.00049][0.00480][0.00016][0.01364][0.00097][0.01237][0.00065]−0.43342−0.03466− 0.190490.00578−0.2356−0.06526− 0.523010.01352](https://thumb-ap.123doks.com/thumbv2/123dok/1211812.778682/13.504.13.560.64.352/resourcessome-schoolimpact-expenditures-investments-nonblackblackln-trimestervisitslbwln-trimestervisitslbwln-expenditures.webp)