1
ACADEMIC ADVISOR RECOMMENDATION LETTER
This Internship report is prepared and submitted by Muhammad Arif in partial fulfillment of the requirements for the degree of Bachelor Degree in the Faculty of Engineering has been reviewed and found to have satisfied the requirements for a report fit to be examined.
Cikarang, Indonesia, July 9th, 2015
Herwan Yusmira, B.Sc. MET, MTech
2
COMPANY’S SUPERVISOR RECOMMENDATION LETTER
Muhammad Arif has performed and completed an internship in PT. Mitsubishi Electric Automotive Indonesia in partial fulfillment of the requirements for the degree of Bachelor Degree in the Faculty of Engineering. I therefore recommend this report to be examined.
Cikarang, Indonesia, July 9th, 2015
Suryani
3
INTERNSHIP REPORT AT PT. MITSUBISHI ELECTRIC AUTOMOTIVE INDONESIA, BEKASI, INDONESIA
By
Muhammad Arif ID No. 004201100023
Approved by,
HerwanYusmira, B.Sc. MET, MTech Ir.Andira, M.T.
Internship Advisor Internship Coordinator
HerwanYusmira, B.Sc. MET, MTech Program Head of Industrial Engineering
4
ABSTRACT
This project is done to minimize the NG existence at PT. MEAINA especially the bracket flowing to machining process. The elimination of NG existence is done through Plan, Do, Check, Act (PDCA) method. NG existence has become one of the main problems. Generally, NG can be categorized into two categories, NG caused by supplier and NG caused by machining process. 36.8% of total NG is caused by machining process and 63.2% of total NG caused by suppliers. Then, the most defective line found is Starter Bracket Front line. The most type of NG caused by supplier is small diameter lever which contribute 3,711 pieces and shown as the highest. Based on the analysis, the small diameter lever is mainly caused by the wrong inspection method and no supporting tools. Thus, diameter lever area is added to the inspection check sheet and the new jig is used to check the diameter lever area.
This treatment result in 0% defect of diameter lever area and save cost up to IDR 218,970,000.
Key words: NG, PDCA method, SBF, jig, diameter lever, supplier, cost saving
5
ACKNOWLEDGEMENT
This report would never be done without a big support. Therefore, I would like to send my thanks to:
1. Allah SWT, the Al-Mighty one. My words would never be enough to say thanks to You.
2. My beloved parents, Mom and Dad who have given everything they have to me. I would never be here without your loves.
3. Mr. Herwan Yusmira as my Internship advisor thanks for the guidance.
4. Quality Assurance member of PT. Mitsubishi Electric Automotive Indonesia, thanks for the guidance and support and thanks for accepting me to be QA family during my internship period.
5. Engineering students batch 2012, thanks for surrounding my life with your cheers and laugh.
6. Generation of Eight (Genoit) of Fajar Harapan Senior High School, I would never be typing this report without you guys in my life back then and now.
6
TABLE OF CONTENTS
CHAPTER I INTRODUCTION
1.1 Problem Background ... 12
1.2 Problem Statement ... 14
1.3 Objectives ... 14
1.4 Scope ... 14
1.5 Research Outline ... 14
CHAPTER II LITERATURE STUDY 2.1 Flow Chart ... 17
2.2 Pareto Chart ... 17
2.3 Fish Bone Diagram ... 18
2.4 What is PDCA ... 19
2.4.1 Phase of the PDCA Model ... 20
CHAPTER III RESEARCH METHODOLOGY 3.1 Initial Observation ... 26
3.2 Problem Identification ... 26
3.3 Literature Study ... 27
3.4 Data Collection and Analysis ... 27
3.5 Conclusion and Recommendation... 28
3.6 Detail Framework... 28
CHAPTER IV COMPANY PROFILE 4.1 Description of Mitsubishi Electric ... 30
4.2 Rules and Programs of the Company ... 31
4.3 Subsidiaries of Mitsubishi Electric in Asia-Pacific ... 31
7
4.4 Structure of PT. Mitsubishi Electric Automotive Indonesia ... 33
4.5 Product of PT. MEAINA ... 34
4.5.1 Assembly Product ... 34
4.5.2 Part Manufacture Product ... 35
4.6 MEAINA Customers ... 36
4.7 Certification of MEAINA ... 37
CHAPTER V DATA COLLECTION AND ANALYSIS 5.1 Plan ... 39
5.1.1Flow Process of Daily Production at MEAINA ... 39
5.1.2 Monitoring Process ... 42
5.1.3 Finding the Most Defective Line ... 43
5.1.4 Finding the Highest Type of NG Existence ... 45
5.1.5 Problem Factor Analysis ... 47
5.2 Do ... 55
5.2.1 Improvement Action ... 55
5.3 Check ... 62
5.3.1 Evaluation ... 62
5.4 Act ... 65
5.4.1 Standardization ... 66
5.5 Benefits ... 67
5.5.1 Cost Saving ... 68
CHAPTER VI CONCLUSION AND RECOMMENDATION 6.1 Conclusion ... 69
6.2 Recommendation... 70
REFERENCES... ....71
8
LIST OF TABLE
Table 5.1 Data Claim 30
Table 5.2 NG Existence for the Last Semester of 2014 ... 31
Table 5.3 Number of NG Based On NG Type ... 33
Table 5.4 Quantity of NG Caused by Determined Factor ... 40
Table 5.5 5W + 1h Analysis ... 42
Table 5.6 NG Quantity before Improvement ... 50
Table 5.7 NG Quantity after Improvement ... 50
Figure 5.15 NG Quantity after Improvement ... 52
9
LIST OF FIGURE
Figure 1.1 Data claim report at the end of 2014 ... 4
Figure 2.1 Basic Flowchart ... 7
Figure 2.2 Structure of Pareto Chart 8 Figue 2.3 Structure of Fish Bone Diagram ... 9
Figure 2.4 PDCA Cycle ... 10
Figure 4.1 PT. Mitsubishi Electric Automotive Indonesia ... 19
Figure 4.2 Separation of Mitsubishi Electric in Asia-Pacific ... 21
Figure 4.3 Organization Structure ... 22
Figure 4.4 Assembly Product of PT. MEAINA ... 23
Figure 4.5 Part Manufacture Product of MEAINA ... 24
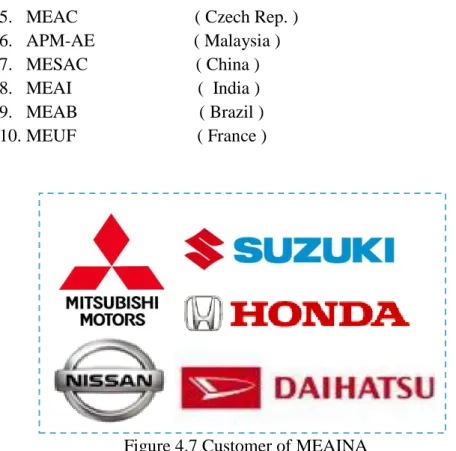
Figure 4.7 Customer of MEAINA ... 25
Figure 4.8 Certification Obtained by MEAINA ... 26
Figure 5.1 Flow Process of Daily Production ... 27
Figure 5.2 Data Claim Report at the End Of 2014 ... 30
Figure 5.3 Data Defect from Supplier for Each Line Model ... 30
Figure 5.4 Data Phenomena Defect From Supplier at Line SBF ... 33
Figure 5.5 Fish Bone Diagram ... 35
Figure 5.6 Main Problem Chart ... 41
Figure 5.7 Visual Checking... 43
Figure 5.8 Position Checking ... 43
Figure 5.9 Check sheet before ... 43
Figure 5.10 Inspection Process after Improvement ... 44
Figure 5.11 Picture of the Gauge Used ... 45
10
Figure 5.12 Picture of Coordinate Measuring Machine (CMM) ... 46
Figure 5.11 Picture of New Check Sheet used by Inspector ... 47
Figure 5.12 New Inspection Process after Improvement ... 48
Figure 5.13 New Inspection Process by using Coordinate Measuring Machine .. 49
Figure 5.14 Pareto Chat of NG Quantity before Improvement ... 51
Figure 5.15 NG Quantity after Improvement ... 51
Figure 5.16 Comparison of NG Quantity before and after Improvement ... 53
Figure 5.17 Check Sheet Content after Improvement ... 54
Figure 6.1 NG Phenomena at SBF Line ... 57
11
LIST OF TERMINOLOGIES
PDCA :Iterative four-step method to control and continues improvement of processes and product.
NG :Defect product
SBF :Starter Bracket Front Line which usually produces Bracket for Starter
Bracket :The product produced by PT. MEAINA
Incoming inspector :Member of Quality Assurance team and part of incoming section who usually works on inspecting the quality of blank bracket sent by suppliers.
CMM :Coordinate Measuring Machine used to measure the dimension of product of measurement tools.
Blank :Bracket that has not yet been machined.
Diameter lever :The diameter of inner circle in the middle of bracket.
Burry :Remaining casted iron stick to the blank bracket which is not supposed to be there.
Swelling :Part of blank bracket is felled off and specification changed.
Black spot :A black dot or stain at the blank bracket.
Deform :Change of bracket form.
MEAINA :Mitsubishi Electric Automotive Indonesia
12
CHAPTER I INTRODUCTION
1.1 Problem Background
In running a mass production, there must be a lot of problem faced by the company.
This kind of problem may vary between one company to the other companies. It is usually based on in what field the company work on. The problem faced by the company can defect product, unbalanced line, inventory overload, safety problem, etc.
There is one thing that cannot be avoided by companies producing products in mass production. The main problem is defect product. One of the ways to avoid defect product is by assuring quality of product. Because of that, Quality assurance has been one of main concern of companies. Producing NG (Not Good) product is not an option for the companies. Thus, it is a general fact that every single company in this world has been trying hard to concern on quality matter by minimizing NG product produced by the company.
Minimizing NG product is one of the main goals of PT. Mitsubishi Electric Automotive Indonesia. There are various existing types of NG at PT. Mitsubishi Electric Indonesia. In general, there are two types of NG; NG caused by supplier and NG caused by machining process of PT. Mitsubishi Electric Automotive Indonesia.
Product is judged NG by machining when the blank brackets have been processed to production process. Product is judged NG by supplier when the incoming quality inspector of PT. Mitsubishi Electric Automotive Indonesia found it, and PT.
Mitsubishi Electric has right to return it to the supplier for repair. But, when the NG found after machining process, it is responsibility of PT. Mitsubishi Electric Automotive Indonesia for repair, of course the cost of repair will be from company’s
13 budget and in fact, the NG caused by supplier is always bigger than NG caused by machining process.
To minimize NG product caused by PT. Mitsubishi Electric Automotive Indonesia process, incoming quality inspection must be maximized. There are many types of NG caused by supplier which usually found by quality incoming inspector, the NG are Noise, base abnormal, overcut, bending, black spot, blow hole, folded, bumping, burry, chipping, scratch, dented, etc.
Since there have been various types of NG caused by supplier, continuous study to eliminate those NG’s product must be done as the time goes by. 63% of the total NG is caused by suppliers,. it is very important to start the elimination of NG product from the NG type that mostly happened recently since the highest NG can lead to the biggest loss of money.
It is best to start eliminating the NG from the types of NG that have been contributing the biggest loss of the company, then is continued by eliminating the next biggest NG as the application of continuous improvement until we can reach the very minimum level of NG because it is almost impossible to experience zero defect in one period of production process. Through this study, it is expected that the continuous elimination of NG can be realized started from the NG causing biggest loss until the NG causing lowest loss systematically. It is considered that the best way to follow those systems is by applying Plan, Do, Check, and Act usually known as PDCA approach.
Nov-2014 Dec-2014 Oct-2014
Figure 1.1 Data claim report at the end of 2014
14 1.2 Problem Statement
The background of the problem leads to several problem statement as follow 1. What kind of NG bracket that mostly existed at incoming area?
2. What production lines that commonly experienced that NG type?
3. How to minimize the NG that is mostly existed?
4. How much cost is saved by minimizing NG that is mostly happened?
1.3 Objectives
There are several objectives of this research, including:
1. To identify the NG that outflow to machining process 2. To identify what kind of NG that is mostly happen 3. To find the way of minimizing NG that mostly happened 4. To save the cost by minimizing NG
1.4 Scope
In this research, there are scopes due to limitation of resource.
1. The continuously observed NG type is only at the most defective lines.
2. The research is done at incoming section of PT. Mitsubishi Electric Automotive Indonesia until right before machining process.
3. The observation is started from March 2015 until June 2015.
1.5 Research Outline
Here are the descriptions of chapters which systematically construct the research.
15 Chapter I Introduction
This chapter includes the problem background, research questions, objectives, scope and limitation of the research as well as the research outline.
Chapter II Literature Study
This chapter consists of all related and supporting concepts and theories as the guidance to keep the research on the right track categorized as QC 7 tools such as Flowchart Diagram, Pareto Chart, histogram, Fish Bone Diagram and also the literature about gauge and cost analysis.
Chapter III
Chapter IV
Research Methodology
All systematic steps and detailed framework are provided in this chapter to arrange this research to be conducted methodically. The framework is made regarding the literature study as well.
Company Profile
Company profile is explained in this chapter together with the general product and operation scheme of the company.
The company profile in this report consist of company description, company’s operation, organization chart of human resource department, job description of human resource department, company’s production process, and company’s product
Chapter V Data Collection and Analysis
Data will be taken and collected during the research and finally be processed as well as analyzed whether the research could meet the objectives or not.
16 Chapter VI Conclusion and Recommendation
In this chapter, conclusion is drawn through analysis of data to meet the research objectives and recommendations are given for future research
17
CHAPTER II
LITERATURE STUDY
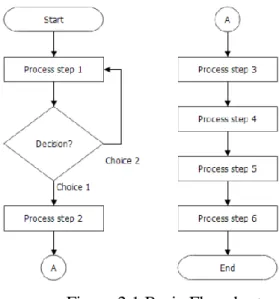
2.1 Flow Chart
A Flowchart diagram is a type of diagram which depicts the flow or sequence of processes using several types of symbols and arrows as the connectors. There are
“Start” and “End” symbols symbolized by rounded rectangles at the beginning and the end of the diagram. The two most general types of symbols used in a flowchart are rectangular box which represents a processing step or activity and diamond which denotes decision. When it comes to decisions, one of them may lead to repetition of previous processes or initiate new and different activities. An example of a basic flowchart is shown in Figure 2.1.
Figure 2.1 Basic Flowchart Source: google image
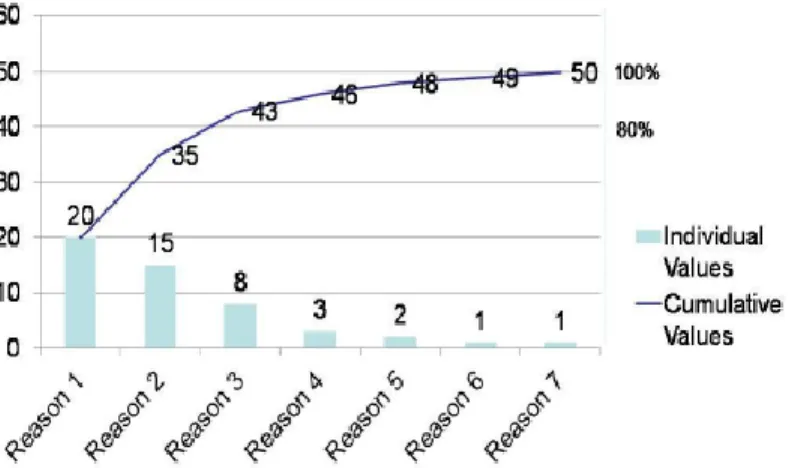
2.2 Pareto Chart
Pareto chart is one of exploratory tools which consist of vertical bars which visually symbolizes frequency of data and summarizes the significance of each data and line
18 graph which shows the cumulative data in percentage. This chart is very helpful to depict the most significant or frequent data to focus on when there are lots of problems or causes found in the processes by placing the problems in decreasing order (Mitra, 2008).
Figure 2.2 Structure of Pareto Chart Source: http://viramidwifery.blogspot.com
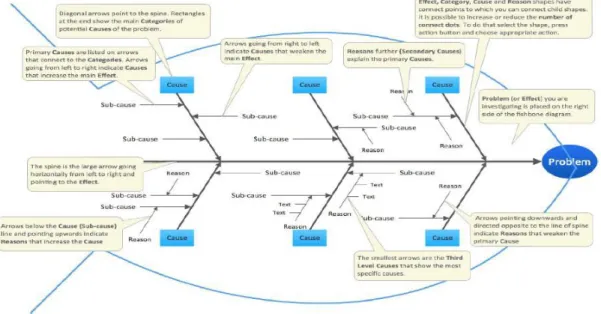
2.3 Fish Bone Diagram
Fish Bone Diagram or Cause-and-Effect Diagram is a causal diagram created by Kaoru Ishikawa in 1943 that detects and categorizes possible causes of a problem as the effect (Mitra, 2008). This diagram is called fishbone diagram because it is drawn as the fish’s skeleton and the main causal categories are represented by the bones.
The structure of Fish Bone Diagram is shown is Figure 2.3. The main causes are usually grouped into several categories that are used in manufacturing industry which include:
People : anyone that is involved in the process.
Methods : the way the process is performed and the requirements for doing it such as procedures, rules and etc.
Machines : any equipment or tools needed to complete the process.
19
Materials : basic things that are transformed to produce final product in the process.
Measurements : data that are generated from the process as the evaluation of its quality.
Environment : the conditions, such as time, temperature, location, and culture in which the process is completed.
Figure 2.3 Structure of Fish Bone Diagram Source: http://www.mindtools.com
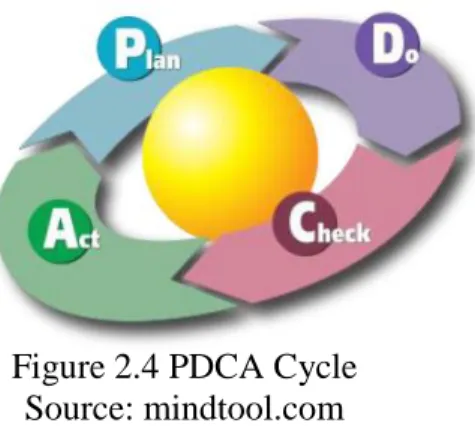
2.4 What is PDCA
PDCA is based on the “Shewhart cycle,” and was made popular by Dr. W. Edwards Deming, considered by many to be the father of modern quality control.3 During his lectures in Japan in the early 1950s, Deming noted that the Japanese participants shortened the cycle’s steps to the now traditional plan, do, check and act. It is interesting to note that Deming preferred plan, do, study, and act because the translation of "study" from Japanese to English has connotations closer to Shewhart's intent than does "check."4 This model has been around for 60 years and it is relevant
20 in today’s public health world, providing a defined and well tested process to achieve lasting improvement to the problems and challenges public health is now facing.
Figure 2.4 PDCA Cycle Source: mindtool.com
Spending adequate time in each phase of the PDCA cycle is imperative to having a smooth and meaningful quality improvement process. The elements put forth here comprise a deliberate process based on the scientific method, and help ensure that improvement efforts are conducted in a way that will maximize the degree of success achieved.
2.4.1 Phase of the PDCA Model
The phases of the PDSA model below assume that just one underlying, or root cause will be addressed by testing just one intervention. When undertaking the PDCA process, the team may decide to address more than one root cause, and/or to test more than one intervention to address a root cause. In such instances, it will be important to measure the effect of each intervention on the root because it is intended to address.
Plan: The purpose of this phase is to investigate the current situation, fully understand the nature of any problem to be solved, and to develop potential solutions to the problem that will be tested.
21 1. Identify and prioritize quality improvement opportunities. Usually a team will find that there are several problems, or quality improvement opportunities, that arise when programs or processes are investigated. A prioritization matrix8 may help in determining which one to select. Once the quality improvement opportunity has been decided, articulate a problem statement. Revisit and, as appropriate, revise the problem statement as you move through the planning process.
2. Develop an AIM statement that answers the following questions:
a. What are you seeking to accomplish?
b. Who is the target population?
c. What is the specific, numeric measure(s) you are seeking to achieve?
d. The measurable improvement objective is a key component of the entire quality improvement process. It’s critical to quantify the improvement you are seeking to achieve. Moreover, the entire aim statement also will need to be revisited and refined as you move through the planning phase.
3. Describe the current process surrounding the problem in order to understand the process and identify areas for improvements. Flow charts and value stream mapping are two examples of methods to accomplish this.
4. Collect data on the current process. Baseline data that describe the current state are critical to further understanding the process and establishing a foundation for measuring improvements. The data may address, for example, time, people, space, cost, number of steps, adverse events, and customer satisfaction. A host of tools are available to collect and interpret data on the process, such as Pareto charts, histograms, run charts, scatter plots and control charts. The data collected must be aligned with the measures listed in the aim statement.
5. Identify all possible causes of the problem and determine the root cause. While numerous causes will emerge when examining the quality improvement opportunity, it is critical to delve in and carefully identify the underlying, or root, cause of the problem, in order to ensure that an improvement or intervention with the greatest chance of success is selected. Brainstorming is a useful way to identify
22 possible causes and a cause and effect/fishbone diagram and the 5 Whys are useful for determining the actual root cause.
6. Identify potential improvements to address the root cause, and agree on which one to test. Once the improvement has been determined, carefully consider any unintended consequences that may emerge as a result of the implementing improvement. This step provides an opportunity to alter the improvement and/or develop countermeasures as needed to address any potential unintended consequences. Revisiting the aim statement and revising the measurable improvement objectives are important steps at this point.
7. Develop an improvement theory. An improvement theory10 is a statement that articulates the effect that you expect the improvement to have on the problem.
Writing an improvement theory crystallizes what you expect to achieve as a result of your intervention, and documents the connection between the improvement you plan to test and the measurable improvement objective.
8. Develop an action plan indicating what needs to be done, who is responsible, and when it should be completed. The details of this plan should include all aspects of the method to test the improvements – what data will be collected, how frequently data are collected, who collects the data, how they are documented, the timeline, and how results will be analyzed.
Do: The purpose of this phase is to implement the action plan.
1. Implement the improvement.
2. Collect and document the data.
3. Document problems, unexpected observations, lessons learned and knowledge gained.
Check/Study: This phase involves analyzing the effect of the intervention. Compare the new data to the baseline data to determine whether an improvement was achieved, and whether the measures in the aim statement were met. Pareto charts, histograms,
23 run charts, scatter plots, control charts and radar charts are all tools that can assist with this analysis.
1. Reflect on the analysis, and consider any additional information that emerged as well. Compare the results of your test against the measurable objective.
2. Document lessons learned, knowledge gained, and any surprising results that emerged.
Act: This phase marks the culmination of the planning, testing, and analysis regarding whether the desired improvement was achieved as articulated in the aim statement, and the purpose is to act upon what has been learned. Options include:
1. Adopt: Standardize the improvement if the measurable objective in the aim statement has been met. This involves establishing a mechanism for those performing the new process to measure and monitor benchmarks on a regular basis to ensure that improvements are maintained. Run charts or control charts are two examples of tools to monitor performance.
2. Adapt: The team may decide to repeat the test, gather different data, revise the intervention, or otherwise adjust the test methodology. This might occur, for example, if sufficient data weren’t gathered, circumstances have changed (e.g., staffing, resources, policy, environment, etc.), or if the test results fell somewhat short of the measurable improvement goal. In this case, adapt the action plan as needed and repeat the “Do” phase.
3. Abandon: If the changes made to the process did not result in an improvement, consider lessons learned from the initial test, and return to the
“Plan” phase. At this point the team might revisit potential solutions that were not initially selected, or delve back into a root cause analysis to see if additional underlying causes can be uncovered, or even reconsider the aim statement to see if it’s realistic. Whatever the starting point, the team will then need to engage in the Plan cycle to develop a new action plan, and move through the remaining phases.
24 PDCA offers a data-based framework based on the scientific method. This simple yet powerful format drives continuous and ongoing efforts to achieve measurable improvements in the efficiency, effectiveness, performance, accountability, outcomes, and other indicators of quality in services or processes which achieve equity and improve the health of the community.
25
CHAPTER III
RESEARCH METHODOLOGY
This Chapter informs the reader how the project was conducted by describing the detail steps in conducting the research. The steps should be set systematically to help the researcher solve the initial problems. By constructing the suitable research methodology, the research and analysis can be done accurately. Hereby the steps performed to solve the initial problems in this research as follow:
Initial Observtion
Problem Identification
Literature Study
Initial Observation
To understand the most problem faced at PT.
MEAINA
To determine the area of problem
To understand the product process at PT.
MEAINA Problem Identification
To observe the effect of current effect of NG product
To define the objectie of project
To define the scope, limitations, and assumptions used in the project.
Literature Study
To explain how PDCA method works
To explain the definition of QC 7 tools
To explain how the gauge works
To describe the to use the method to solve the problems
26 3.1 Initial Observation
Initial observation is the first step to start the project of PT MEAINA. This step is done to figure out the overview of the company and deeply knowing the product process at PT MEAINA together with the NG exitence.
3.2 Problem Identification
The purpose of problem identification is as the continuation of initial observation. The focus is on the problem existed at PT MEAINA. The first step done at problem identification is to define the problem statement as the fundamental of the project that will lead the project to the main purpose of conducting the project.
In this project, the main problem is the existence of NG bracket that still flow to the machinig process and the high exitence of NG product at the product process. Thus, it needs to be minimized by firtly starting from the type of NG that contribute most to the total number of NG.
Data Collection and
Analysis
Conclusion and Recommendation
Data Collection and Analysis
To explain the current condition of PT. MEAINA
To obtain the data of highest type of NG existed
To obtain the data of the most defective lines
To obtain the main cause of the problem
To define the best solution for the problem Conclusion and Recommendation
To make a conclusion which answer the research questions.
To give recommendations for the company and for future purposes.
27 3.3 Literature Study
After constrating the detail of problem identification, the next important thing to do is collecting the literature study to support the project with reliable and relevant references to guide the process of solving the problem. Literature study is the sources to review the material relevant to the study to provide a clear theoretical background of the research. Study literature can also help the researchers to understand more the field that is trying to be researched and analyzed since the research is universal.
In this project, there are several important points that need to be elaborated and the sources related to the topic need to be collected. The use Plan Do Check Act approach in improving output. The use of QC 7 tools has also been widely used to identify problem and make the priority for which problem that must forstly be started. The use of the method to solve the problem must be excellently understood and clearly explained.
3.4 Data Collection and Analysis
In this step, the continuation of privious step is began again. This is one of essential step as the collection of data must be done then the data obtained must be analyzed toward the solution of the problem.
In this project, the data collection is done through collecting the total number of NG product together with the type of NG product. It is done through each production line to then find the most defective line. The analyisis is also done to find the root cause of the problem through usage of QC 7 tools. At the end, the result is obtained through the analysis to find the best solution for the problem. The analysis will also be done through the cost-benefit analysis to find how much cost is saved by the execution of this project
28 3.5 Conclusion and Recommendation
Once the data collection and analysis is finished, a conclusion related to the to research must be stated to depict the result of the research as it has been successfully conducted and telling the reader that the project has been coming to an end. The conclusion will determine how significance the project was.
The result of the project must determine whether it can answer the research objectives or not. Since the purpose of the project is for real implementation, some recommendations for the company may be delivered and applied for the benefits in the future.
3.6 Detail Framework
Begin the project
Initial Obseration
PROBLEM IDENTIFICATION
LITERATURE STUDY
29 Find existence of
defective product
Determine the NG type that contribute the most
Determine the most defective line for the related NG type
ANALYZE AND FIND THE BEST SOLUTION
Comparing and calculate the cost saving after
improvement Determine the root cause of the most existing NG type
Conclusion and Recommendiation DATA COLLECTION
30
CHAPTER IV COMPANY PROFILE
4.1 Description of Mitsubishi Electric
Mitsubishi Electric Automotive Indonesia is located at Bekasi International Industrial Estate Block C 11 No. 1 Cikarang-Selatan, Bekasi 17550. PT. Mitsubishi Electric Automotive Indonesia is subsidiary of Mitsubishi Electric Corporation (MELCO) located at Himeji, Japan.
Melco itself was built by Yataro Iwasaki in 1870. Mitsubishi was built by promoting the business difference growing as modern company. In 1917, Mitsubishi Goshi Kaisha became mother company called Mitsubishi Headquarter. In 1921, MELCO was born and in 1946, Mitsubishi Headquarter was separated and every Mitsubishi company started to run the business independently.
Figure 4.1 PT. Mitsubishi Electric Automotive Indonesia
31 4.2 Rules and Programs of the Company
PT. Mitsubishi Electric Automotive Indonesia usually called MEAINA has some programs related to its acronym.
M = Motivation
E = Environment and enthusiasm A = Attitude
I = Innovative and initiative N = No fat for health
A = Always smile and greetings.
Those are the foundation of the company in the daily activity of all employees. The employee are expected to have high motivation to complete the job, take care of environment, keep a good attitude, keep the body health, and always greet each other by giving smile. The company believes that this will support the development of company to the future.
4.3 Subsidiaries of Mitsubishi Electric in Asia-Pacific
There are 26 subsidiaries of Mitsubishi Electric in Asia-Pacific and employed around 17,000 employees for the total. The Asia-Pacific subsidiaries are located in eight countries. They are India, Thailand, Singapore, Indonesia, Australia, Malaysia, Philippines and Vietnam.
32 Figure 4.2 Separation of Mitsubishi Electric in Asia-Pacific
33 4.4 Structure of PT. Mitsubishi Electric Automotive Indonesia
Figure 4.3 Organization Structure of PT. Mitsubishi Electric Automotive Indonesia The yellow signed is the Board of Director of PT. MEAINA. The Board of Directors are sent directly from MELCO, Japan together with Quality and Engineering Advisor. There are eight departments in PT MEAINA and each department is led by one manager
For the detail of the job, President Director is responsible for the whole system, accounting, HRGA and Sales. The Director is responsible for Engineering, Production, PPIC and Purchasing, QA, and MS department activities. Quality advisor
Japanese Staff
PRESIDENT DIRECTOR
DIRECTOR
※ SALES VICE PRESIDENT
ENGINEERING
※ ADVISOR
PRODUCTION PPIC &
PURCHASING QUALITY CONTROL ADVISOR QUALITY SYSTEM
ACCOUNTING
& FINANCE HRGA SALES Quality Assurance
Management System
34 is responsible for Technical Support and Local Manpower Development. Sales advisor is responsible for Strengthening Customer Relation and engineering advisor is responsible for stator Technical Support. The rest of departments are responsible for their own job description based on the name of department.
There are two categories of employee at PT MEAINA; contract and permanent. For detail, there are 181 contracted employees and 401 permanent employee of PT MEAINA.
4.5 Product of PT. MEAINA 4.5.1 Assembly Product
Figure 4.4 Assembly Product of PT. MEAINA
Above is the assembly product produced by PT. Mitsubishi Electric Automotive Indonesia. There are two assembly lines at PT. Mitsubishi Electric Automotive Indonesia; Starter assy and Alternator assy. Rotor is used as the source of electricity
35 of automobile and starter is used to start the engine of automobile. This product is usually mounted at the car which registered as MEAINA’s customer.
4.5.2 Part Manufacture Product
Figure 4.5 Part Manufacture Product of MEAINA
Above is the parts manufacture produced by PT. Mitsubishi Electric Automotive Indonesia consisting of Rotor for alternator, over running clutch for starter, and brush holder for starter.
36 Figure 4.6 Part Manufacture of PT. MEAINA
PT. Mitsubishi Electric Automotive Indonesia also produce brackets categorized as bracket front and bracket rear. The brackets itself is made for Starter and Alternator.
4.6 MEAINA Customers
There are two categories of MEAINA customers, the first one is domestic customers and second is export customers. The domestic customers are;
1. MKM / KTB (Mitsubishi) 2. SIM (Suzuki)
3. HPM (Honda) 4. NMI (Nissan) 5. ADM (Daihatsu)
Not only domestic customer, the foreign customers of MEAINA are:
1. MELCO ( Japan ) 2. META ( Thailand ) 3. LAMCOR ( Philippines ) 4. MEAA ( USA )
37 5. MEAC ( Czech Rep. )
6. APM-AE ( Malaysia ) 7. MESAC ( China ) 8. MEAI ( India ) 9. MEAB ( Brazil ) 10. MEUF ( France )
Figure 4.7 Customer of MEAINA
4.7 Certification of MEAINA
PT. Mitsubishi Electric Automotive Indonesia has fulfilled the certification for ISO/TS 16949 and recertified in 2012. It is standardization for technical specification aimed at the development of a quality management system that provides continual improvement, emphasizing defect prevention and reduction of variation and waste in the supply chain.
PT. MEAINA is also certified for ISO 14001 and recertified in 2010. This certification concern on the criteria for environmental management, meaning that MEAINA has put an effort to be environmentally-friendly.
38 Figure 4.8 Certification Obtained by MEAINA
39
CHAPTER V
DATA COLLECTION AND ANALYSIS
5.1 Plan
In this step, several collections of data are done to plan and identify the type of NG that must be improved later. This step is necessary before as the initial step of running the project. In the beginning, there will be brief explanation of flow process of daily production at PT. MEAINA to depict the product process of PT. MEAINA. Then, problem main cause analysis will be decided, continued by main course and together with the improvement plan.
5.1.1Flow Process of Daily Production at MEAINA
Figure 5.1 Flow Process of Daily Production
40 The figure above shows flow process of daily production at PT. Mitsubishi Electric Automotive Indonesia (MEAINA). Since the topic of this study is to prevent the flow of defective bracket at incoming area to machining process, then the analysis must be began from the very first time blank bracket arrive to PT. Mitsubishi Electric Automotive Indonesia until those blank brackets are machined. As this study focuses on the NG blank bracket caused by supplier and have been the concern of quality incoming section, the area of study will only the stuffs that involve quality incoming section and anything related with it to analyze the NG caused by supplier.
When the blank brackets produced by suppliers arrive in PT. Mitsubishi Electric Automotive Indonesia, that brackets will be taken care by warehouse. Warehouse section itself has responsibility to keep the incoming blank bracket before the brackets are further processed. After the brackets are kept by them, there will be another section responsible for that blank bracket before it comes to machining process. It is quality incoming team.
As explained above, quality incoming group will handle the bracket before it comes to machining process. This is a very essential part of this study since this process has started to involve quality assurance team, so the quality assurance process at PT.
Mitsubishi electric Indonesia begin here. Basically, the quality incoming inspector will check the blank bracket produced by supplier visually. The inspectors usually take some samples of bracket on the surface and check the abnormality visually. The sample taken by quality incoming inspector is usually the bracket placed on the surface of rack because one rack consist of hundreds bracket. In case the inspector finds abnormality at the samples they inspect, so one lot of blank bracket will be rejected and supplier will have to repair it. Once the quality incoming team finished inspecting the blank bracket, the blank bracket that pass the incoming quality inspection will be proceed to the next process which is machining process and is considered as work in process.
41 After finish with the incoming quality process, the next process is off course machining process. The brackets that have passed the incoming quality inspection will be machined using TC and NCLA machine. In this process, there will be drilling process and etc. During the machining process, quality assurance team will not take their hands out of this process. The machining section of quality assurance team will be assigned to inspect and watch the machining process at production lines. In case abnormalities are found during the machining process, that lot of production can be rejected by quality assurance team. The inspection process usually involves the dimension of bracket after the machining process. The dimension of bracket can somehow be changed after the machining process. It can be caused by the machine activities or other external factors such as problem with measuring devices and etc.
The machining process of quality assurance team will also work using Coordinate Measuring Machine (CMM) to ensure the dimension of bracket still within its tolerance and specification established before. Basically, the department in charge for this process is production department. But, to ensure the quality of products produced, the quality team must also be involved since the quality assurance must be applied in every single step of manufacturing process. Thus, the cooperation between Quality Assurance department and Production department is essential to support the production process.
After done with the machining process, there is still a further process of ensuring quality of product. The next quality team assigned is outgoing quality team as the next process is called quality outgoing inspection. This outgoing team is responsible for inspecting and checking the bracket after machining process by visual. Since the visual NG can sometimes be existed after machining process, it is the responsibility of outgoing team for ensuring the quality of product free of visual NG. The difference between machining section and outgoing section is the types of NG they inspect.
When machining section focus on dimension NG, outgoing section will focus on visual NG. Outgoing quality inspection is the last process of quality assurance as it’s
42 named outgoing, this process is to ensure the quality of product before it is shipped to customers.
After finish with the quality assurance process, the products are ready to be delivered to customers and located at the warehouse as the product is considered good. The warehouse department will take care of the storage of product before it is shipped to customers. Based on the figure above, the focus of this study is only at checking material before production process done by quality incoming section.
5.1.2 Monitoring Process
To find what kind of NG types usually happen at incoming area, the monitoring is done together with the data collection about the defect. The first, analysis is tried to be done to find whether the NGs are mostly caused by Supplier or mostly caused by MEAINA’s machining process.
Table 5.1 Data Claim No Data claim of bracket
Period
Total Oct-14 Nov-14 Dec-14
1 NG supplier bracket 26,984 7,341 16,163 50,488
2 NG machining process 16,335 2,141 11,028 29,504
Nov-2014 Dec-2014 Oct-2014
Figure 5.2 Data Claim Report at the End Of 2014
43 At first, the monitoring process is done through figuring out which NG is more dominant, whether it is NG caused by supplier or NG caused by machining process of PT. Mitsubishi Electric Automotive Indonesia. The data collection is done for the NG data at the end of 2014 because for that period, the Scrap Production Report (SPR) has been closed so the data can be easily utilized.
Looking at the data, there are fluctuations of amount of NG for NG caused by supplier. For three last month at the end of 2014, October shows the highest rate of NG, then significantly decrease on November and increase again on December. The pattern happens at NG data caused by machining process. But, the increasing and decreasing are not really significant as shown at the table and figure.
Looking at the data again, it is clearly proved that the NG caused by supplier is way bigger than the NG caused by machining process of MEAINA. The total NG caused by supplier for last three months of 2014 is 50,488 pieces and it is only 29,504 pieces of defective bracket caused by machining process. The difference of 20,984 pieces shows a very significant difference for those two kinds of NG. Thus, that is why the focus of this project is to minimize NG caused by supplier as it gives the biggest impact and it causes the biggest loss.
5.1.3 Finding the Most Defective Line
Table 5.2 NG Existence for the Last Semester of 2014
Oct-14 Nov-2014 Dec-14
1 Alternator Bracket Rear 6,879 1,609 3,887 12,375
2 Alternator Bracket Front 7,119 1,355 3,624 12,098
3 Starter Bracket Front 6,593 2,398 4,521 13,512
4 Starter Bracket Rear 331 80 135 546
5 EPS 6,062 1,899 3,996 11,957
No Model Period
TOTAL44 Figure 5.3 Data Defect from Supplier for Each Line Model
The data above shows the NG brackets flow to lines, meaning that mistake happen at incoming quality inspection so that the defective bracket can flow to machining process. In general, there are five categories of machining line at PT. MEAINA. They are Alternator Bracket Rear, Alternator Bracket Front, Starter Bracket Front, Starter Bracket Rear, and Electric Power Steering (EPS).
Based on the data recorded still on the same period (the end of 2014) among those lines category, the highest number of defective bracket exist at Starter Bracket Front (SBF) line and the lowest is at Starter Bracket Rear (SBR) line. Based on the table, it can be seen that Starter Bracket Front always contributes the highest number of NG existence on October until December 2014, even the 1st highest on November and December 2014. The data also shows that the NG is really minimized on the November, meaning that the incoming quality inspector did a really good job during that period.
Regarding to the recorded data above, so it can be concluded that the most defective lines caused by NG’s supplier is Starter Bracket Front. Thus, the focus of this project is at Starter Bracket Front line because it is known that the biggest loss caused by supplier’s NG happen at this line.
Since the most defective line has been established, the collection of data for the next step is done at Starter Bracket Front line and the next job is to find the data about
45 what type of defect does mostly happen at Starter Bracket Front Line by analyzing and collecting the data of defect caused by supplier then establish what kind of defect that have to be minimized or even removed at this stage before continuing to the next stage of removing or minimizing defect. This step is done based on the continuous process of improvement in purpose to minimizing defect as the root of loss at PT.
Mitsubishi Electric Automotive Indonesia.
5.1.4 Finding the Highest Type of NG Existence
Table 5.3 Number of NG Based On NG Type
Figure 5.4 Data Phenomena Defect From Supplier at Line SBF
After getting the information whether the NGs are mostly caused by suppliers or caused by process at PT. Mitsubishi Electric Indonesia and based on the data it is proved that NGs caused by supplier are much bigger in comparison with NG caused
Oct-14 Nov-2014 Dec-14
1 Diameter Lever Minim 621 381 2,709 3,711
2 Burry 1,650 543 801 2,994
3 Swelling 1,396 352 757 2,505
4 Blackspot 1,251 849 149 2,249
5 Deform 1,675 273 105 2,053
TOTAL
No Phenomena Period
Small diameter lever
46 by MEIANA Process. The next step that should be done is figuring out what type of NG that mostly caused by suppliers.
As the concept of continuous improvement, the type of NG caused by supplies that must be overcome must go to the highest type of NG existed recently. Observation through data of NG product recorded is done. Recording data of NG product is done on the period of the end of 2014 as what have been done at the observations before.
There are five common phenomena observed as these phenomena mostly happen and flow to line Starter Bracket Front. The type of NG that usually happen at Starter Bracket Front line are diameter lever minim, burry, swelling, black spot, and deform.
As shown at the data on the period October until December 2014, the difference between one type of NG to the other type of NG is not really significant each other.
The numbers are around 2,000 pieces of each NG type except, there is one type of NG shows a little bit more significant, it is small lever diameter. The number of small diameter lever happen at Starter Bracket Front line on the period October 2014 until December 2014 is 3,711 pieces. It is simply higher among the other types of NG at Starter Bracket Front line.
Based on the data above, it is clear that the next focus of this project is to eliminate the existence of small diameter lever caused by suppliers that flow to Starter Bracket Front line as this type of defect contribute the highest type of NG to Starter Bracket Front line.
Small diameter lever is type of NG that can cause many problems to MEAINA’s products. Mostly, the problem will start to arise when the process have reached the assembly line. In the assembly process, the brackets that have been machined will be assembled in the assembly line together with the other components of starter because this problem observed happen at Starter Bracket Front. If the diameter lever considered small and is not based on the specification established, the bracket will not be able to be assembled and together with the other components so that the bracket will be considered NG.
47 5.1.5 Problem Factor Analysis
Figure 5.5 Fish Bone Diagram
MACHINE
Inspectors do not really understand the limit sample
Lack of training
There is no supporting JIG in the dimension of certain area.
Taking and checking of sample is not really
appropriate
Taking and checking sample only on certain
area or random Visual check only
There is no measurement point on certain area
Defect is detected after production process on certain
area
Defect can't be detected before production process Dimension
influenced by temperature
METHOD ENVIRONMENT
MAN
Lack of measurement equipment to detect
problem
THERE ARE MANY INCOMING DEFECT PART OUTFLOW TO PRODUCTION PROCESS
MATERIAL
48 Figure above shows the fishbone diagram involving the 4M + 1E analysis; Man, Machine, Material, Method, and Environment. This tool is part of Quality Control 7 tools and usually uses to analyze the effect of one main cause as being done through this project. The analysis to find the root cause of this problem is done through analyzing those five important aspects. Maachine, material, method, and environment have played an important role on this project. The purpose of this fishbone diagram is actually only to see and analyze how far those suspected factors on this cause and then will be anlyzed and the effect of each factors to this main cause of incoming defects that flows to machining process.
5.1.5.1 Man
As it shown in the fish bone diagram, man factor has been one of the caused of this problem. There are some branches of the bone as it shows the cause that is considered as man factor. As it called man factor, of course any cause of the problem will refer to Human whether activity or ability to the related job.
The very first problem suspected refer to the inspector. The quality incoming inspector is the man behind the mask as they are the first one who deal with the incoming bracket before going to the machining process. As they are the first team who face the bracket, they might have known well the procedure of inspecting the incoming bracket, in this case, it is limit sample that really matters in this case.
Some of the inspector may not really understand about the application of the limit sample. Some of the inspector may be the new inspector since the turnover of this a quiet high, so the inspectors may change oftenly. This has been a quiet big trouble for the quality incoming section. Moreover, limit sample is changing document that sometimes can be changed based on the updated rules and procedure after conisdering the needs of customer and establishment from Mitsubisihi Electric Corporation as the mother of Mitsbusihi Electric Automotive Indonesia.
49 For this problem, training must be really needed by the inspectors. The inspectors must given a training about the application of limit sample moreover if the limit sample has changed for several reason. Here, again the application of Horenso is really needed when as the main factor of a successfull flow of communication. The training must be done as immediate as possible to the new inspector when the limit sample is updated to ensure the understanding of inpector in letting the bracket go through the machining process.
5.1.5.2 Machine
The next important aspect is machine. Machine has been a very important tool that support the human’s activities. Since the application of measurement have instensly been done at PT. Mitsubishi Electric Automotive Indonesia, then the needs of machine is really necessary. The high usage machine ability have been one aspect why this aspect must be really considered.
The product produced by PT. Mitsubishi Electric Automotive Indonesia needs precision a lot. To ensure the precison, the usage of measurement devices is really needed especially for the quality inpectors. In current condition, there is no measuring devices used by quality incoming inspectors. This measurement tools such as Coordinate Measuring Machine, calipers, or dial are mostly used by quality machining process team.
Moreover, the current condition shows that there is no such supporting measurement devices to detect the diameter lever problem which is considered minim. Thus, to detect the small diameter lever, the inspector must do something with the measurement tools to check whether diameter lever is match the specifiction as stated at the limit sample or not. By the help of this too, it is expected that the small diameter lever can as soon as possible be detected by the incoming quality inspector to prevent the NG bracket flow to the machining process.
50 For this case, the new supporting jig is necessary to overcome this problem. The jig can be designed based on the area will be measured and the inspector can utilize the jig to check the accuracy of certain area.
5.1.5.3 Method
The next important is the apllied method. In inspecting the blank bracket, some method have been done to ensure the quality of blank bracket in inspection process.
So the existing method must now be a little bit improved.
For the case of diameter lever which is considered minim, it is really dimentional. It is known that the existing method of checking is only by visual. It is also known that the method of visual checking only utilize the ability of human eyes. Human eyes of course can not detect the difference of inches, it is even still hard to differ between 1 cm and 2 cm without any support from supporting tools. Thus, to detect the problem of small diameter lever, it can not be done only by visual check. The measurement point on certain area must also be done to ensure the diemeter is match to the limit sample. Any kind of supporting tools considered as measuring devices must be utilized to solve this problem. So, the lever area must checked using measuring devices.
The next problem related to the method is the sample taking process. It is about how the sample are chosen by inspector. This sample will later be inspected whether by visual or by measuring devices. The method of taking the sample may not be really appropriate. The fact is the sample taken by operator is only a small amount of the whole sample in one rack consisted of hundreds bracket. Moreover, the sample taken by inspector is only the blank bracket located on the surface because that is the only part that can be reached by quality incoming inspector. Since the inspectors have only taken several blank bracket located on the surface in one rack, it is wondered whether the quality of blank bracket inspected by operator can wholely depict the quality of blank bracket in one rack. This has been a very big question and this problem has
51 been suspected to be one of the cause of the flow defective bracket to the machining process.
5.1.5.4 Material
In terms of material, the NG is sometimes can not be detected before the machining process when it is supposed to be detected before the machining process. As the material of bracket is casted iron, so it is a little hard to inspect the NG using eyes only especially for the NG categorized as dimension. Another example of NG that is usually detected after machining process is blow hole. This has been a problem since those defects are supposed to be detected before machining process by quality incoming inspector, not after or while machining process by quality machining process inspector.
5.1.5.5 Environment
The last factor considered to be the cause of defective bracket flow to the machining process is the environment. This factor appears to be external factor that may have affected the quality of bracket especially the dimension of the bracket.
It is known that the material that the bracket made of is a casted iron. It is known that iron may be swelled as the effect of temperature. This swelling process is caused by the temperature around at the environment of the bracket. The swelling process can change the dimension of bracket as well. How far the dimension change is based on the swelling coefficient of the material. The temperature around the bracket can sometimes be extremely hot, or sometimes become extremely cold because the saving treatment of the blank brancket is not really exclusive as it is only located in the warehouse area. This what makes the environment of the blank bracket especially the temperature can effect the dimension of bracket as the swelling effect. The swelling
52
No Main Problem Quantity Percentage Qty
Cummulative
Percantage Cummulative 1 There is no supporting jig in the dimension of certain area 1856 50% 1856 50%
2 There is no measurement point on certain area 928 25% 2784 75%
3 Defect is detected after production process on certain area 451 12% 3235 87%
4 Lack of training 311 8% 3546 95%
5 Temperture affect dimension 165 5% 3711 100%
may lead the dimension of bracket out of the dimension soecification as stated in the limit sample.
5.1.6 Finding the Dominant Cause of NG
Table 5.4 Quantity of NG Caused by Determined Factor
Afer finish with the fish bone diagram analyzsis, some of the branch of the bone as the causes of the problem are further anlyzed. This project appear to analyze the NG bracket caused by small diameter lever through the cause of the NG itself. The points taken are how many small diameter lever caused by unavailability of supporting jig in the dimension of certain area, how many Small diameter lever of bracket caused by unavailability of measurement point on certain area, how many Small diameter lever of bracket is detected after production process, how many Small diameter lever of bracket caused by unoptimized training for inspector, and how many Small diameter lever of bracket caused by the influence of temperature to the dimension of bracket.
The result is quantity of Small diameter lever of bracket together with the cause can be obtained. As the result, some of the dominant causes can be found. As it is shown at the data, the cause of Small diameter lever of brackets mosly come from unavailability of supporting jig in the dimension of certain area, in this case it is the diameter lever. Then, it is followed by the unavailability of measurement point on certain area. Then followed by the defect detected after production process, unoptimized training, and the lowest cause of NG is the change of dimension affected
53 by temperature. The cummulative of the NG is 100% meaning that the whole tested NG bracket are inspected and the cause of NG is analyzed and judged. This is the NG bracket that are machined by Starter Bracket Front line as found as the most defective line through the execution of this project. After finding the dominant cause the main problem, so the next focus of this project is to improve and minimize the NG bracket at diameter lever area through providing dimension jig on certain area and add the measurement point on certain area, in this case it refers to the diameter lever area.
Figure 5.6 Main Problem Chart
5.1.7 Improvement Plan
After determining what kind of NG that will be focused on, and what is the defective line together with the cause analysis using fish bone diagram, the next step is the improvement plan. This step has been very essential as this is the main action of the project to eliminate the NG bracket.
Before going the improvement action, it is better to prepare the action using 5W + 1H analysis first involving what, who, where, when, why, and how.
54 Table 5.5 5W + 1h Analysis
What Optimizing inspection process at incoming area
Who Inspector QA
Where Incoming area and measurement room When March 10, 2015 – June 10, 215
Why Many defect categorized small diameter lever flow to Starter Bracket Front line
How Optimize inspection process at Strater Bracket Front Line
1. Adding check point at diameter lever area to inspection report 2. Using pin gauge for checking the diameter lever area
3. Verification using Coordinate Measuring Machine when the
abnormality is found at three measurement points ; upper, center,bottom
Talking about what, it is surely about what is the focus of this project. It is determined already before that the focus is to optimizing inspection process at incoming area to reduce the number of NG bracket caused by suppliers to machining process. The “who” is the one who will apply the improvement action later. In this case, QA inspector will be responsible to apply the improvement plan. The location of improvement is at incoming area and measurement room. The improvement is done from March 10 until June 10, 2015. The last is how does the team do the improvement. After looking at existing NG bracket data, it is determined that the focus will be on eliminating NG at diameter lever area. The, it will be done by adding check point at diameter lever area to inspection report, utilizing designed pin gauge for checking the diameter lever area, and running the verification using Coordinate Measuring Machine (CMM) when the abnormality is found at three measurement points; upper, center, and bottom
55 5.2 Do
As the planning processes are finished, the next step to do is the “do” step. Here, the implementation of project is done through the solution of the main problem found at planning processes. The “do” process is of course the improvement action.
5.2.1 Improvement Action
5.2.1.1 Inspection Process before Improvement
F
Fiiggururee 55..77 VViissuuaall CChheecckkiinngg (
(EyEyee))
FiFiggururee 55..88 PPoossiittiioonn CChheecckkiinngg
FiFigguurere 55..99 CChheecckk sshheeeett bbeeffoorere ImImpprroovveemmeenntt
There is no check point for diameter lever area
56 The pictures above shows the inspection process before improvement. At the beginning, the quality incoming inspector check the incoming bracket only by visual using eyes. This is the common inspection method that have usually been doing by the quality incoming inspectors. For the position checking, the diameter lever is only inspected by visual by the quality inspectors. The existing check sheet showing that there is no point for diameter lever checking.
Based on the fact above, it is clear that the diameter lever is something impossible to be inspected by visual only since it is categorized as dimension and need to be measured. Human eyes has a very limited ability to play with dimension especially in inches or mili meter. So, it is impossible to check on the diameter lever by visual only. After that, one point of diamter lever area must be put on the checksheet.
5.2.1.2 Inspection Process after Improvement
Figure 5.10 Inspection Process after Improvement Addition of diameter lever check point