Rights and Access
Effect of dietary black cumin seed (Nigella sativa) on
performance, immune status, and serum metabolites of small ruminants: A meta-analysis
Corresponding author Mr. Agung Irawan E-mail address
[email protected] Journal Small Ruminant Research Article number 106521 Our reference RUMIN_106521 PII S0921-4488(21)00198-X
Order Confirmation
Thank you for taking the time to complete the Rights and Access form.
Order numberOACSRRUMIN1065210Order date4 September 2021
Publishing OptionSubscription Publishing Agreement
● I am one author signing on behalf of all co-authors of the manuscript
● I am signing on behalf of the corresponding author.
○ Name/Job title/Company: Agung Irawan, Lecturer at Universitas Sebelas Maret
○ E-mail address:[email protected]
I may post the accepted manuscript in my institutional repository and make this public after an embargo period. To ensure the sustainability of peer-reviewed research in journal publications, I may not share the final article publicly, for example on ResearchGate or Academia.edu.
Further details onElsevier Sharing Policy here.
Based on information provided the embargo period/end date is 12 months.
Copyright © 2021 Elsevier, except certain content provided by third parties.
Judul Fwd: Rumin-D-21-87 Revision Requested
Dari Sadarman SPt MSc
Kepada: UIN Dewi Febrina SPt MP
Tanggal 10 Nov jam 19.04
--- Forwarded message ---
From: Agung Irawan <[email protected]>
Date: Mon, 19 Apr 2021, 22:14
Subject: Fwd: Rumin-D-21-87 Revision Requested
To: Dr Sadarman Official <sadarman@uin- suska.ac.id>
--- Forwarded message ---
Dari: RUMIN <[email protected]>
Date: Sen, 19 Apr 2021 18.35
Subject: Rumin-D-21-87 Revision Requested To: Agung Irawan <[email protected]>
CC: [email protected] Ms. No. Rumin-D-21-87
Effect of dietary black cumin seed (Nigella sativa) on performance, immune status, and serum metabolites of small ruminants: A meta-analysis Small Ruminant Research
Dear Mr. Irawan,
I can now inform you that the Editorial Board has evaluated your manuscript. The Editor has advised that the manuscript will be reconsidered for publication after major revision.
The comments listed below should be taken into account when revising the manuscript. Along with your revision, you will need to supply a response letter ('Revision Note'), which is a thorough, detailed response to the referees' comments, specifically noting each comment made by the
specifically noting each comment made by the referees and/or Editor, and describing all changes. Should you disagree with any comment(s), please explain why. In case the Associate Editor or a reviewer has supplied a detailed list of small changes please use red type in the text to signal the changes you have made.
Please submit your revision online by logging onto the Editorial Manager for Small Ruminant Research using the following combination:
https://www.editorialmanager.com/rumin/
Your username is: [email protected] If you need to retrieve password details, please go to:
https://www.editorialmanager.com/rumin/l.asp?
i=319304&l=1XM4UIOK
You will find your submission record under the menu item, 'Submissions Needing Revision'.
Please note that this journal offers a new, free service called AudioSlides: brief, webcast-style presentations that are shown next to published articles on ScienceDirect (see also
http://www.elsevier.com/audioslides). If your paper is accepted for publication, you will automatically receive an invitation to create an AudioSlides presentation.
Include interactive data visualizations in your publication and let your readers interact and engage more closely with your research. Follow the instructions here:
https://www.elsevier.com/authors/author- services/data-visualization to find out about available data visualization options and how to include them with your article.
We are looking forward to receiving the revised submission.
With kind regards,
Small Ruminant Research Data in Brief (optional):
We invite you to convert your supplementary data
We invite you to convert your supplementary data (or a part of it) into an additional journal
publication in Data in Brief, a multi-disciplinary open access journal. Data in Brief articles are a fantastic way to describe supplementary data and associated metadata, or full raw datasets
deposited in an external repository, which are otherwise unnoticed. A Data in Brief article (which will be reviewed, formatted, indexed, and given a DOI) will make your data easier to find,
reproduce, and cite.
You can submit to Data in Brief when you upload your revised manuscript. To do so, complete the template and follow the co-submission
instructions found here: www.elsevier.com/dib- template. If your manuscript is accepted, your Data in Brief submission will automatically be transferred to Data in Brief for editorial review and publication.
Please note: an open access Article Publication Charge (APC) is payable by the author or research funder to cover the costs associated with publication in Data in Brief and ensure your data article is immediately and permanently free to access by all. For the current APC see:
www.elsevier.com/journals/data-in-brief/2352- 3409/open-access-journal
Please contact the Data in Brief editorial office at [email protected] or visit the Data in Brief homepage (www.journals.elsevier.com/data-in- brief/) if you have questions or need further information.
Reviewer #1: This paper describes a meta-
analysis regarding the effect of black cumin seeds (BCS) at varying levels on performance
parameters of goats, lambs and sheep.
The authors have drawn conclusions for these three groups together, without examining the animal effect. I suggest adding the animal effect to the models and then defining study as a random effect nested within animal. Interactions between animal and level could also be
considered.
The table summarizing the studies used in the meta-analysis only provides a range of values for
%BCS in DM basis. It is not clear whether
different values of %BCS appeared in more than one study (except for zero, obviously) nor how many different values appeared in each study.
This information should be provided.
L134: Replace a2-hat by beta2-hat.
LL134, 135, 137: Change the subscript of Level from ij to j.
L139 Correct "Statistical models used were …" to
"Statistical models were summarized by …".
Tables 2,3,4:
1. Presenting AIC values without comparison to AIC for competing models (such as quadratic versus linear) is meaningless.
2. Rsquared values should be presented for each model.
3. Using a quadratic model instead of a linear model changes the estimates for beta0 and beta1 in addition to adding an estimate for beta2.
Therefore the results for the quadratic models should show estimates and standard errors for beta0,, beta1 and beta2, together with p-values for beta1 and beta2.
Reviewer #2: I reviewed the manuscript entitled
"Effect of dietary black cumin seed (Nigella sativa) on performance, immune status, and serum
metabolites of small ruminants: A meta-analysis."
This study aimed to quantify the effect of black cumin seeds (BCS) supplementation on the productive performance, nutrient utilization, and blood metabolites profile of small ruminant animals. In general, I found the topic interesting and relevant to Small Ruminant Research Journal. However...
1. Authors suggested that 23 studies were included in the meta-analysis. However, the number of observations used to develop the equations, in my opinion, is too low to conduct a meta-analysis. Considering that animal feeding assays include several animals to test different statistical, I surprised to see that authors, for
statistical, I surprised to see that authors, for example, developed equations with ¡only six and seven data points! (Table 3) and equations with maximum 37 and 39 data points (Table 2). That sounds weird! My suggestion to authors regarding this issue is trying to get the original data of
studies (at least 5 studies) and conduct the meta- analysis with that information. Preferably, explore one species.
2. One fatal flaw of the study in my opinion, is that authors unweighted the studies' observations during the meta-analysis. Authors should consider that they are taking mean observations, and not the original data. According to Sauvant et al., (2008) (a paper cited by the authors):
"observations must be weighed to account for differences in the precision of the reported means." Apparently, authors did not conduct this important step, which will result in flawed
predictions.
3. Another fatal flaw, in my opinion, is that the species' effect cannot simply be considered within the "study effect". As authors explained, they combined information about "lamb", "sheep", and
"goats" in the meta-analysis. Different literature reports suggest that nutrient metabolism differs between these species. Indeed, feeding behavior of sheep and goats is markedly different, and author are exploring "black cumin seeds", a plant seed. Hence, species' effect may influence BCS intake, thereby affecting metabolic response and performance of animals. All these assumptions led to me to think, that species' effect need to be included as an independent effect in the meta- analysis, possibly as random, considering the objective of this study. Another option could be to focus the meta-analysis on only one species.
Other technical issues:
1. English need to be revised. I found many grammar and spelling inconsistencies in several parts of the manuscript.
2. Authors did not provide a table with statistical summary of the dataset used in the meta- analysis.
3. Authors neither mention checks of statistical principle assumptions nor verification of the
principle assumptions nor verification of the presence of influence values or outliers. For example, if the variance is not homogeneous, authors need to use additional statistical tools to overcome this potential limitation (example, variance modelling, Bayesian statistics, etc.).
Otherwise, conclusions of your study may be biased.
Reviewer #3: The manuscript was well written, and the results found are relevant to the scientific community. However, I have a few concerns about some approaches that I pointed out in the specific comments that need to be addressed or at least justified if could not be performed.
110. (4)
128-129. 1) Were the variables weighted for variation in precision across studies?
2) Did the authors test the effect of specie? Or at least check for this possible effect? Goats in general have different metabolism on N recycling and adaptation to the environmental from sheep.
197-206. Did the authors check the effect of concentrate level in the diet x BCS inclusion? Or at least to include concentrate level as a covariate in the model?
Did the authors test some covariate to the model?
If yeas, you need to include this information in the manuscript. If no, it is necessary to check about it.
I mentioned this because it is necessary to "clear"
the effect of BCS inclusion in the diet on the animal performance. How was the average experimental diets composition according to the BCS inclusion? It could be more interesting to verify if there is no effect of some diet
characteristic across BCS inclusion to allow the author to give all the credit to the BCS inclusion effects on the animal performance.
201-206. why the authors did not check the effect of BCS nutritional characteristics on animal performance instead to make assumptions and speculation.
207-209. Please, show a summary of chemical composition of the diets and BCS. Why the
authors did not covariate the model's whit ETHER EXTRACT contends?
EXTRACT contends?
228. Odhaib et al. (2018a) found.
236. Yalcin et al., (2012)
237-241. Confuse. I did not understand the
connection of this discussion with you results. Not only blood metabolites are the indicators of health status, because IgG, IgA, and IgM are indicators of immunity which is also health. What the authors mean with "medicinal plants"? And what the authors say about the Total white blood cells in the discussion?
This section about Health status and immunology response need to be improved by the authors.
_______________________________________
___________
In compliance with data protection regulations, you may request that we remove your personal registration details at any time. (Use the following URL:
https://www.editorialmanager.com/rumin/login.asp
?a=r). Please contact the publication office if you have any questions.
Dear Dr. S.Y. Landau
Editor-in-Chief of Small Ruminant Research,
SUBJECT: Re-submission of revised manuscript (RUMIN-D-21-87-R1)
First of all, we would like to express our gratitude for the second opportunity to revise our manuscript entitled
“Effect of dietary black cumin seed (Nigella sativa) on performance, immune status, and serum metabolites of small ruminants: A meta-analysis’’ for your consideration toward publication in Small Ruminant Research.
We acknowledge the time and efforts by the editor and reviewers in reviewing our manuscript.
We have carefully considered and respond all of the comments from reviewers (attached). We made substantial revision as suggested in the revised manuscript, i.e. we included the interaction effects between concentrate and BCS inclusion and included specific animal intercepts in the models. We also provided graphical representation from the models (Figure 1 and Figure 2) to visualize the results.
With the above we trust we have properly addressed all the weaknesses uncovered by the reviewer. Once again, we are very grateful to the reviewer for their constructive suggestions. We hope that you will finally accept our manuscript for publication.
We are looking forward to receiving your further communications.
Yours sincerely,
Mr. Agung Irawan, on behalf of the co-authors Affiliation: Universitas Sebelas Maret
Jl. Ir. Sutami No. 36A Surakarta 57126, Indonesia
E-mail: [email protected]; Telephone: +6282145376027
Responses to Reviewers for Small Ruminant Research Reviewer #1
We thank the reviewer for the constructive suggestion and evaluation on our manuscript. Herein, we provide our responses point by point as follows:
1. In LL132-139 - please define indices i and a.
Response: We have defined the i and a indices in the paragraph (L133-143).
2. L137: Surely Xi is the level of BCS in study (sample?) i.
Response: Xi is the level of BCS in the study a, we have scrutinized our models and provided in details (L135-143).
3. LL145-146: Interaction between dietary concentrate level and BCS inclusion level is not the issue. If dietary concentrate level has a significant effect in the meta-regression analysis then it should be retained as a covariate in the model.
Response: We have included the interaction effect between concentrate level and BCS level in the model (Table 3, 4, 5).
4. Tables 3, 4 and 5: Estimates of the animal-specific intercepts are missing.
Response: We have added the animal specific intercepts in the Tables 3, 4, 5, especially for those had significant effect and more than 1 study sources. For those came from only one species, it has also been specified in the Table.
5. From the detailed values of BCS in Table 1 it appears that in all the database 40 levels of BCS were 1.2 or less and the remaining 12 values ranged from 5 to 25, half of them for sheep, half for lambs and none for goats. Therefore the goat effect is confounded with a low level of BCS, and models for all three animals together are not valid. As there were only five studies for goats a possible solution is to omit these studies from the meta-analysis. Some graphics of the main outcome variables from Table 3 versus BCS values, with animal identified on the graph, could help to resolve this problem.
Response: We really thank for this suggestion. It really helped us to re-evaluate our data and under present form, it looks clear especially for the effect of animal-BCS interaction on DMI.
We have omitted the goat from the data for the performance parameters as suggested. We have also presented graphical visualisations (see Figure 1 and Figure2), following the methods from St-Pierre (2001) using the residual values for adjustment of the response variables (Y value) (L151-152).
With the above we trust we have properly addressed all the weaknesses uncovered by the reviewer. Once again, we are very grateful to the reviewer for the constructive suggestions
Small Ruminant Research
1. I suggest adding the animal effect to the models and then defining study as a random effect nested within animal. Interactions between animal and level could also be considered.
Response:
Thank you for the advice. We have re-analyzed based on the models proposed by the report reviewers attached to tables 3, 4, and 5. The models used are as follows: The models used are as follows:
(1) Yai=β0+β1Xi+A0a+(A1S0)ai+A3∗Xi+eai (2) Yai=β0+β1Xi+β1Xi2+A0a+
(
A1S0)
ai+A3∗Xi+eaiWhere the first model (1) is linear mixed model form while the second (2) is a quadratic mixed model. Fixed effects components are β0+β1Xi (order 1) and β0+β1Xi+β1Xi2 (order 2), respectively while the random effects are A0a+(A1S0)ai. Yai is the dependent variable, β0 = overall intercept, β1 = slope for level, Xi = level as value of the continuous outcome variable, A0a+
(
A1S0)
ai intercept variying among animal and study within animal, A3∗Xi interaction beetwen animal anad level, and eai = the unexplained residual error.2. 197-206. Did the authors check the effect of concentrate level in the diet x BCS inclusion? Or at least to include concentrate level as a covariate in the model?
3. L134: Replace a2-hat by beta2-hat.
Response:
Thanks to the reviewer's suggestion of improvement. We have replaced a2-hat with beta2-hat on line 134 β0+β1Xi+β1Xi2.
4. LL134, 135, 137: Change the subscript of Level from ij to j.
Response:
We have fixed the subscript from level (X) to ij to j and changed the notation from j to i due to the adjustment of the latest model. The replacement does not change its meaning. As in equation number (1).
5. L139 Correct "Statistical models used were …" to "Statistical models were summarized by
…".
Response:
We have accommodated the reviewer 's direction by correcting the sentence "Statistical models used were…" to "Statistical models were summarized by…" in accordance with the reviewer' s direction.
6. Presenting AIC values without comparison to AIC for competing models (such as quadratic versus linear) is meaningless (Table 2-4)
Response:
Under the direction of our reviewers have changed the statistical measure AIC with R2 which is attached in Table 3, 4, and 5.
7. Rsquared values should be presented for each model.
Response:
R2 of linear and quadratic equations have been added in Table 3, 4, and 5.
8. Using a quadratic model instead of a linear model changes the estimates for beta0 and beta1 in addition to adding an estimate for beta2. Therefore the results for the quadratic models should show estimates and standard errors for beta0,, beta1 and beta2, together with p-values for beta1 and beta2.
Response:
In accordance with the advice of reviewer's. We have improved the coefficient of quadratic equations in Table 3, 4, and 5.
9. Authors did not provide a table with statistical summary of the dataset used in the meta- analysis.
Response:
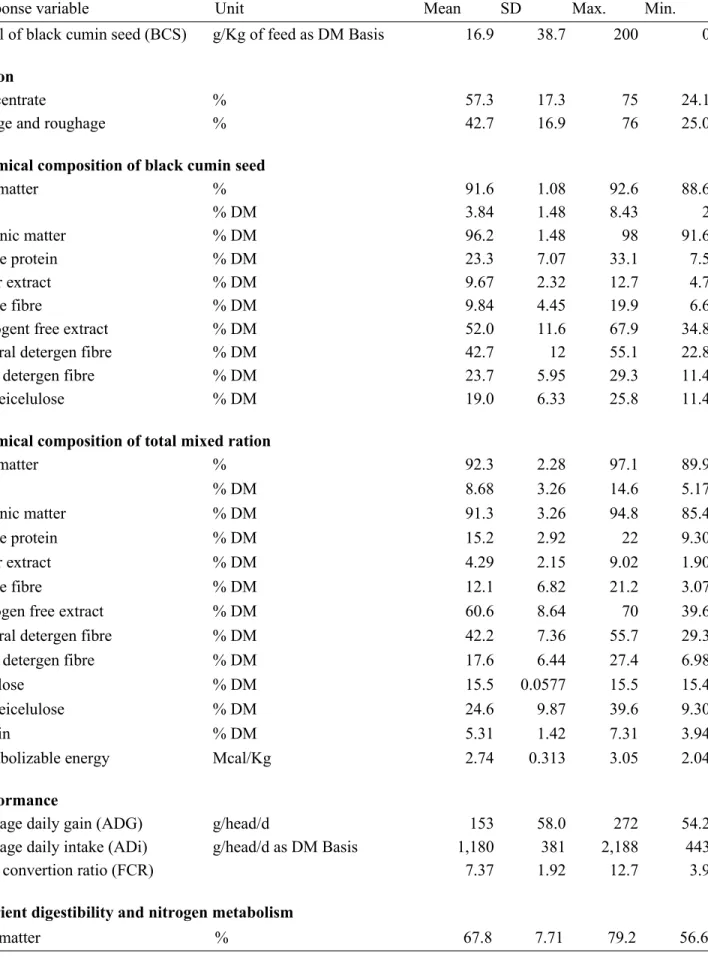
We have added a descriptive statistics table from the database in Table 2.
10. Authors neither mention checks of statistical principle assumptions nor verification of the presence of influence values or outliers. For example, if the variance is not homogeneous, authors need to use additional statistical tools to overcome this potential limitation (example, variance modelling, Bayesian statistics, etc.). Otherwise, conclusions of your study may be biased.
Response:
As guidelines of the reviewer's, we have added Levene's test to find out the homogeneity of the variants. As shown in tables 3, 4, and 5.
11. 207-209. Please, show a summary of chemical composition of the diets and BCS. Why the authors did not covariate the model's whit ETHER EXTRACT contends?
Table 2. Descriptive statistic of the database
Response variable Unit Mean SD Max. Min.
Level of black cumin seed (BCS) g/Kg of feed as DM Basis 16.9 38.7 200 0 Ration
Concentrate % 57.3 17.3 75 24.1
Forage and roughage % 42.7 16.9 76 25.0
Chemical composition of black cumin seed
Dry matter % 91.6 1.08 92.6 88.6
Ash % DM 3.84 1.48 8.43 2
Organic matter % DM 96.2 1.48 98 91.6
Crude protein % DM 23.3 7.07 33.1 7.5
Ether extract % DM 9.67 2.32 12.7 4.7
Crude fibre % DM 9.84 4.45 19.9 6.6
Nitrogent free extract % DM 52.0 11.6 67.9 34.8
Neutral detergen fibre % DM 42.7 12 55.1 22.8
Acid detergen fibre % DM 23.7 5.95 29.3 11.4
Hemeicelulose % DM 19.0 6.33 25.8 11.4
Chemical composition of total mixed ration
Dry matter % 92.3 2.28 97.1 89.9
Ash % DM 8.68 3.26 14.6 5.17
Organic matter % DM 91.3 3.26 94.8 85.4
Crude protein % DM 15.2 2.92 22 9.30
Ether extract % DM 4.29 2.15 9.02 1.90
Crude fibre % DM 12.1 6.82 21.2 3.07
Nitrogen free extract % DM 60.6 8.64 70 39.6
Neutral detergen fibre % DM 42.2 7.36 55.7 29.3
Acid detergen fibre % DM 17.6 6.44 27.4 6.98
Celulose % DM 15.5 0.0577 15.5 15.4
Hemeicelulose % DM 24.6 9.87 39.6 9.30
Lignin % DM 5.31 1.42 7.31 3.94
Metabolizable energy Mcal/Kg 2.74 0.313 3.05 2.04
Performance
Average daily gain (ADG) g/head/d 153 58.0 272 54.2
Average daily intake (ADi) g/head/d as DM Basis 1,180 381 2,188 443
Feed convertion ratio (FCR) 7.37 1.92 12.7 3.9
Nutrient digestibility and nitrogen metabolism
Dry matter % 67.8 7.71 79.2 56.6
Response variable Unit Mean SD Max. Min.
Organic matter % DM 67.0 7.96 80.3 55.8
Crude protein % DM 68.9 7.58 78.1 50.6
Ether extract % DM 65.9 12.2 85.6 39.0
Nitrogen free extract % DM 71.9 7.98 80.1 62.3
Neutral detergent fibre % DM 66.3 6.04 72.8 56.8
Acid detergent fibre % DM 55.1 6.55 60.7 43.8
Nitrogen intake g/d 20.1 7.69 34.2 11.2
Nitrogen in faces g/d 5.52 0.98 6.9 4.18
Nitrogen in urine g/d 5.44 4.17 9.7 0.05
Nitrogen digested g/d 14.8 6.81 27.3 7.8
Nitrogen retention g/d 9.33 5.52 19.5 3
Blood metabolites composition
Albumin g/dL 3.26 0.653 4.85 2.21
Globulin g/dL 3.38 1.46 5.89 0.72
Albumin/globulin ratio g/dL 1.52 1.48 5.55 0.58
Blood urea nitrogen mg/dL 55.5 31.8 111 12.3
Cholesterol mg/dL 98.0 55.5 187 29.5
Total protein g/dL 6.09 1.41 9.85 4.05
Creatinine mg/dL 0.85 0.62 2.83 0.49
Glucose mg/dL 59.0 21.1 82.9 17.7
Triglyceride mg/dL 70.7 48.5 177 12.3
White blood cells (WBC) differentiation
Total white blood cells 1x10³/mm3 8.57 2.19 11.4 4.79
Neutrophile % WBC 51.0 10.6 64.1 36.6
Lymphocyte % WBC 43.4 6.66 52.0 34.4
Monocyte % WBC 4.04 1.77 5.4 1.32
Eosinophile % WBC 1.34 0.49 1.63 0.61
Basophile % WBC 0.54 0.12 0.67 0.43
Imune response
Immunoglobulin A mg/L 446 117 646 269
Immunoglobulin G g/L 36 18.1 66.9 21.3
Immunoglobulin M mg/L 162 8 171 156
SD, Standard deviation; Max., Maximum; Min., Minimum.
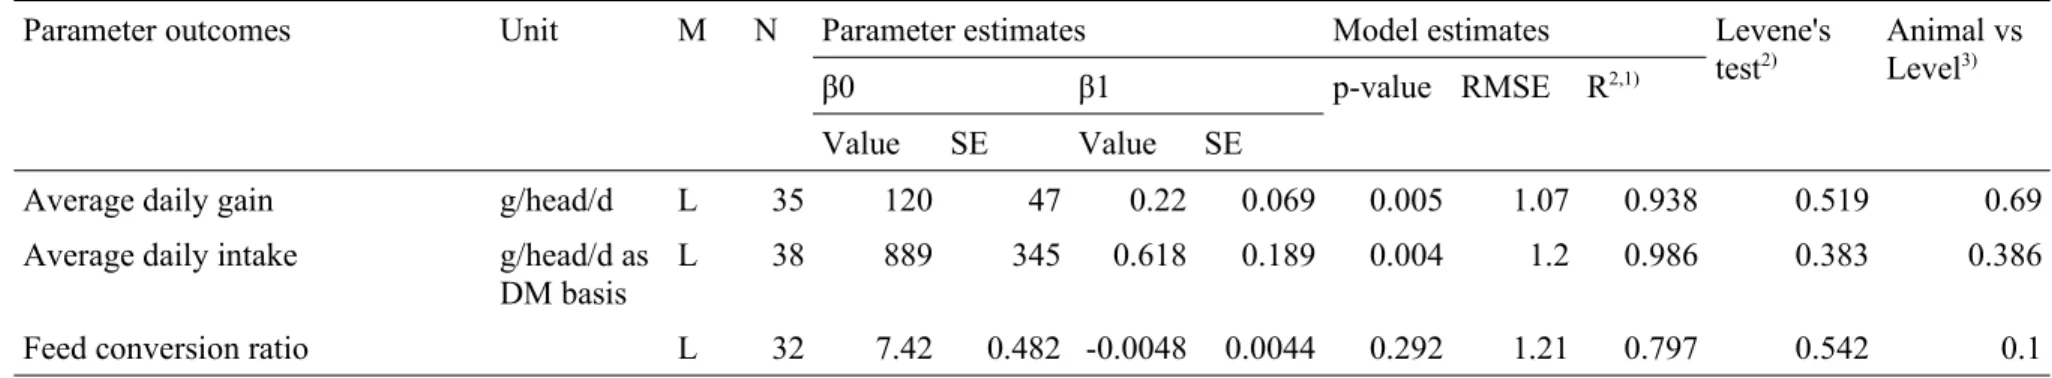
Table 3. Regression equation of the relationship between dietary levels of black cumin seed (g/kg DM) on performance of small ruminant animals
Parameter outcomes Unit M N Parameter estimates Model estimates Levene's
test2)
Animal vs Level3)
β0 β1 p-value RMSE R2,1)
Value SE Value SE
Average daily gain g/head/d L 35 120 47 0.22 0.069 0.005 1.07 0.938 0.519 0.69
Average daily intake g/head/d as DM basis
L 38 889 345 0.618 0.189 0.004 1.2 0.986 0.383 0.386
Feed conversion ratio L 32 7.42 0.482 -0.0048 0.0044 0.292 1.21 0.797 0.542 0.1
DM, Dry matter; L, Linear; M, Model; N, Number of data; SE, Standard error;
1) R2 = The conditional r-squared value of the mixed effects model based on the Nakagawa method;
2) p-value of Levene's test for equality of variances, if p>0.05 the population variances are equal (Fox and Weisberg 2019);
3) p-value of interaction beetwen animal and adition level of black cumin seed.
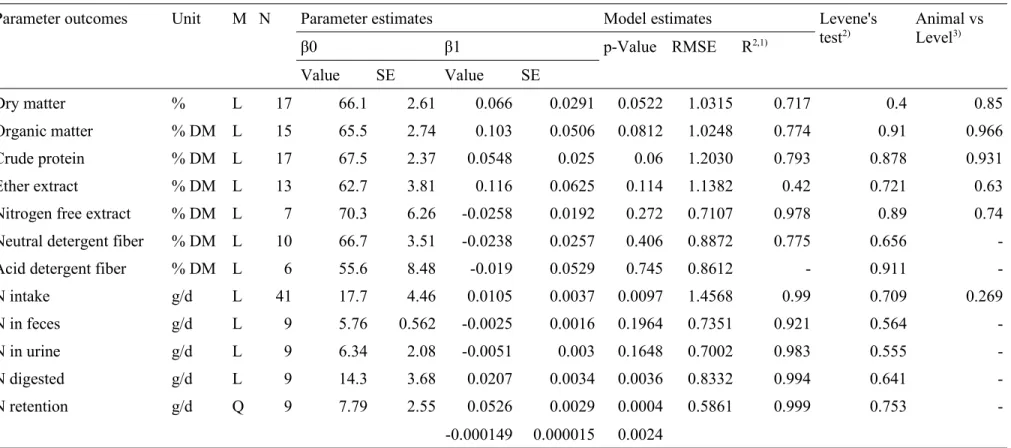
Table 4. Regression equation of the relationship between dietary levels of black cumin seed (g/kg DM) on nutrient digestibility and nitrogen metabolism of small ruminant animals
Parameter outcomes Unit M N Parameter estimates Model estimates Levene's
test2)
Animal vs Level3)
β0 β1 p-Value RMSE R2,1)
Value SE Value SE
Dry matter % L 17 66.1 2.61 0.066 0.0291 0.0522 1.0315 0.717 0.4 0.85
Organic matter % DM L 15 65.5 2.74 0.103 0.0506 0.0812 1.0248 0.774 0.91 0.966
Crude protein % DM L 17 67.5 2.37 0.0548 0.025 0.06 1.2030 0.793 0.878 0.931
Ether extract % DM L 13 62.7 3.81 0.116 0.0625 0.114 1.1382 0.42 0.721 0.63
Nitrogen free extract % DM L 7 70.3 6.26 -0.0258 0.0192 0.272 0.7107 0.978 0.89 0.74
Neutral detergent fiber % DM L 10 66.7 3.51 -0.0238 0.0257 0.406 0.8872 0.775 0.656 -
Acid detergent fiber % DM L 6 55.6 8.48 -0.019 0.0529 0.745 0.8612 - 0.911 -
N intake g/d L 41 17.7 4.46 0.0105 0.0037 0.0097 1.4568 0.99 0.709 0.269
N in feces g/d L 9 5.76 0.562 -0.0025 0.0016 0.1964 0.7351 0.921 0.564 -
N in urine g/d L 9 6.34 2.08 -0.0051 0.003 0.1648 0.7002 0.983 0.555 -
N digested g/d L 9 14.3 3.68 0.0207 0.0034 0.0036 0.8332 0.994 0.641 -
N retention g/d Q 9 7.79 2.55 0.0526 0.0029 0.0004 0.5861 0.999 0.753 -
-0.000149 0.000015 0.0024 L, Linear; M, Model; N, Number of data; Q, Quadratic; SE, Standard error; TDN, total digestible nutrients
1) R2 = The conditional r-squared value of the mixed effects model based on the Nakagawa method;
2) p-value of Levene's test for equality of variances, if p>0.05 the population variances are equal (Fox and Weisberg 2019);
3) p-value of interaction beetwen animal and adition level of black cumin seed.
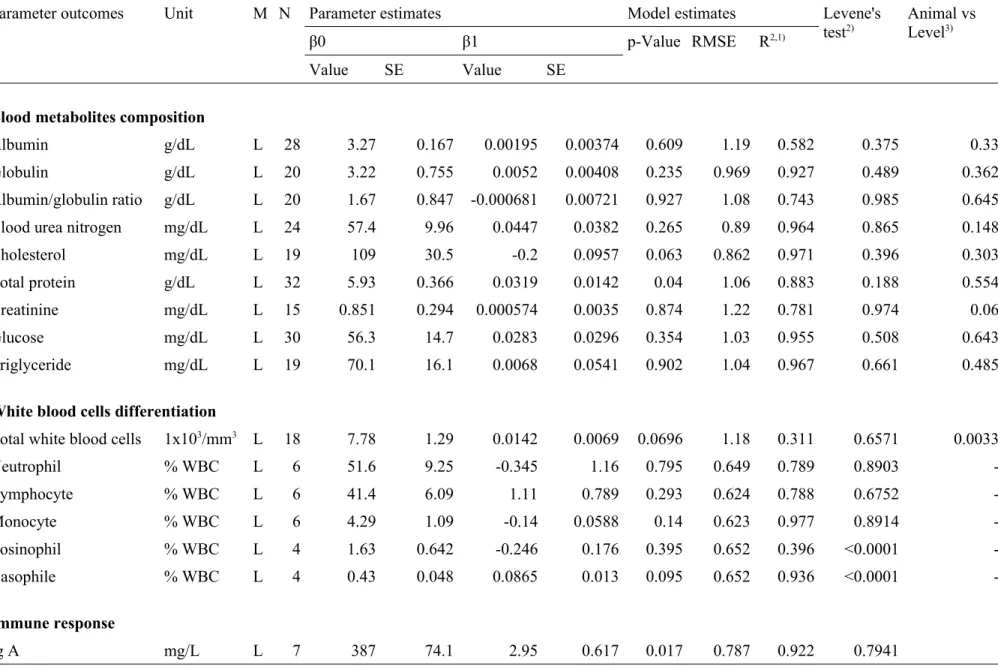
Table 5. Regression equation of the relationship between dietary levels of black cumin seed (g/kg DM) on blood metabolites and immune response of small ruminant animals
Parameter outcomes Unit M N Parameter estimates Model estimates Levene's
test2)
Animal vs Level3)
β0 β1 p-Value RMSE R2,1)
Value SE Value SE
Blood metabolites composition
Albumin g/dL L 28 3.27 0.167 0.00195 0.00374 0.609 1.19 0.582 0.375 0.33
Globulin g/dL L 20 3.22 0.755 0.0052 0.00408 0.235 0.969 0.927 0.489 0.362
Albumin/globulin ratio g/dL L 20 1.67 0.847 -0.000681 0.00721 0.927 1.08 0.743 0.985 0.645
Blood urea nitrogen mg/dL L 24 57.4 9.96 0.0447 0.0382 0.265 0.89 0.964 0.865 0.148
Cholesterol mg/dL L 19 109 30.5 -0.2 0.0957 0.063 0.862 0.971 0.396 0.303
Total protein g/dL L 32 5.93 0.366 0.0319 0.0142 0.04 1.06 0.883 0.188 0.554
Creatinine mg/dL L 15 0.851 0.294 0.000574 0.0035 0.874 1.22 0.781 0.974 0.06
Glucose mg/dL L 30 56.3 14.7 0.0283 0.0296 0.354 1.03 0.955 0.508 0.643
Triglyceride mg/dL L 19 70.1 16.1 0.0068 0.0541 0.902 1.04 0.967 0.661 0.485
White blood cells differentiation
Total white blood cells 1x10³/mm3 L 18 7.78 1.29 0.0142 0.0069 0.0696 1.18 0.311 0.6571 0.0033
Neutrophil % WBC L 6 51.6 9.25 -0.345 1.16 0.795 0.649 0.789 0.8903 -
Lymphocyte % WBC L 6 41.4 6.09 1.11 0.789 0.293 0.624 0.788 0.6752 -
Monocyte % WBC L 6 4.29 1.09 -0.14 0.0588 0.14 0.623 0.977 0.8914 -
Eosinophil % WBC L 4 1.63 0.642 -0.246 0.176 0.395 0.652 0.396 <0.0001 -
Basophile % WBC L 4 0.43 0.048 0.0865 0.013 0.095 0.652 0.936 <0.0001 -
Immune response
Ig A mg/L L 7 387 74.1 2.95 0.617 0.017 0.787 0.922 0.7941
Parameter outcomes Unit M N Parameter estimates Model estimates Levene's test2)
Animal vs Level3)
β0 β1 p-Value RMSE R2,1)
Value SE Value SE
Ig G g/L L 7 28.7 6.32 0.209 0.0242 0.003 0.696 0.981 0.9395
Ig M mg/L L 4 156 1.75 5.47 1.024 0.118 0.652 0.905 <0.001
L, Linear; M, Model; N, Number of data; Q, Quadratic; SE, Standard error;
1) R2 = The conditional r-squared value of the mixed effects model based on the Nakagawa method;
2) p-value of Levene's test for equality of variances, if p>0.05 the population variances are equal (Fox and Weisberg 2019);
3) p-value of interaction beetwen animal and adition level of black cumin seed.
Editor Decision #1 Major revision
Editor Decision #2 Moderate revision
Editor Decision #3 Accepted