INTRODUCTION
MRI Basics
MRI is based on the physical phenomenon that an external magnetic field and an exciting radio frequency (RF) pulse can cause the object to emit signal. The main components of an MRI system include an external static magnetic field in which the object is placed; an RF transmission coil that excites the net magnetization in the transverse plane; magnetic gradients encoding spatial information along different directions; and the RF coils that receive the MRI signal. When an external static magnetic field is applied, the protons in the object begin to precess around the direction of the magnetic field at a constant frequency.
After the net magnetization lies in the transverse plane, another magnetic field, the magnetic field gradient, is applied to distinguish spatial information at one location from another.
Chemical Shift Imaging
Since it is a new excitation and a new echo, the chemical shift in the phase encoding direction does not change from one signal to the next. This implies that the chemical shift artifact has no effect on the signal in the phase encoding direction. Because the spatial information is encoded based on the resonance frequency in the frequency encoding direction, misregistration arises when chemical shift exists.
Where, is the chemical shift measured in ppm, and B0 is the strength of the external static magnetic field.
![Figure 1.1. An example of artifact caused by chemical shift (cited from [4]).](https://thumb-ap.123doks.com/thumbv2/123dok/10742134.0/13.892.194.750.558.841/figure-1-example-artifact-caused-chemical-shift-cited.webp)
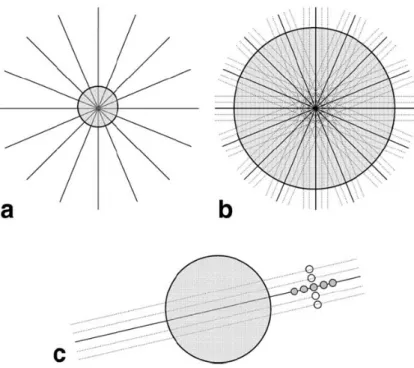
Radial MRI and Its Reconstruction
MRI data on scanners is recorded in k-space, which is the Fourier transform of the image data. In MRI, there are two primary signal domains: the spatial domain and the spatial frequency domain (k-space), which are conjugates of each other using the Fourier transform. Its image space is represented in a Cartesian grid, while its k-space data is arranged in the form of a sinogram.
In the spatial domain it represents a projection filtered by a function whose frequency domain response is , and is therefore called a “filtered projection” [6].
Fat Water Separation
- Two-Point and Three-Point Dixon Methods
As introduced in the previous chapter, fat water splitting is a voxel operation based on knowledge of field inhomogeneity and chemical shift. It processes Cartesian k-space data to generate field inhomogeneity map estimates and fat and water images iteratively. Compared to fat-water separation, the mineral oil phantom, peanut oil phantom results prove the robustness of the separation technique.
In Figure 2.11, the blue curve shows the profile of the reconstructed fat-water image for the peanut oil phantom along its centerline vertically.
METHODS, MATERIALS AND RESULTS
Iterative Least-Squares Estimation Method
Field inhomogeneity is one of the main artifacts of MRI, which noticeably affects the quality of the final reconstruction, such as the tissue interface or object geometry. Reconstruction of the fat-water image cannot be performed until field inhomogeneity is corrected. The critical point in the IDEAL algorithm is the update of the field inhomogeneity map: , which is stored in the second matrix Y .
Estimate the signal from each chemical species using Equation 2.6 and an initial guess for the field map, 0.
Radial Fat Water Imaging Separation
It explains the basic procedures for estimating the field map from Cartesian single-coil data. Although the estimation of different species was also described in the original IDEAL method, the fat-water separation can be improved if the signal is better modeled. Compared to [15], [16] primarily corrects distortion occurring in k-space due to chemical shift, which manifests as larger errors in non-Cartesian readouts.
In k-space, the echo time information is carefully used to refine the signal model compared to that in the original IDEAL method. It shows the relative time delay from a single k-space sampling location where the signal is being sampled to the center of the current echo time.
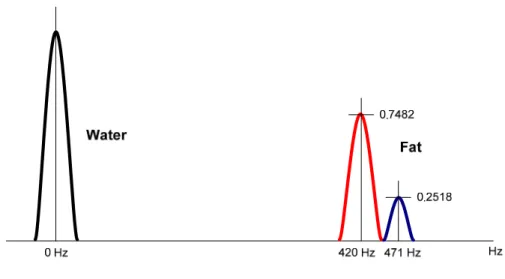
Multipeak Signal Model
In reality, the multipeak resonant frequency is modeled as a weighted summation of delta functions with each centered on one single peak.
Results of Cartesian Fat-Water Separation
- Data Collection
- Separation Results and Analysis
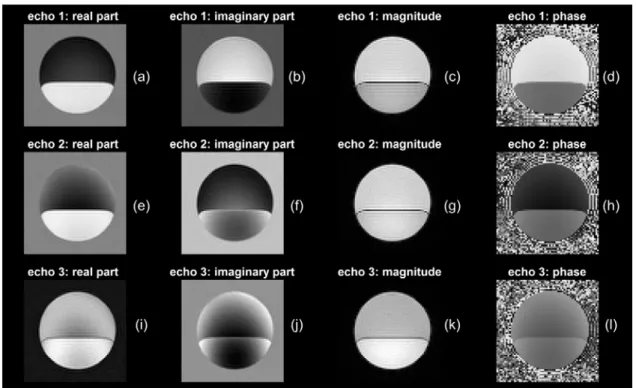
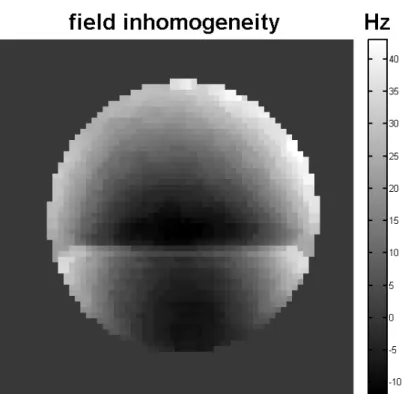
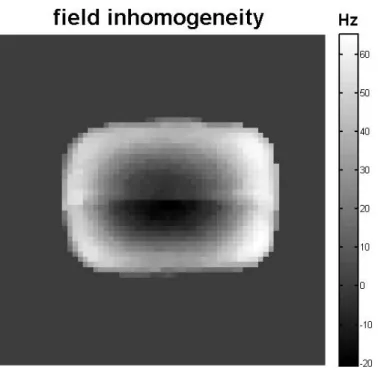
The estimated field inhomogeneity map for the peanut oil phantom also varies smoothly across the FOV. Mineral oil fat-water separation results from a Cartesian acquisition: Panels (a) to (d) are the water signal, the fat signal, the sum of the fat and water signal, and the percentage of the fat signal when there is no k , nmap nor field inhomogeneity correction. correction. Panels (e) to (h) are the water signal, the fat signal, the sum of the fat and water signal, and the percent fat signal when there is k correction, nmap but no field inhomogeneity correction.
Panels (i) to (l) are the water signal, the fat signal, the sum of the fat and water signal, and the percent fat signal when there is no k correction, nmap, but field inhomogeneity correction. Panels (e) to (h) are the water signal, the fat signal, the fat and water signal summation, and the percent fat signal with k correction, nmap por, and field inhomogeneity correction. On the other hand, the fat signal fraction improves from 88.44% to 89.69% due to the field inhomogeneity correction.
A gap caused by chemical shift between fat and water in the mineral oil phantom, shown by the blue dashed curve, is corrected in the red curve in which both the field inhomogeneity and the chemical shift are corrected. The fat-water separation of peanut oil is the result of a Cartesian acquisition: Panel (a) through (d) is the water signal, the fat signal, the sum of the fat and water signal, and the fat signal percentage when there is no k,nmap- correction or field inhomogeneity is correction. Panels (e) to (h) are the water signal, the fat signal, the sum of the fat and water signal, and the fat signal percentage when there is k,nmap correction, but no field inhomogeneity correction.
Panels (e) to (h) are water signal, fat signal, summation of fat and water signal, and fat signal percentage with both k,nmap correction but and field inhomogeneity correction. A gap caused by chemical shift between fat and water in the peanut oil phantom depicted with blue dotted curve is corrected in red curve, where both the field inhomogeneity and the chemical shift are corrected.
Results of Radial Fat-Water Separation
- Data Collection
- Alternating Frequency Encoding Correction
- Separation Results and Analysis
- Reversed Readout Gradient Correction of Field Inhomogeneity….…59
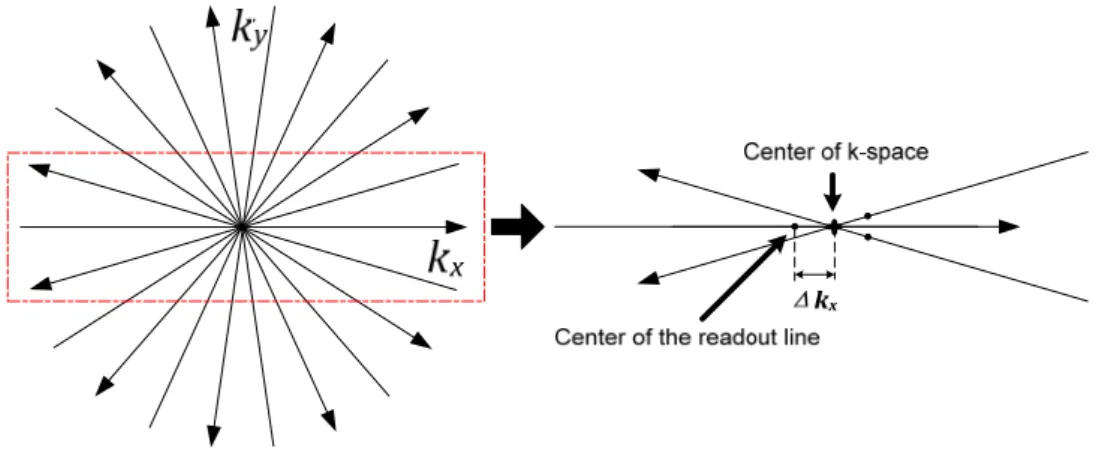
The shift to be corrected is illustrated in Figure 2.12 depicted as kx, and the alternating shift artifact is assumed to occur symmetrically about the center of k-space. 1D projection profile of normalized signal strength of the mineral oil phantom along the center cut across the interface of the fat and water of the object. 1D projection profile of normalized signal strength of the peanut oil phantom along the center cutting across the interface of the fat and water of the object.
In Figure 2.31, when Gxis turns toGx, the real signal shift changes location from x1 to x2. The raw k-space data is acquired with alternating read direction, which causes the k-space frequency encoding lines to not coincide with the k-space center. One of the most challenging parts of radial data splitting is how to accurately estimate field inhomogeneity directly from the raw data.
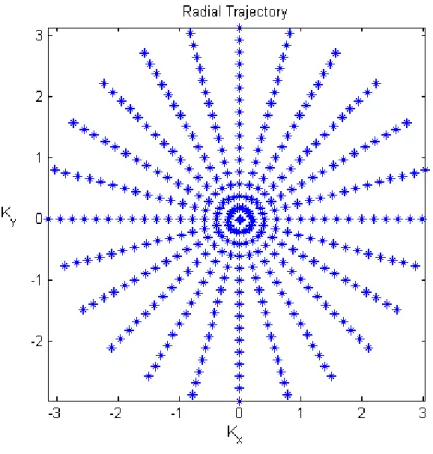
However, the radial data of the full MRI sample needs density correction for its reconstruction due to the oversampled central part of k-space. Thus, even though the radial k-space data is undersampled, the central part of k-space is still able to satisfy the Nyquist criterion. Iterative image reconstruction using a total variation constraint., "Magnetic resonance in medicine : official journal of the Society of Magnetic Resonance in Medicine / Society of Magnetic Resonance in Medicine, vol.
Coshow, "Two-point Dixon technique for water-fat signal decomposition with B0 inhomogeneity correction.," Magnetic resonance in medicine: official journal of the Society of Magnetic Resonance in Medicine / Society of Magnetic Resonance in Medicine, vol. Magnetic Resonance in Medicine : official journal of the Society of Magnetic Resonance in Medicine / Society of Magnetic Resonance in Medicine, vol. McVeigh, "Centering the projection reconstruction trajectory: reducing gradient delay errors.," Magnetic resonance in medicine: official journal of the Society of Magnetic Resonance in Medicine / Society of Magnetic Resonance in Medicine, vol.
IDEAL-GRASE technique.,” Magnetic resonance in medicine: official journal of the Society for Magnetic Resonance in Medicine / Society for Magnetic Resonance in Medicine, Vol.
FUTURE WORK
Future Work
With this sampling scheme, the readout lines are almost evenly distributed across k-space for any number of consecutive projection angles, especially when the number of projections is equal to Fibonacci numbers. For the uniform sampling strategy, the sampling path either does not cover the entire k-space, or the same line is oversampled several times when the number of projections is too small or too large. In [28] it is also shown that in terms of SNR and residual error of the magnetization transfer function, the Golden Ratio-based method and the uniform sampling strategy have very similar performances.
One of its advantages is that its reconstruction will retain most of the image information, even if some of the radial lines are skipped. The Nyquist sampling theorem requires that the sampling frequency be no less than twice the maximum bandwidth of the sampled signal. Filters such as Ram-Lak are often used to weight down the central part of the radial k-space.
Ma, "Dixon techniques for water and fat imaging." Journal of magnetic resonance imaging: JMRI, vol. Fitzpatrick, "A technique for accurate magnetic resonance imaging in the presence of field inhomogeneities." IEEE Transactions on Medical Imaging, vol. Reeder et al., "Multicoil Dixon chemical species separation with an iterative least-squares estimation method ." Magnetic resonance in medicine: official journal of the Society of Magnetic Resonance in Medicine / Society of Magnetic Resonance in Medicine, vol.
Reykowski, "GRAPPA operator for wider radial bands (GROWL) with optimally adjusted self-calibration.," Magnetic resonance in medicine : official journal of the Society of Magnetic Resonance in Medicine / Society of Magnetic Resonance in Medicine, vol. Sodickson, "Parallel-beam adaptive magnetic resonance imaging in k-space (PARS): constrained image reconstruction using k-space locality in radiofrequency coil-encoded data.,".