RE-LAYOUT WAREHOUSE FOR NEW PROCESS AREA AT STAMPING PLANT PT. ASDFM CAR
MANUFACTURER, JAKARTA
By James Tedy ID No. 004201300025
A Thesis presented to the Faculty of Engineering
President University in partial fulfilment of the requirements of Bachelor Degree in Engineering Major in Industrial Engineering
2017
THESIS ADVISOR
RECOMMENDATION LETTER
This thesis entitled “Re-Layout Warehouse for New Process Area at Stamping Plant PT. ASDFM Car Manufacturer, Jakarta”
prepared and submitted by James Tedy in partial fulfillment of the requirements for the degree of Bachelor Degree in the Faculty of Engineering has been reviewed and found to have satisfied the requirements for a thesis fit to be examined. I therefore recommend this thesis for Oral Defense.
Cikarang, Indonesia, January 31
th, 2017
Anastasia Lidya Maukar, ST.,MSc., M.MT.
DECLARATION OF ORIGINALITY
I declare that this thesis, entitled “Re-Layout Warehouse for New Process Area at Stamping Plant PT. ASDFM Car Manufacturer, Jakarta” is, to the best of my knowledge and belief, an original piece of work that has not been submitted, either in whole or in part, to another university to obtain a degree.
Cikarang, Indonesia, January 31
th, 2017
James Tedy
RE-LAYOUT WAREHOUSE FOR NEW PROCESS AREA AT STAMPING PLANT PT. ASDFM CAR
MANUFACTURER, JAKARTA
By James Tedy ID No. 004201300025
Approved by
Anastasia L. Maukar, ST., MSc. MMT. Burhan Primanintyo, S.T., M.Eng.
Thesis Advisor 1 Thesis Advisor 2
Ir. Andira M.T.
Program Head of Industrial Engineering
ABSTRACT
Warehouse is one of the facility in a manufacturing plant and used to stored goods or work in process products. The call for efficiency in warehouse layout is increasing as the competitiveness took into this section. As the time changes, the demand for products is changing, too. So, in a case study of PT. ASDFM, one of car manufacturer in Jakarta who encountered changes in forecasted demand tried to change the layout to fit it. The main problem for creating a layout is to fit all the storage demand and several processes included with it, while prioritizing safety.
Aside from that, changes also should bring an efficient result compared to current layout in terms of material handling. The method used to identify the needs for warehouse is using warehouse activity profiling and analyzing the current layout weaknesses as the basis for creating layout. The result is a new layout that can accommodate future demand with safety of forklifts and operator highly prioritized and material handling distance further. The most significant changes seen in material handling efficiency from storage to Jundate area in forklift travelling distance that can be reduced from 10096.9m to 4039.71m or by 60%.
Keywords: Warehouse, Layout, Warehouse Activity Profiling, Item Popularity Distribution, Activity Relationship
ACKNOWLEDGEMENT
This thesis couldn’t be done without the help and support from everyone around me, therefore I would like to express my gratitude to:
1. Jesus Christ, the source of everything. Thank you for unconditional love, wisdom, and endless support that You have given to me through people around me.
2. Both of my Thesis Advisors, Anastasia L. Maukar and Burhan Primanintyo.
Thank you for all the support and help that you provide me through the advice and recommendation throughout the thesis creation progress. This thesis could be done without both of you.
3. My family, my father Anton Tedysukianto, my mother Rossy Sukerdy, and my sister Beatrix Tedy who always supported and help me in time of needs.
This thesis may not have finished on time without them reminding me and supporting me.
4. My friends in shared house, Erwin, Yandhika, and Yosafat who are always supporting and helping me when I was confused. My friends and classmates, Felicia, Ade, Jennifer, Novita, Desire Natalia, Jefferzon, and Natalia, they always remind and motivate me to do my thesis well, too.
5. All of my Industrial Engineering classmates and lecturers who always there for me and help me during my study in President University.
6. All of the PUSC 2014 and 2015 members, especially Commission II in PUSC 2014. I am glad to be part of it, because of you guys I could develop myself better in these 3 years and learn and share amazing experiences that always be part of me. Thank you very much.
7. Thank you to my partner Felicia Putri, who inspired me and motivated me to have a vision for future and strive for it.
8. Thank you to PuCatSo family for creating my life to be more colorful and filled with happiness whenever I need it especially for Becil, Bertus, Deri, Merici, Erwin, Jona, Toge, Rana, Yosa, Kona, KBG, Tia, Beti, and Yandhika.
Others party that cannot be mentioned one by one. Thank you for everything
TABLE OF CONTENTS
ABSTRACT ... iv
ACKNOWLEDGEMENT ... v
TABLE OF CONTENTS ... vi
LIST OF TABLES ... ix
LIST OF FIGURES ... x
LIST OF TERMINOLOGIES ... xii
CHAPTER I INTRODUCTION ... 1
1.1 Problem Background ... 1
1.2 Problem Statement ... 2
1.3 Objectives ... 3
1.4 Scopes ... 3
1.5 Assumption ... 3
1.6 Research Outline ... 3
CHAPTER II LITERATURE STUDY ... 5
2.1 Warehouse ... 5
2.2 Warehouse Management System ... 6
2.3 Flow Chart ... 7
2.4 Material Handling ... 8
2.5 Warehouse Activity Profiling ... 9
2.6 Order Mix Distribution ... 10
2.7 Family Mix Distribution ... 10
2.8 Handling Unit Distribution ... 10
2.9 Item Activity Profile... 11
2.9.1 Item Popularity Distribution ... 11
2.10 Activity Relationship Profile ... 12
2.10.1 Activity Relationship Chart ... 12
2.10.2 Dimensionless Block Diagram ... 14
CHAPTER III RESEARCH METHODOLOGY ... 16
3.1 Research Methodology ... 16
3.1.1 Initial Observation ... 17
3.1.2 Problem Identification ... 17
3.1.3 Literature Study ... 18
3.1.4 Data Collection & Analysis ... 18
3.1.5 Conclusion ... 20
3.2 Research Framework ... 22
CHAPTER IV DATA COLLECTION AND ANALYSIS ... 24
4.1 Current Condition ... 24
4.1.1 Pallet of Body Part ... 24
4.1.2 Vertical Pallet Stacking ... 24
4.1.3 Demand Forecast ... 26
4.2 Current Layout ... 31
4.3 Current Warehouse Space Allocation ... 32
4.4 Current Process Flow ... 34
4.5 Traffic Decision Making ... 39
4.6 Summary of Current Condition ... 39
4.7 Warehouse Activity Profiling ... 41
4.7.1 Customer Order Profile... 41
4.7.2 Item Activity Profile ... 43
4.7.3 Activity Relationship Profile ... 53
4.8 Summary of Proposed Improvements ... 56
4.9 New Warehouse Layout ... 57
4.9.1 Aisle ... 59
4.9.2 New Location and Flow ... 61
4.9.3 New Jundate Area... 65
4.9.4 New Storage Area... 69
4.9.5 New Traffic ... 74
4.9.6 New Repair Area ... 74
4.10 Travel Distance Result ... 79
CHAPTER V CONCLUSION AND RECOMMENDATION ... 86
5.1 Conclusion ... 86
5.2 Recommendation ... 86
REFERENCES ... 87
APPENDIX I DEMAND FORECAST ... 89
APPENDIX II PALLET SPECIFICATION ... 105
APPENDIX III CURRENT LAYOUT OF THE WAREHOUSE ... 115
APPENDIX IV NEW LAYOUT ... 116
APPENDIX V CURRENT STORAGE ... 117
APPENDIX VI NEW STORAGE ... 118
APPENDIX VII CURRENT JUNDATE ... 119
APPENDIX VIII NEW JUNDATE ... 120
APPENDIX IX TRAVEL DISTANCE COMPARISON BETWEEN CURRENT AND NEW LAYOUT FROM WAREHOUSE TO SETTING ... 121
APPENDIX X CURRENT LOCATION AND NEW LOCATION OF BODY PARTS ... 126
Comment [AM1]: `1.1. Problem
\Background 1.2…….. 1.3……. 2.1……..
etc
LIST OF TABLES
Table 4.1 Pallet Specification ... 25
Table 4.2 Demand Forecast for Parts of D40D, D22D, and D14D ... 26
Table 4.2 Demand Forecast for Parts of D40D, D22D, and D14D (continued) ... 27
Table 4.3 Demand Forecast with Safety Stock ... 28
Table 4.4 Current Area 2A and 2B Usage ... 33
Table 4.5 Warehouse Activity Area Allocation ... 33
Table 4.6 Traffic Type and Its Benefit ... 39
Table 4.7 Analysis of Current Condition ... 40
Table 4.8 Data for Popularity Distribution ... 44
Table 4.9 Number Order of Job D40D ... 48
Table 4.10 Number Order of Job D22D ... 51
Table 4.11 Number Order of Job D17D ... 53
Table 4.12 Area Used for Each Activity ... 56
Table 4.13 Improvement for New Layout... 57
Table 4.14 Dimension of Forklifts and Pallets ... 60
Table 4.15 Current Location and New Location of Body Parts ... 73
Table 4.16 The Location and Distance Code for Body Parts Location ... 73
Table 4.17 Travel Distance Comparison between Current and Proposed Layout from Production to Warehouse ... 80
Table 4.18 Travel Distance Comparison between Current and After from Warehouse to Setting ... 81
LIST OF FIGURES
Figure 2.1 Example of Flowchart Shapes ... 8
Figure 2.2 Example of Item Popularity Distribution ... 12
Figure 2.3 Example of Activity Relationship Chart ... 13
Figure 2.4 Example of Dimensionless Block Diagram ... 15
Figure 3.1 Research Methodology Flowchart ... 16
Figure 3.2 Flow of Research ... 21
Figure 4.1 Vertical Pallet Stacking ... 25
Figure 4.2 Current Layout of Warehouse ... 31
Figure 4.3 Business Process in the Plant... 36
Figure 4.4 Current Material Flow from Stamping to Storage in A and B ... 37
Figure 4.5 Current Material Flow from Storage A and B to Jundate ... 38
Figure 4.6 New Layout of Jundate Area ... 42
Figure 4.7 Car Type Popularity Distribution ... 45
Figure 4.8 D40D Parts Popularity Distribution ... 46
Figure 4.9 D22D Parts Popularity Distribution ... 50
Figure 4.10 D17D Parts Popularity Distribution ... 52
Figure 4.11 Activity Relationship Chart for Warehouse ... 54
Figure 4.12 Dimensionless Block Diagram for Warehouse ... 55
Figure 4.13 New Layout for Warehouse ... 58
Figure 4.14 Current Layout ... 58
Figure 4.15 Forklifts ... 59
Figure 4.16 Forklift and Pallet Max Dimension ... 60
Figure 4.17 Flowchart of Location Decision Making... 62
Figure 4.18 New Layout and Flow for Warehouse ... 64
Figure 4.19 Current Layout with Flow ... 64
Figure 4.20 Flowchart for Jundate Area Decision Making ... 67
Figure 4.21 New Jundate Area Layout ... 67
Figure 4.22 Current Jundate Layout ... 68
Figure 4.23 Flowchart for Storage Area Decision Making ... 70
Figure 4.24 New Storing Area Layout ... 71
Figure 4.25 Current Storage Layout ... 72
Figure 4.26 New Traffic in New Layout... 74
Figure 4.27 Flowchart of Repair Area Decision Making... 76
Figure 4.28 New Repair Area Layout ... 77
Figure 4.29 Current Repair Area ... 78
Figure 4.30 Comparison between Forklift Travel Distance in Current and New Layout for Stamping to Storage on Average ... 82
Figure 4.31 Comparison of Distance between Stamping to Storing for Body Parts (Current and Proposed Layout) ... 83
Figure 4.32 Comparison between Forklift Travel Distance in Current and New Layout for Storage to Jundate on Average ... 84
Figure 4.33 Comparison of Distance between Storing to Jundate for Body Parts (Current and Proposed Layout) ... 85
LIST OF TERMINOLOGIES
Jundate : Setting area, to arrange the product in order of the assembling process in the next factory
Daisha : a trolley to move pallet or parts, one of the material handling equipment in the plant.
Pallet : is a transport equipment to ease forklifts lift the goods without breaking it
Dies : is a tool to cut material into a shaped product, its function is similar with mold where it had customized shape to fit it products.
CHAPTER I INTRODUCTION
1.1 Problem Background
Warehouse has become one of the important aspect to be considered to win the competitive global marketplace these days. The function of warehouse is to store goods and as the distribution center of goods also affecting the supply chain of a company. Therefore, a lot of company is competing in creating the best warehouse that can give a maximum effectiveness and maximum efficiency for a limited space provided. For that, there has been identified three factors that is contributing to the effectiveness and efficiency of a warehouse and they are simplicity/complexity of the warehouse management systems, product slotting techniques, and warehouse layout (AGDP & WADN, 2011).
The ability of a company to fully develop an effective and efficient warehouse is proven to be critical to the success and can be seen happened in several global companies across the world. The example of how important a warehouse can be seen in one of the biggest nation the United States of America where they altered warehouse into a great extent in to keep up with the changes in raw materials, intermediate goods, and finished products (John & Bowen, n.d.).
PT. ASDFM is an automotive company which manufactures and assembles car in Indonesia. It is known that it is the only company which has the right to do it. PT.
ASDFM owns several Plants Namely Stamping Plant, Casting Plant, Engine Plant, and Assembly Plant. Most of the Plants are located in Jakarta. Stamping Plant is also known as Plant 1, is used for creating parts of car body by stamping a sheet to shape like the body of cars.
As time goes by, there will be some improvement in the company in order to provide new products that meet customers’ demand. In order to create a new product, new machine and process will be added to the factory. Therefore, empty spaces needed to place the new machine and process. However, the availability of space is limited and it has been employed for current factory and there are no empty spaces left to place the new machines. To get some spaces in a factory area, the company order the management to move one of the area in Assembly Plant to Stamping Plant. So, there is an upcoming project where the stamping plant will add a new process to their area.
In the current condition, the stamping plant area is already used fully by departments in Stamping plant. In order to add a new process to the area, the Logistic Department needs to give a part of its warehouse to be used for the new process. The current warehouse including the area with repair and jundate process is an area of 8295.49m2, the new process will be used part of this area about 2448.83m2 leaving the area that can be used by the Inventory Finish Part division an area of 5846.66m2 that should be consisted of areas of repair, storage, and jundate area.
Then, it is needed be to re-layout the remaining warehouse to accommodate the future demands for the stamping plant. While doing the re-layout, management considers of reducing the inefficient material handling cost especially the transportation cost. Thus, the re-layout purpose focuses on fitting the future demand to current space availability and creating a high efficiency material handling process.
1.2 Problem Statement
The background of the problem leads to make the statements below:
• How does the management create the layout for the warehouse that fit the future demand?
1.3 Objectives
The objectives of this research are:
• To create the best warehouse layout to accommodate future demand
1.4 Scopes
Due to limited time and resources in doing this research, therefore it will be limited to this scope:
• The re-layout only affecting some areas related to Inventory Finished Part division.
1.5 Assumption
The assumption defined used for simplify the problem and help the research are as follows:
1. The forecasted demand given from the company 2. The material handling equipment will be fixed 3. The building’s construction will remain the same
4. Some area will not be moved according to the company request 5. The car types will not change over in 3 years ahead
6. Space availability is fixed
1.6 Research Outline
Chapter I Introduction
This chapter consists of the problem background of final project, problem statement, objective, scope, and assumption of this study
Chapter II Literature Study
This chapter delivers the study about warehousing aspects such as warehouse activity profiling, popularity distribution, activity relationship, FIFO and other method that related to the creation of warehouse layout.
Chapter III Research Methodology
The flow of this research is explained in this chapter. The first step to take is to conduct observation for the warehouse and can be done by touring and survey. The second step is to identify the problem from the survey and data provided. Then the method for solving the problem will be determined. After that the research continue by using the method referred in the literature study and analyze the warehouse needs to create a more efficient and effective warehouse for the new layout. After generating the new layout, the result will be compared with the current layout.
Chapter IV Data Analysis
In this chapter the data obtained from the staff and survey in the field will be processed and analyzed. The first thing is to assess the current condition of the warehouse and identify the weaknesses of current warehouse to improve.
After that creating a warehouse activity profiling to identify the needs of the warehouse especially in Inventory Finished Parts division. Then all the assessment will be the basis on creating the new layout for warehouse.
Chapter V Conclusion and Recommendation
This chapter will give the conclusion result of this research and also recommendation for future research.
CHAPTER II LITERATURE STUDY
2.1 Warehouse
Warehouse is one of the facility usually owned by a certain company that worked in industry such as manufacturing, import and export, wholesale, etc. It is usually a large building located in industrial area, city, or villages. Warehouse itself is a part of supply chain in which aside from being a storage of goods, it will reduce the transportation cost and can be used to add value to the products (JJ & ST, 2006). There are also several additional benefits that warehouse can offer such as shortening response time to the customer and connecting manufacturing with the end consumers with good coordination.
There are several types of warehouses that can be found in the world: they are raw material and component warehouses, work-in-process warehouses, finished goods warehouses, distribution warehouses or distribution centers, Fulfillment warehouses or fulfillment centers, local warehouses, and value-added service warehouses. Raw material and component warehouses usually functioned to receive raw material and hold it for a duration of time until it will be used for the production and usually near the point of induction with manufacturing or assembling process. Work-in-process warehouses purpose to hold the partially completed products before it will be continued and completed. These warehouses usually located in various location near the manufacturing or assembling point line. Finished goods warehouses is used to store finished products and used to balance and buffer the variation between production schedule and demand. This warehouses usually located near the manufacturing or assembling process and characterized by its flow of pallets in and out.
Distribution warehouses or distribution centers used to accumulate all the finished products and consolidate products from various manufacturing within one
company for combined shipment to the customer. This kind of warehouses usually located between the manufacturing plant and the customer area and this warehouses sometimes located near several customer areas in order to reduce the transportation cost and reduce the number of warehouse built. Fulfillment warehouses or fulfillment center is a place for small orders to be picked by the customers usually located in the city, town, or villages to ease the access for customer. Local warehouses are used to shorten the response time to customer and enhance the delivery times to the customer and create a rapid response to the customer. Value-added service warehouses are used to give additional value to the end product such as customize packaging, labeling, marking, pricing, and returns processing.
2.2 Warehouse Management System
There are three main techniques of warehouse management, namely FIFO, FEFO, and LIFO.
2.2.1 FIFO
FIFO is one of the main techniques of warehouse management and it is one of the common techniques that used by most of the companies’ warehouse especially for the goods which has expiring date. FIFO technique implies that the stored goods which brought in to the warehouse first will be leaving first (James A. Tompkins
& Smith, 1998). One of the common usage is can be seen in the food warehouse.
In order to create a first in first out in the storage, several conditions need to be supporting the techniques such as the storage system which help the techniques to be achieved such as additional equipment like conveyor, roller, rack, etc. This additional equipment will ensure the FIFO to run well in the storage area.
2.2.2 LIFO
LIFO is another technique in warehouse management which recommend for the goods which comes last to come out the first. This is the opposite of FIFO in which it takes the first brought in item out and rarely applied in the food industry (James A. Tompkins & Smith, 1998). LIFO techniques is very possible to be used
Comment [AM2]: No indentation for sub chapter. Please revise the format
in a non-food industry such as garment, chemical specific grain, etc. the equipment that is used in this technique is a rack that can be pushed in to store a new product in the rack and after the front goods is taken, the goods in the back will be moved into front.
2.2.3 FEFO
FEFO is other techniques in warehouse management that the concept is quite similar with FIFO, but the different is FEFO is about the expiration date while FIFO is about the production date or date in which it entered the warehouse. First product to be expired will be put into priority in leaving the warehouse queue.
FIFO and FEFO techniques is very similar between one another because both of them are applied to a similar kind of products that have expiration date. The only difference between them is when a stock set which is manufactured in a different date with another stock set and move into warehouse first. That scenario is a very rare to happened and hence these two techniques is almost same one another. Both of them is the best method for warehouse management especially for a FMCG (Fast Moving Consumer Goods) business.
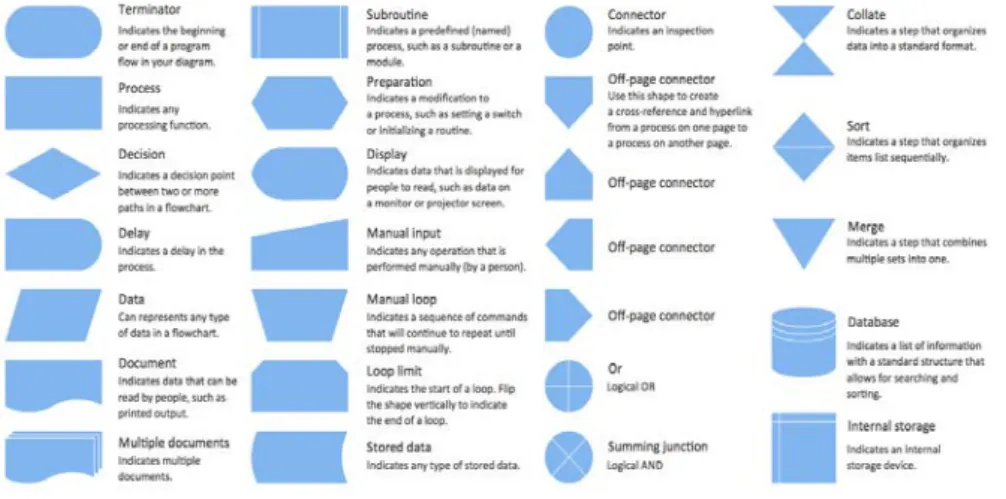
2.3 Flow Chart
Flow chart is a diagram that is visualize the process of an activity or an algorithm of specific works. It is explaining the step-by-step process of an operation. Flow charts can be used in various ways including analyzing, designing, documenting, and managing activities in various fields. Flow charts visualized by shapes and each shape has their different own meanings.
Source: conceptdraw.com
Figure 2.1 Example of Flowchart Shapes
Figure 2.1 above is the shapes that commonly used in flowchart. The most common and simple flowchart to resolve a problem can used shapes such as Terminator to start or end a program, Process to explain any processing function, and Decision to indicates a decision problem that is linked to two or more process.
2.4 Material Handling
Material handling is the short-distance movement of products or materials within a building for example plant, warehouse, storage, etc (Coyle, 1992). This activity consists of several activities such as loading, unloading, palletizing, and de- palletizing the product or materials. It is also supported by a wide range of equipment such as manual equipment, semi-automated equipment, and fully automatic equipment. Material handling not only consider the transportation of goods but also consider the protection, storage, and control of the materials throughout the process in their industry.
Material handling is important in the company and may benefit the company in some aspect such as customer service, inventory, delivery time, and handling cost especially in manufacturing goods, distributing the goods, and transporting the goods. It improves efficiency by making the logistics system within the company
respond effectively and quickly. Material handling is important to both outbound and inbound logistics. There are four dimension that material handling will be mostly about is movement of goods, time it takes to move the goods, quantity of the goods it can be move, and the space required to do such action.
2.5 Warehouse Activity Profiling
Warehouse Activity Profiling is a systematic analysis of the warehouse function.
The activity profiling process is designed to identify the root causes of flow problems for material and information flow, pinpointing opportunities to improve the process in the warehouse, and to provide a clear note in which area the warehouse should be improved. The profiling includes all the related aspect of warehouse such as customer, purchase order, item activity profile, calendar-clock profile, activity relationship profile, inventory profile, and investment profile.
These profiles will help the owner of the warehouse to fully understand the need of its warehouse.
Material and information flow throughout the entire warehouse to facilitate the needs of its customer and customer order profile is needed to find the needs of warehouse’s customer. Purchase order profile is quite similar with the customer order profile except the purchase order profile concerning about inbound activities in warehouse, while customer order profile concerns about outbound activity in warehouse. Item activity profiling is used to decide how to store each item, the space it should be allocated for the item, and the location for the item to be placed.
Inventory profile is used to identify the source of inventory problem in the warehouse and it can help people to determine which goods should be provided more space in the warehouse, because there are a lot of problems in warehouse industry regarding the space that is lacking.
Calendar-Clock Profile is used to identify the seasonality of an item. Buying pattern of customer can be seen through the bar chart of sales, and from that it could be known which kind of item would be in the highest demand for that month; from that the warehouse, can determine what kind of material handling
will be used and scheduling programs can be designed. Activity relationship profile used to identify the whole process activity in the warehouse and designed them to create a warehouse that have minimum transportation cost because the room or process is adjacent one another. The last profile is investment profile, this profile is used to indicate the cost and operating parameters necessary to make design and investment decisions (Frazelle, 2002).
2.6 Order Mix Distribution
Order mix distribution is helpful in plotting warehouse operating strategy with its three most helpful mix distribution technique. Order mix distribution help the warehouse creator to decide how their item should be zoned whether it should be zoned according to the velocity of the items coming to warehouse until leaving the warehouse. Zoning according to velocity of the item will have order consolidation impacts that should be considered. Aside from that order mix profiles are used to analyze the order lines for the item, either it should be grouped as a full cartons, broken cartons, or combination of both. The objective is to determine the customer percentage that ordering a full cartoon of the products and those who didn’t.
2.7 Family Mix Distribution
Family mix distribution is one of the techniques in order mix distributions in deciding the zoning for storing the product. Family mix distribution is used to analyze the information gathered from the customers ‘orders if the order is pure from one of the product family or is it the mix of several products. Zoning the warehouse base on the customer order related to the family of items will be a basis that will create a warehouse and will lead to a good productivity and customer service if most of the orders is completed using only one of family of items.
2.8 Handling Unit Distribution
There are two kind of distribution in Handling unit distribution those are full/partial pallet mix distribution and full/broken case mix distribution.
Full/partial pallet mix distribution is concerned about the need to separate areas for pallet picking and case picking. Pallet and case picking use if the customer order is a mix of several families. Both full/partial and full/broken case mix distribution is all about the needs to prepare a special cargo holder for a partial order.
2.9 Item Activity Profile
Item activity profile is used to slot the warehouse and decide which item storage area should be located in and how big is the area should be allocated to the item.
There are 6 distributions related to item activity profile and those are popularity distribution, cube-movement/volume distribution, popularity-volume distribution, order completion distribution, demand correlation distribution, and demand variability distribution.
2.9.1 Item Popularity Distribution
Item popularity distribution is used to identify the portion of items in the warehouse that generate the most picking activity. Popularity distribution is quite similar with ABC curve and Pareto chart. In popularity distribution chart, it indicates the percent of items associated with the percent of picks generated by each item (Mallick & Gaudreau, 1951).
Source: shelfplus.com retrieved in January 2017
Figure 2.2 Example of Item Popularity Distribution
Figure 2.2 above is one of the example of item popularity distribution mentioned before. This figure 2.2 above is indicating the 5 percent of the Stock Keeping Units (SKU) in the warehouse is generating 20 percent of total picking activity in the warehouse and 30% of the most popular item in the warehouse is generating 95% of total picking activity in the warehouse.
2.10 Activity Relationship Profile
Activity relationship profile show the connection between each activity in the warehouse. This profile can be used to recommend the location of each process area on the basis of the functional and process relationship between the activity.
For example, activity A is important to be located adjacent to activity C because C is the next process after activity A. There are a lot of way to profile the relationship between activities in the warehouse and several of those techniques are discussed in next sub chapters.
2.10.1 Activity Relationship Chart
Activity relationship chart is one of the techniques to prove the relationship between activities and prove the importance of the location for each activity to be adjacent to the other (Heragu, 2008). Activity relationship chart is using 2 indicators as the assessment method. The first is the importance level and the second is the relation between the two activities.
Source: slideplayer.com retrieved in January, 2017 Figure 2.3 Example of Activity Relationship Chart
Figure 2.3 above is the example of activity relationship chart and its legend. On the left side of the chart, there are several activity or department or area that will be plotted in the layout and to the right of them there is the relationship between the two of area. In the relationship box, there are 2 things explained which are first the top is the importance of relationship represented in symbols and the second is the reason for the importance of the relationship in numeric code.
The rating symbol for importance of relationship is marked from A until X. “A”
stands for Absolutely necessary, E for Especially important, I for Important and
core, O for Ordinary, U for Unimportant, and X for Undesirable to be close (Groover, 2007). The numeric code is used to explained the relationship between two activities. In the Figure 2.3 above the numeric code is about the frequency and information flow, but most of the times when activity relationship chart used in a plant or factory the relationship commonly explained with same tables, flow of material, service, convenience, inventory control, communication, same personal, cleanliness, and flow of parts (Tompkins, et al., 2010).
2.10.2 Dimensionless Block Diagram
Dimensionless block diagram is the first attempt before conducting layout construction. The block is regardless of the dimension of the area needed. This dimensionless block diagram can be used to show approximate layout that needed.
Figure 2.4 below is the example of dimensionless block diagram from a building.
Each block in dimensionless block diagram is representing an area for an activity.
The activity is represented by the number code in the middle of the block. On the 4 corners of the blocks, there is a numeric code that represent the relation of the block with other blocks. On top left is the absolutely necessary relationship, on top right is the especially important, bottom right is important, and bottom left is undesirable. So, the number in each corner of the blocks is representing the block which has the relation according to the corner where the number is residing. The block will be arranged according to which it has the importance with other blocks.
Source: gliffy.com retrieved in January 2017
Figure 2.4 Example of Dimensionless Block Diagram
CHAPTER III
RESEARCH METHODOLOGY
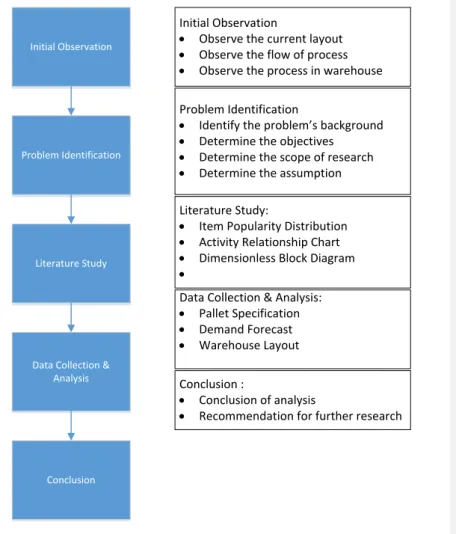
3.1 Research Methodology
Research methodology will explain the activity of the research. It is started from the initial observation until the conclusion of the problem. Every step will explain about the process as a whole and give general information related to that process.
The steps can be seen in the figure 3.1.
Initial Observation
Problem Identification
Literature Study
Data Collection &
Analysis
Conclusion
Initial Observation
• Observe the current layout
• Observe the flow of process
• Observe the process in warehouse Problem Identification
• Identify the problem’s background
• Determine the objectives
• Determine the scope of research
• Determine the assumption Literature Study:
• Item Popularity Distribution
• Activity Relationship Chart
• Dimensionless Block Diagram
•
Data Collection & Analysis:
• Pallet Specification
• Demand Forecast
• Warehouse Layout Conclusion :
• Conclusion of analysis
• Recommendation for further research
Figure 3.1 Research Methodology Flowchart
3.1.1 Initial Observation
The first step is to conduct an initial observation for the warehouse. The initial observation is conducted by a tour and survey in the Stamping plant especially in the warehouse section. This includes understanding the business process in the plant, learning the process flow and the detail in the warehouse section, and observing the layout that related to the research through the computer program and by observing the area directly. The initial problem that comes after the observation is the lack of space in the current layout for adding a new area and an inefficient material handling especially the forklift travel distance.
3.1.2 Problem Identification
The next step is to identify the problem. From the initial observation in the warehouse and the data such as the previous layout AutoCAD data, current demand, and future demand. It is known that the current area cannot manage another new process that should be added to the plant. Therefore, several areas will be used for the new process replacing the previous function of the area. The areas that will be used area both come from the Inventory Finished Product section.
The problem will be to manage the remaining area to fit future demand.
Fortunately, the future demand is lower than the current demand giving some space to relocate some of the function from the previous area to the remaining area. The remaining area of the warehouse should be created not only to fit the demand and some functions from the replaced area, but it also need to considers the safety which includes people safety and objects safety (forklifts, material, pallets, and machine) and the layout should be able to minimize the travel distance for the forklift in doing their activity for material handling. These are the research objectives and the scope and assumption also needed to be stated to create a border for the research.
3.1.3 Literature Study
This research using warehouse activity profiling as the main basis for creating the new layout for it. Aside from warehouse activity profiling there are several other improvements that is created by identifying the previous weaknesses of the layout and those weaknesses will be improved in the new layout and the layout also will be created to prevent the same weaknesses to show again. The traffic that will be changed in the new layout regarding the safety for the forklift and its operator will be compared between two types of traffic in order to decide which traffic should be implemented in the warehouse. The algorithm for the changes in the new layout will be generated to create the best layout. This algorithm will be visualized in flowchart.
3.1.4 Data Collection & Analysis
After deciding which method will be used in the literature study, the next step is to collect the data and analyze it. There are several data that will be used to support the research. The first is the specification of the pallet used in the warehouse which contain several information about the name of the parts contained in the warehouse, capacity of the pallet, dimension of the pallet, and the number stacking that can be done. The second is the current layout file, this data is really crucial in the research because it will be the basis of the comparison between the current and result and also to reduce the time to create the whole warehouse layout.
The third is the demand forecast, the data contain the forecast of demand for the car with its parts that it will be needed. The data contained in the demand forecast is the quantity per pallet, quantity per Kanban, production per shift, lot cycle, and the total each pcs of body parts that will be produced. Then the number of body parts needed will be calculated into Kanban and rounded up. After that the safety stock will be calculated based on the Kanban that will be issued from the demand forecast and the safety stock will take 10% from the total pcs and the number of safety stock in pcs convert into Kanban and rounded up again. The total Kanban from demand forecast and safety stock later converted back to body parts pcs
again and converted to number of pallets should be produced and finally divided by the stacking capability of each job number to create a result of stacked pallets needed.
The warehouse allocation of spaces later will be calculated in order to analyze the effectiveness of the current layout. The last is the material flow in the warehouse and the work flow in the warehouse will be gathered in order to gain more insight about warehouse condition and including the travel distance of current layout between pallet and production and pallet to jundate area. Those data will be gathered by asking directly to the person in charge of the data.
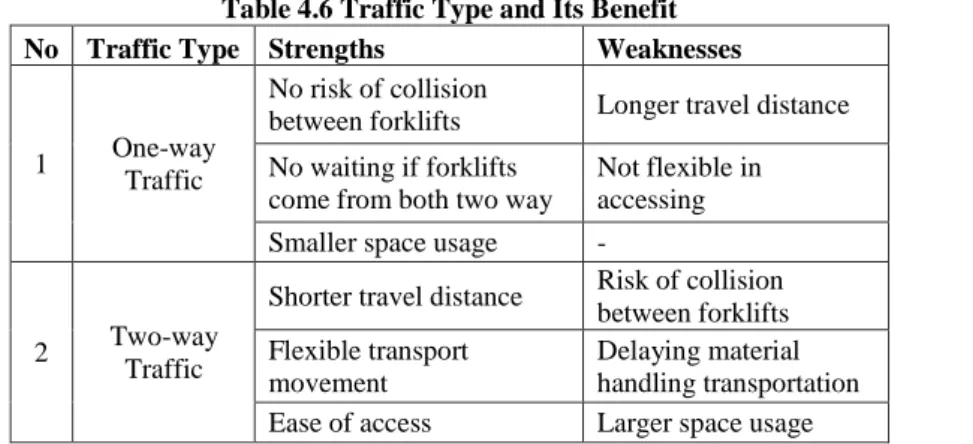
The next step is to analyze the gathered data to form a summary about the warehouse weaknesses and the improvement should be implemented in order to prevent the weaknesses from happening in the new layout. The traffic that is one of the major key in increasing the safety in the warehouse especially for the material handling equipment which is forklift, will be compared. The comparison is between two of traffic type that can be implemented in the warehouse and they are one-way traffic and two-way traffic. The strengths and weaknesses of the traffic will be summarized in a table then analyzed in which need to fulfill the warehouse needs.
The next step is to create a warehouse activity profiling to decide what kind of function needed in the warehouse and what kind of warehouse that should be created according to the profile. There are several profiles that will be implemented in this researches which is customer order profile, item activity profile, and activity relationship profile. Customer order profile will be analyzing about the order that customer usually done and create a categorization in storing pallet according to the combination of order done by the customer. Aside from the categorization, the customer order profile will be used to determine whether the customer will order in half a batch or fully and this information able to help the research in determining the needs of special picking activity area and the needs to create a smaller pallet size.
Item activity profile is used to know the picking activity happening inside the warehouse and creating a list of body parts that dominate the picking activity in the warehouse. The body parts that dominate the picking activity should be put in a higher priority than other body parts in terms of location. The top body parts that give a lot of percentage picking activity will be located near the next process. This whole assessment is using item popularity distribution method. Next is activity relationship profile, the profile is created in order to learn about the relation between activities in the warehouse. Those activities then will be used to plot the new layout and the location for each activity. Activity relationship chart and dimensionless block diagram is used as the basis for this profile. Activity relationship chart determine the relationship between activities and importance, while dimensionless block diagram is the early area plotting happened to give a big picture of the ideal layout and activity location.
After the warehouse activity profiling, then the proposed improvement will be summarized in a table. Then generate the layout using the information from the previous assessment. The new layout then compared to the current layout and also all the improvement will be compared to the current layout. Then at the end, the travel distance result will be compared between current layout and new layout.
3.1.5 Conclusion
The best solution will be created and the solution will be answering the problem statement which are about the layout that able to sustain the future demand, with more efficient travel distance, and increased safety. The design of new layout will be provided to show the efficient flow and benefitting the future demand of parts while ensuring the new process will get a new area replacing some of the warehouse.
21
Analyzing Tools
Analyzing Tools Warehouse Activity ProfileWarehouse Activity Profile Define
Problems
Analyze Current Condition
Find Weaknesses
Profile Warehouse
Activity
Generate New Layout
Conclusion Analyze
Current Layout
Analyze Warehouse Material Flow
Analyze Pallet
Customer Order Profile
Item Activity Profile
Activity Relationship
Profile
End Start
Figure 3.2 Flow of Research
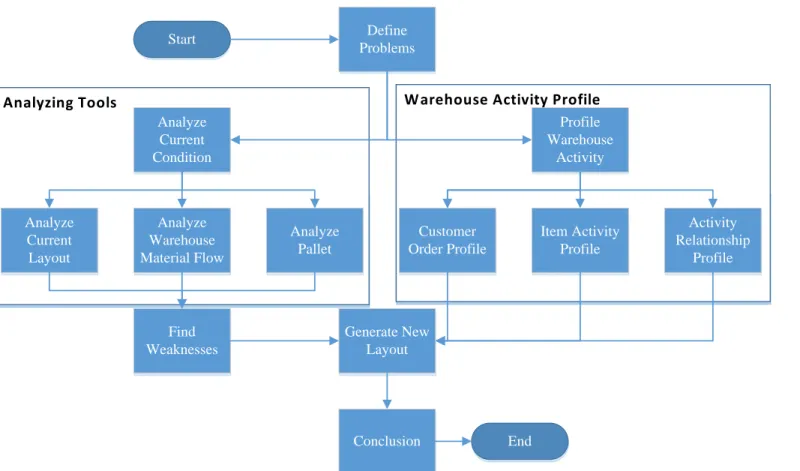
3.2 Research Framework
Figure 3.2 above is showing the steps for conducting the research. It is all started from defining the problem faced in the case study. Defining the problem means creating the problem statement, determine objective, and determine the scope and assumption for the research. Then the current condition is should be observed and analyzed.
The current condition that will be analyzed is current layout, the process flow in the warehouse, material handling method, and pallet specification. The data for those are gathered through the staff working in the plant.
After analyzing the current condition of the warehouse, the weakness will be identified and try to find the best action to take to improve the aspect of the weakness in the warehouse. These improvements will be a major factor in creating the new layout and become a consideration about the aspects of warehouse. The next step is to profile the warehouse activity, this method is used to determine what the warehouse needed with the various data from customer order profile until investment profile. These profiles will also become a basis of layout creation and consideration. Both analyzes and profile will be used in creating the layout and will be explained further.
After gaining insight of the warehouse’s profile, then the next step is to generate a layout according to the data and improvement for the new layout. The first step is to assign the area for several activities such as storing, repairing, and setting in the area available. These arrangements of area will be created based on the previous Activity Relationship Profiling which record the data and the relation between each activity that related to the warehouse and activities that need to be assigned.
This is very crucial information that create a deciding factor in which activity assigned to an area.
The next step after deciding which area for which activity, each area will be created a layout specifically. The first layout to be created is the repair area, which
located near the stamping process. The process of creating the layout for repair area will be explained further in Chapter IV, but the general things is that to create a priority which function should be placed first and become the point of creating other spaces for other functions. For repair area, the main function lies in repair table, so the repair table will be assigned first then continued by its defect pallet storage and forklift access area.
The next area next to repair area is storage area which connected directly to the stamping process too. To create the layout for storage area, first the algorithm should be created and it is explained in the flowchart in Chapter IV. The first priority is to assign storage spaces for pallets and pallets with high demand should be placed in the most benefiting place which is near the Jundate area. Then creating the block specifically for pallet with high demand in the frontline to Jundate area following forklifts access space and followed then by another storage space and continued until there is no space left in the storage area
After storage area, the next area is Jundate area. This place is the final area before the product will be docked and sent to other plant. This area layout arrangement will be started by determining the in and out of products which will be the place that should be able accessed by forklifts. Then the remaining area will be plotted as jundate area from top and separated by forklifts path between one area to another. The complete step can be seen in Chapter IV. After the layout satisfy the objective that determined in the beginning of the research then the result of the new layout will be analyzed and compared to the current layout.
CHAPTER IV
DATA COLLECTION AND ANALYSIS
4.1 Current Condition 4.1.1 Pallet of Body Part
The specification of each body parts affect the size and dimension of the pallet for each type of body part. This table 4.1 below show the specification of each pallet type and the product it holds. The difference in dimension and size of pallet differ it in term of stacks maximum for the warehouse to handle. Some of the had a maximum stacking of 4 and the bigger pallet will only be allowed for maximum 2 stacking.
It is noticed that there is a difference highlight between the Width and Height. The highlighted weight or width is the front face of the pallet, meaning that the forklift will face that side is to carry it. Every body part has a different name and job number. It is marked to get the difference on treatment of the product in production line and on work place for Jundate process. The pallet specification can be seen in Table 4.1 and detailed table can been in Appendix II.
4.1.2 Vertical Pallet Stacking
The maximum stacking which is written in one of the category in the table 4.1 means about the maximal number that the certain pallet will be allowed to be stacked. The difference in the size of pallet affect the number of stacking very much. It is limited by the height of the warehouse; therefore, the total height of stacked pallet should be less than the height of warehouse. The stacking system that is used in this warehouse is vertical stacking. The example of vertical stacking can be seen in Figure 4.1
Table 4.1 Pallet Specification
No Job Job Desc JUNDATE P(m) L(m)
Stack pallet max 1 K2113 PANEL, SIDE OUTER
RH FRONT SIDE PU
D40D 1.75 1.55 2
2 K2024 PANEL, SIDE OUTER
LH FRONT SIDE PU
D40D 1.75 1.65 2
3 K2115 PANEL, SIDE OUTER
RH FRONT SIDE PU
D40D 1.75 1.65 2
4 K2114 PANEL, SIDE OUTER
RH FRONT SIDE PU
D40D 1.75 1.65 2
5 K2028 PANEL, SIDE OUTER
LH FRONT SIDE PU
D40D 1.75 1.65 2
6 K2026 PANEL, SIDE OUTER
LH FRONT SIDE PU
D40D 1.75 1.65 2
7 K2119 PANEL, SIDE OUTER RH
FRONT SIDE VAN
D40D 1.75 1.65 2
8 K2110 PANEL, SIDE OUTER LH
FRONT SIDE VAN
D40D 1.75 1.65 2
9 K2117 PANEL, SIDE OUTER RH
FRONT SIDE VAN
D40D 1.75 1.65 2
10 K2107 PANEL, SIDE OUTER LH
FRONT SIDE VAN
D40D 1.75 1.65 2
Source: www.stakall.in
Figure 4.1 Vertical Pallet Stacking
4.1.3 Demand Forecast
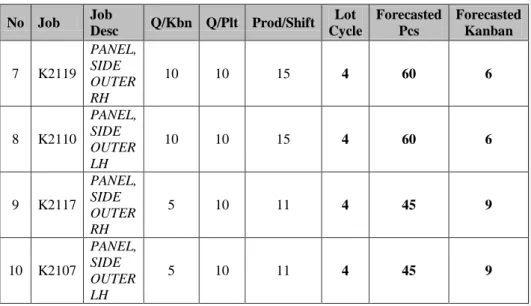
Table 4.2 above reveals the data of demand forecast in the warehouse. These data will be the basis of how the warehouse will be designed and how the storing process will look like. The table 4.2 above contain information from the demand of products in each shift until the number of pallets needed for the specific body parts, the complete table can be seen in Appendix I. Some variable such as the Lot Cycle, Q/Pallet, and Q/Kanban is different between one another. The formula used to calculate the rest of the data will be explained below.
Table 4.2 Demand Forecast for Parts of D40D, D22D, and D14D No Job Job
Desc Q/Kbn Q/Plt Prod/Shift Lot Cycle
Forecasted Pcs
Forecasted Kanban 1 K2113
PANEL, SIDE OUTER RH
10 10 51 4 210 21
2 K2024
PANEL, SIDE OUTER LH
10 10 51 4 210 21
3 K2115
PANEL, SIDE OUTER RH
1 10 3 4 12 12
4 K2114
PANEL, SIDE OUTER RH
5 10 6 4 25 5
5 K2028
PANEL, SIDE OUTER LH
5 10 6 4 25 5
6 K2026
PANEL, SIDE OUTER LH
5 10 0 4 0 0
Table 4.2 Demand Forecast for Parts of D40D, D22D, and D14D (continued) No Job Job
Desc Q/Kbn Q/Plt Prod/Shift Lot Cycle
Forecasted Pcs
Forecasted Kanban 7 K2119
PANEL, SIDE OUTER RH
10 10 15 4 60 6
8 K2110
PANEL, SIDE OUTER LH
10 10 15 4 60 6
9 K2117
PANEL, SIDE OUTER RH
5 10 11 4 45 9
10 K2107
PANEL, SIDE OUTER LH
5 10 11 4 45 9
4.1.3.1 Forecasted Pieces
Forecasted Pieces (pcs) s are representing the number of demand in total for 4 lot cycles or for 4 production shifts. The number of forecasted pcs calculated from the Equation (4-1) below.
𝐹𝑂𝑅𝐸𝐶𝐴𝑆𝑇𝐸𝐷 𝑃𝐶𝑆= 𝐹𝑂𝑅𝐸𝐶𝐴𝑆𝑇𝐸𝐷 𝐾𝐴𝑁𝐵𝐴𝑁 × 𝑄/𝐾𝐴𝑁𝐵𝐴𝑁 (4-1)
For example, from the first Panel Side Outer RH (Job K2113). The Kanban for the job is 21 Kanban, while the quantity per Kanban is 10 pcs. So, the number of body parts for Panel Side Outer RH (Job K2113) is calculated like below:
𝐹𝑜𝑟𝑒𝑐𝑎𝑠𝑡𝑒𝑑 𝑃𝑐𝑠 𝐽𝑜𝑏 𝐾2113 = 21 × 10 =𝟐𝟏𝟎 𝑝𝑐𝑠 4.1.3.2 Forecasted Kanban
Forecasted Kanban are representing the number of demand, but using Kanban as a unit instead of pcs. The number of forecasted Kanban should be calculated first before calculating each pcs of the demand. The result of the Kanban will be rounded up. The formula to calculate this is shown in Equation (4-2) below:
𝐹𝑂𝑅𝐸𝐶𝐴𝑆𝑇𝐸𝐷 𝐾𝐴𝑁𝐵𝐴𝑁= (𝑆𝐻𝐼𝐹𝑇𝑃𝑅𝑂𝐷) ×𝐿𝑂𝑇 𝐶𝑌𝐶𝐿𝐸÷ (𝐾𝐴𝑁𝐵𝐴𝑁𝑄 ) (4-2)
The example will be taken from the Panel Side Outer RH (Job K2113). The Production per shift for the item is 51 pcs and Lot cycle is 4, while quantity per Kanban is 10 pcs. So, the Kanban for this item will be calculated like shown below:
𝐹𝑂𝑅𝐸𝐶𝐴𝑆𝑇𝐸𝐷 𝐾𝐴𝑁𝐵𝐴𝑁= 51 × 4 ÷ 10 𝐹𝑂𝑅𝐸𝐶𝐴𝑆𝑇𝐸𝐷 𝐾𝐴𝑁𝐵𝐴𝑁= 20,4 ≈ 𝟐𝟏
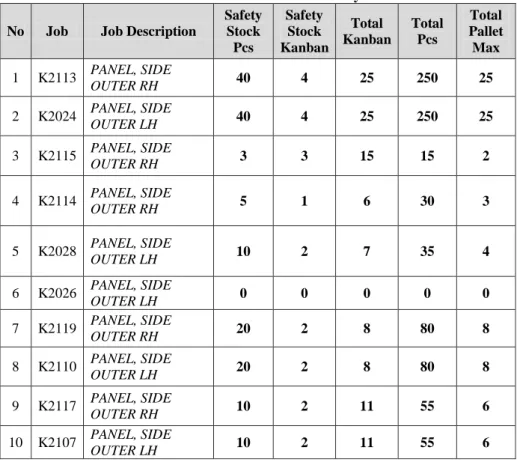
Table 4.3 Demand Forecast with Safety Stock No Job Job Description
Safety Stock
Pcs
Safety Stock Kanban
Total Kanban
Total Pcs
Total Pallet Max 1 K2113 PANEL, SIDE
OUTER RH 40 4 25 250 25
2 K2024 PANEL, SIDE
OUTER LH 40 4 25 250 25
3 K2115 PANEL, SIDE
OUTER RH 3 3 15 15 2
4 K2114 PANEL, SIDE
OUTER RH 5 1 6 30 3
5 K2028 PANEL, SIDE
OUTER LH 10 2 7 35 4
6 K2026 PANEL, SIDE
OUTER LH 0 0 0 0 0
7 K2119 PANEL, SIDE
OUTER RH 20 2 8 80 8
8 K2110 PANEL, SIDE
OUTER LH 20 2 8 80 8
9 K2117 PANEL, SIDE
OUTER RH 10 2 11 55 6
10 K2107 PANEL, SIDE
OUTER LH 10 2 11 55 6
Table 4.3 shows demand forecast with the safety stock. The result is the final result for the demand forecast for body parts in future months. The result is presented in stacked pallet max to simplify the calculation for pallet in the new layout. For detail data about demand forecast please refer to Appendix 2.
4.1.3.3 Safety Stock
Safety stock is calculated using 20% of the demand forecast which is each pcs of body part. This safety stock is the result of the Equation (4-3) below:
𝑆𝐴𝐹𝐸𝑇𝑌 𝑆𝑇𝑂𝐶𝐾= 𝑆𝐴𝐹𝐸𝑇𝑌 𝑆𝑇𝑂𝐶𝐾 𝐾𝐴𝑁𝐵𝐴𝑁 × (𝐾𝐴𝑁𝐵𝐴𝑁𝑄 ) (4-3) The example for this safety stock formula could be seen using the Panel Side Outer RH as an example. The safety stock Kanban that will be explained below will be described in the next topic and quantity per Kanban.
𝑆𝐴𝐹𝐸𝑇𝑌 𝑆𝑇𝑂𝐶𝐾= 5 × 10 𝑆𝐴𝐹𝐸𝑇𝑌 𝑆𝑇𝑂𝐶𝐾= 50
4.1.4 Safety Stock Kanban
Safety stock Kanban is the Kanban used for safety stock. Kanban itself has been the unit or the basis of ordering a material or body pcs. The equation (4-4) to calculate Safety Stock Kanban in the table 4.3 above is:
𝑆𝐴𝐹𝐸𝑇𝑌 𝑆𝑇𝑂𝐶𝐾 𝐾𝐴𝑁𝐵𝐴𝑁=𝐸𝐴𝐶𝐻 𝑃𝐶𝑆 × 20% ÷�𝐾𝐴𝑁𝐵𝐴𝑁𝑄 � (4-4)
The example that can be used for this formula is to calculate the safety stock Kanban of the Panel Side Outer RH. So, each pcs for Panel Side Outer RH is 210 and the quantity per Kanban is 10. Then the data can be put them into the formula as shown below:
𝑆𝐴𝐹𝐸𝑇𝑌 𝑆𝑇𝑂𝐶𝐾 𝐾𝐴𝑁𝐵𝐴𝑁= 210 × 20% ÷ 10 𝑆𝐴𝐹𝐸𝑇𝑌 𝑆𝑇𝑂𝐶𝐾 𝐾𝐴𝑁𝐵𝐴𝑁= 42 ÷ 10
𝑆𝐴𝐹𝐸𝑇𝑌 𝑆𝑇𝑂𝐶𝐾 𝐾𝐴𝑁𝐵𝐴𝑁= 4.2 ≈ 𝟓
4.1.5 Total Kanban
Total Kanban is the sum of safety stock Kanban and each Kanban. There will be no other variable that will be put inside the formula other than those. From these statement, create the equation (4-5) of total Kanban such as:
𝑇𝑂𝑇𝐴𝐿 𝐾𝐴𝑁𝐵𝐴𝑁= 𝑆𝐴𝐹𝐸𝑇𝑌 𝑆𝑇𝑂𝐶𝐾 𝐾𝐴𝑁𝐵𝐴𝑁+𝐸𝐴𝐶𝐻 𝐾𝐴𝑁𝐵𝐴𝑁 (4-5)
Then take the data from Panel Side Outer RH as the example for this equation.
After the calculation of safety stock Kanban and each Kanban, the sum of these 2 variables will determine the number of total Kanban for the product.
𝑇𝑂𝑇𝐴𝐿 𝐾𝐴𝑁𝐵𝐴𝑁= 21 + 5 𝑇𝑂𝑇𝐴𝐿 𝐾𝐴𝑁𝐵𝐴𝑁= 26
4.1.6 Total Number of Pieces
Total Number of pieces is the number of total body parts that will be produced for 2 days or 4 shifts. Total Pcs can be calculated through multiplying total Kanban with quantity per Kanban. Below is the equation (4-6) to calculate the total pcs:
𝑇𝑂𝑇𝐴𝐿 𝑃𝐶𝑆=𝑇𝑂𝑇𝐴𝐿 𝐾𝐴𝑁𝐵𝐴𝑁 × (𝐾𝐴𝑁𝐵𝐴𝑁𝑄 ) (4-6)
The example can be taken from the data of Panel Side Outer RH. The total Kanban is 26 and the quantity per Kanban will be 10. Provided with the data a variable, therefore the data could be calculated the total pcs for Panel Side Outer RH in the provided equation:
𝑇𝑂𝑇𝐴𝐿 𝑃𝐶𝑆= 26 × 10 𝑇𝑂𝑇𝐴𝐿 𝑃𝐶𝑆=𝟐𝟔𝟎 𝑝𝑐𝑠
4.1.7 Total Pallet Max
Total pallet max is the number of pallet that a storage should be able to contain for a duration of 4 shifts or 2 days. This number is calculated by dividing the total pcs with the quantity per pallet. Therefore, the Equation (4-7) should be look like this:
𝑇𝑂𝑇𝐴𝐿 𝑃𝐴𝐿𝐿𝐸𝑇 𝑀𝐴𝑋=𝑇𝑂𝑇𝐴𝐿 𝑃𝐶𝑆 ÷ (𝑃𝐴𝐿𝐿𝐸𝑇𝑄 ) (4-7)
For example, Panel Side Outer RH will be used to provide the data. Using the table 4.2 above, it would know that the total pcs is 260, while quantity per pallet will be 10. Then, the using the data above, the result will be shown below:
𝑇𝑂𝑇𝐴𝐿 𝑃𝐴𝐿𝐿𝐸𝑇 𝑀𝐴𝑋= 260 ÷ 10 𝑇𝑂𝑇𝐴𝐿 𝑃𝐴𝐿𝐿𝐸𝑇 𝑀𝐴𝑋=𝟐𝟔 𝑃𝑎𝑙𝑙𝑒𝑡
Some formula’s answer will be rounded up in order to fit the capacity of either pallet or Kanban. Those formulas are Forecasted Kanban, Safety Stock Kanban, and Total Pallet Max. So, the table 4.2 above is showing the rounded-up result of those formula written above.
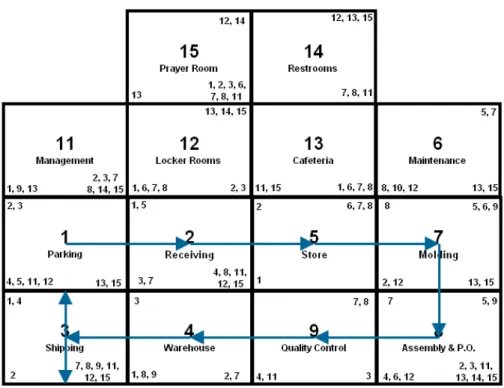
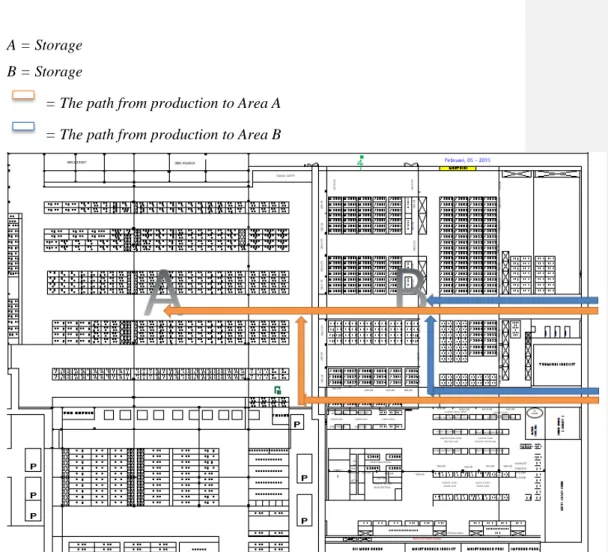
4.2 Current Layout
In this section, the current layout from previous data will be provided and analyzed. The current layout consists of 2 storage areas (area 2A and 2B), repair area, and jundate area. From the current layout, it could be identified the current problem with the layout. Figure 4.2 shows the current layout. The bigger size can be seen in Appendix III.
Figure 4.2 Current Layout of Warehouse
This figure 4.2 above is the illustration of warehouse layout in Stamping Plant.
The warehouse is located adjacent to the production division on the right side of the layout. So, the body parts or product will be coming from the right and stored in the top side of the layout where there are several pallets symbolized as stacked block with various color. The color for each block represent the difference between those blocks. The exit of body parts is in the middle part between area in bottom left and bottom right. The area is quite narrow and for the truck to enter need a good maneuver.
Moreover, Figure 4.2 above shows that the current layout separates the pallet into several categories based on pallet size. Then, the pallet will be divided into the pallet group per its car type. The process of material handling is using FIFO so both side of the pallet group should be able to be accessed by forklift. The weakness of this layout is the number of possible crossing between forklifts.
Although the risk is not really that high and there is not any evidence about forklifts accidents, but the possibility should be reduced. The crossing also related to the working flow of forklifts. The flow which will be explained below.
4.3 Current Warehouse Space Allocation
In this section, it will be explained about the warehouse space usage in the plant and the space allocation for each activity in the plant especially in the inventory finished part division. The space allocation can give us an insight about how the staff utilize the warehouse and can be as an evaluation of the usage for the storage. The normal storage should have more space allocated to the functional area such as storing.
From Table 4.4 above, it could be seen that the area in 2A and 2B allocated a lot of spaces to the forklift transport area in which forklift able to move freely. These allocations can be improved in such ways where the spaces could be used for more pallet storage by reducing the forklift area and re-allocating the space for pallet storage. Therefore, these spaces can store more pallets or use the space for
more function especially in Area 2A where the space for forklift is very big and about 68.5% of the total area in that area. While area 2B is quite good enough by using more than half of its area for storing function. So, area 2A and 2B can be further more used for storage or jundate.
Table 4.4 Current Area 2A and 2B Usage
Area 2A Area
(m2)
Area Percentage
Total Area 2A 2,830.00
Total Pallet Space in Area 2A 891.5 31.5%
Total Forklift Space in Area 2A 1,938.5 68.5%
Area 2B Area
(m2)
Area Percentage
Total Area 2B 2,104.00
Total Pallet Space in Area 2B 1101.2 52.3%
Total Forklift Space in Area 2B 1002.8 47.7%
Table 4.5 Warehouse Activity Area Allocation Activity Space Used
(m2)
Gross Space, 150%
of Net Space
Repairing 502.5 753.75
Storing 1992.7 2989.05
Setting 517.72 776.58
Total 3012.92 4519.38
Table 4.5 above is showing the current area for each activity in the warehouse area. Those activities are repairing, storing, and setting. Activities such as stamping and docking is not mentioned above because those two activities area the starting and ending point of the process that is happening in the warehouse. In the repairing activity, the space that is calculated is the sum of repair area and the pallet area for repair goods. Storing activity area is include all the pallet area in the warehouse except for the pallet in repair area and pallet in Jundate area.
Setting activity includes the pallet storage near the Jundate and the area of worker. The gross space is 150% of the total space used for each activity and it is used as the allowance for each area; it can be used for forklift access or worker way to access the area.
4.4 Current Process Flow
The process flow that will be explained in this section is the overall process flow in the Stamping plant which will include the process flow that is related to the re- layout that will be done later. The figure below is the business process flow of the whole plant.
Figure 4.3 illustrates how the business process in the Plant. It is starting from the incoming material and placed in the storage of Inventory Raw Material and then it will be checked from a sample of the material and if the material’s dimension does not match with the expected dimension, it will be sheared using the machine provided in the Inventory Raw Material warehouse and then it will be stored with other materials. After that, the materials will be transferred to Production line (Stamping Machine) and while stamping, some parts will be inspected; if the product is not good then the stamping will be paused and several products will be put in the pallet and delivered to the repair area.
The stamping machine then will be adjusted to prevent more defect product and following that action the production will be continued. If the parts are good, then the products will be moved to the Inventory Finished Product Warehouse. After that they will be moved to Jundate area to arrange the pallet with demand from Assembly Plant and then it will be moved to docking area and delivered to Assembly Plant. The area that should be located adjacent between each other. The production area should be located beside the storage, followed by the Jundate area located beside the Storage and last, the docking area is located beside the Jundate Area. This production flow will be used for allocating the function of the area in order to create the best material flow using straight flow pattern.
Here are below the process flow in the current layout in the warehouse of Inventory Finish Part Division. The production process flow in the current layout is very messy and not created adjacent one another. It creates a result in a higher distance between each process namely Production process, Storage, and Setting
process (Jundate). Figure 4.4 will reveal the current layout and its production flow.
36
Incoming Material (START)
Fit to Stamp?
Storing
Stamping Inspection Defect? Storing
Jundate (Setting) Docking (END)
Repairing
Shearing NO
YES
NO YES
Figure 4.3 Business Process in the Plant
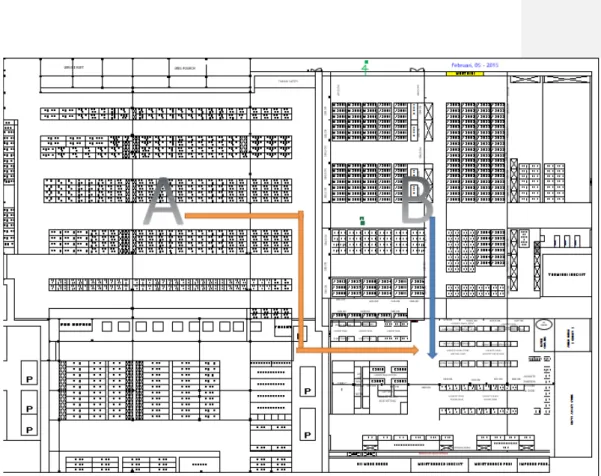
A = Storage B = Storage
= The path from production to Area A = The path from production to Area B
Figure 4.4 Current Material Flow from Stamping to Storage in A and B
Figure 4.4 illustrates the transportation flow from the Production area to the Storage located in Area A and Area B. Both of this area is used for storing the product from the Production line while waiting to be carry on to the next process which is Setting in Jundate Area. There are 2 doors between production area to storage area. The door is located in the right side of B area. Products will be moved in pallets and placed in their prepared place. Each type of pallets will be replaced differently from the others, but it is grouped in a certain area. The bigger size of this layout can be seen in Appendix 4.