INTERNAL ASSESSMENT
IB CERTIFICATE Mathematics: Application and Analysis
Standard Level
“Modeling a Trigonometric Function of the Pattern Between Indonesia and Netherlands Hours of Daylight Caused by Different Seasons”
EXAMINATION SESSION: MAY 2025
WORD COUNT:
Topic: Modeling the pattern between Indonesia and Netherlands hours of daylight caused by different seasons by using the graph of trigonometric functions.
I.I Introduction
Indonesia and the Netherlands, despite being worlds apart geographically, have interesting differences in their climate and seasonal daylight patterns due to their distinct positions on the globe. Indonesia is located near the equator. Indonesia experiences relatively consistent daylight throughout the year. While the Netherlands, situated in the higher northern latitudes, sees significant variations in daylight hours across different seasons. These variations are directly influenced by the Earth’s tilt and its elliptical orbit around the sun which causes changes in the angle and duration of sunlight hitting each country at different years.
In Indonesia due to its equatorial position, daylight hours remain constant with only minor fluctuations between the longest and shortest days of the year. However, the Netherlands’
experiences different seasonal changes, with long daylight hours in the summer and short daylight hours in the winter. This relationship between geographical location and seasonal changes in daylight can be modeled mathematically using trigonometric functions which are well-suited to represent periodic phenomena such as the cyclical nature of daylight variation.
In this mathematical exploration, I will model the daylight patterns in both Indonesia and the Netherlands by using trigonometric functions. By using sine and cosine functions which describe the periodic behavior, I will show the repeating nature of daylight as influenced by the earth's rotation and revolution.
I.2 Aims of the Exploration
The aims of this math exploration on modeling the pattern between Indonesia and the Netherlands with respect to seasonal daylight variation using trigonometric functions are:
1. To understand and analyze the correlation between geographical location and seasonal daylight pattern.
2. To model periodic changes in daylight using trigonometric functions.
3. To compare the daylight cycles of two countries with different climates.
4. To apply the properties of trigonometric functions to real world context.
I.3 Assumptions Made in the Model Constructions
To keep things simple, I have made a few basic assumptions when developing my trigonometric function model for daylight changes in Indonesia and the Netherlands.
Although the Earth's orbit around the Sun is somewhat oval shape I still assume that it is a perfect circle. To maintain a 365-day cycle, I also assume that daylight varies equally throughout the year and disregard leap years. I have decided to concentrate purely on the variations in daylight depending on location, leaving out minor variables like the way the atmosphere affects sunlight. Because Indonesia is close to the equator I assume that daylight lasts for about 12 hours every year there. Trigonometric functions are made simpler by these presumptions.
2.1 Data Presentation and Analysis
Firstly, the data that I have obtained are secondary data from timeanddate.com. To represent the data, it will be grouped into the following table according to the countries (Indonesia & Netherlands) and two seasons (summer & winter/cold). The average length of daylight is calculated accordingly:
Average monthly length of daylight for each month in each year:
Average monthly length of daylight for a given month throughout the years:
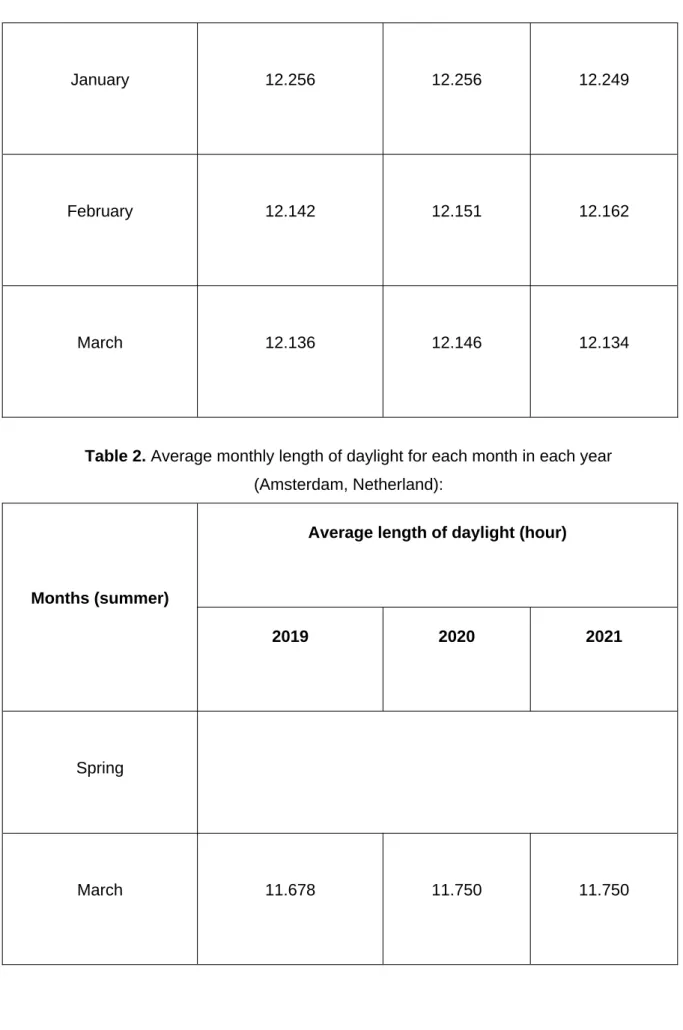
Table 1. Average monthly length of daylight for each month in each year (Jakarta, Indonesia):
Months (summer)
Average length of daylight (hour)
2019 2020 2021
Dry Season
April 11.931 11.980 11.967
May 11.799 12.261 11.454
June 11.766 11.756 11.758
July 11.767 11.767 11.769
August 11.877 11.877 11.887
September 12.027 12.027 12.027
Months (coldest) Average length of daylight (hour)
Rainy Season
October 12.144 12.222 12.211
November 12.248 12.246 12.245
December 12.284 12.284 12.284
January 12.256 12.256 12.249
February 12.142 12.151 12.162
March 12.136 12.146 12.134
Table 2. Average monthly length of daylight for each month in each year (Amsterdam, Netherland):
Months (summer)
Average length of daylight (hour)
2019 2020 2021
Spring
March 11.678 11.750 11.750
April 14.200 14.200 14.100
May 15.696 15.754 15.758
Summer
June 16.453 16.464 16.464
July 16.127 16.050 16.039
August 14.200 14.250 14.415
Months (coldest) Average length of daylight (hour)
Autumn
September 12.800 12.500 12.500
October 10.790 10.510 10.279
November 8.550 8.340 8.360
Winter
December 7.700 7.730 7.730
January 8.270 8.210 8.260
February 10.320 10.270 10.340
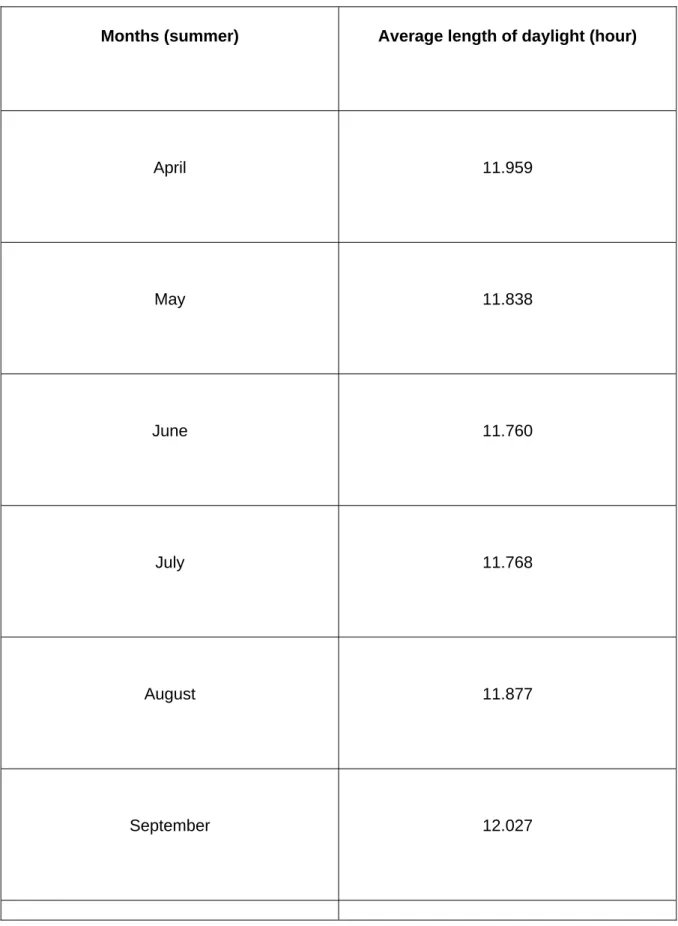
Table 3. Average monthly length of daylight in Jakarta, Indonesia throughout the years (2019-2021)
Months (summer) Average length of daylight (hour)
April 11.959
May 11.838
June 11.760
July 11.768
August 11.877
September 12.027
Months (coldest) Average length of daylight (hour)
October 12.192
November 12.246
December 12.284
January 12.254
February 12.152
March 12.138
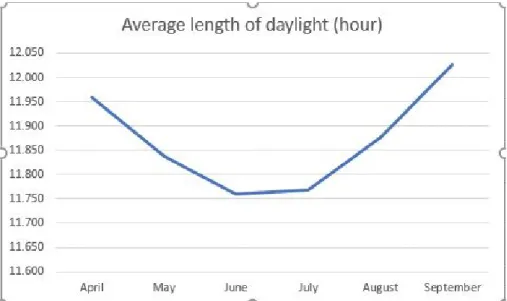
Figure 1. Graph of average monthly length of daylight in Jakarta, Indonesia throughout the years (2019-2021) for summer months by Ms. Excel
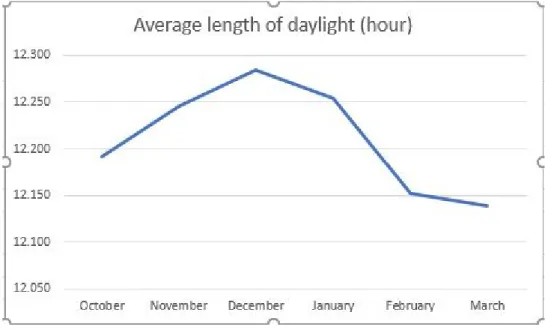
Figure 2. Graph of average monthly length of daylight in Jakarta, Indonesia throughout the years (2019-2021) for coldest months by Ms. Excel
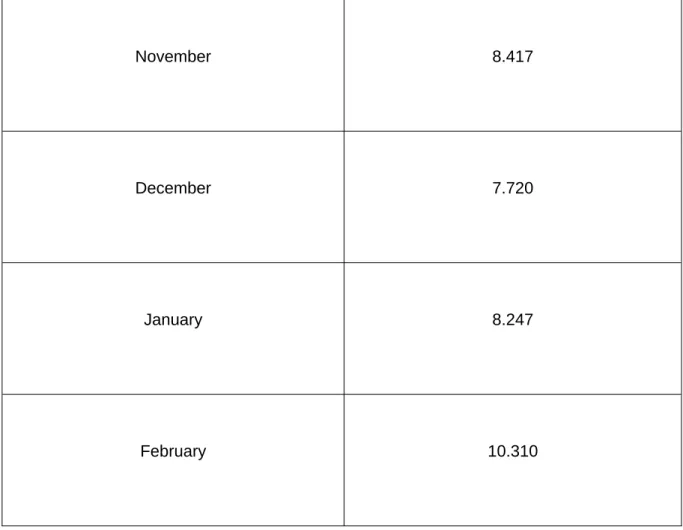
Table 4. Average monthly length of daylight in Amsterdam, Netherland throughout the years (2019-2021)
Months (summer) Average length of daylight (hour)
March 11.726
April 14.166
May 15.743
June 16.460
July 16.072
August 14.288
Months (coldest) Average length of daylight (hour)
September 12.600
October 10.526
November 8.417
December 7.720
January 8.247
February 10.310
Figure 3. Graph of average monthly length of daylight in Amsterdam, Netherland throughout the years (2019-2021) for summer months by Ms. Excel
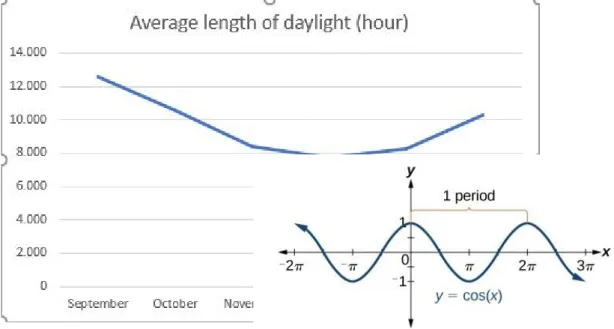
Figure 4. Graph of average monthly length of daylight in Amsterdam, Netherland throughout the years (2019-2021) for coldest months by Ms. Excel
2.2 Trigonometric Function
Based on graph of average monthly length of daylight in Jakarta, Indonesia throughout the years (2019-2021) for summer months by Ms. Excel, it shows that the graph is similar to graph of cosine, only one amplitude in one period. Thus, we use cosine function for average monthly length of daylight in Jakarta, Indonesia (2019-2021) for summer months.
Figure 5. Graph of average monthly length of daylight in Jakarta, Indonesia (2019-2021) for summer months (left) and cosine graph from internet (Openstax, 2020) (right)
Using Desmos Graphic Calculator, the graph and the basic equation of cosine function are as below:
f(x) = cos x
f(x) is function cos is cosine x is value of cosine Figure 6. Cosine graph by Desmos for -2π ≤ x ≤ 2π
Then the equation of transformed function is as below (Haese, et.al., 2019: 207):
f(x) = a cos (b (x-c)) + d f(x) is function
a is amplitude
b is period of function (either derive b or find new period: 2π / b) c is phase shift
d is vertical shift
To model new function, we need to calculate some characteristics of average monthly length of daylight in Jakarta, Indonesia throughout the years (2019-2021) for summer months data:
Maximum monthly length of daylight 12.027 Minimum monthly length of daylight 11.760
What month reach maximum September
What month reach minimum June
What period of time in the data 6
Table 5. Some characteristics of average monthly length of daylight in Jakarta, Indonesia throughout the years (2019-2021) for summer months data
Based on the previous table, we can calculate for modelling new function:
a = (max value – min value) / 2 a = (12.027 - 11.760) / 2 a = 0.1335
period = 2π / b 6 = 2π / b b = 2π / 6 b = π / 3
c = 6
(the max value is at September as 6th month as summer start from April to September)
d = (max value + min value) / 2 d = (12.027 + 11.760) / 2 d = 11.8935
Thus, the new function of average monthly length of daylight in Jakarta, Indonesia throughout the years (2019-2021) for summer months is:
f(x) = 0.1335 cos (π / 3 (x-6)) + 11.8935
Then the graph of that function by Desmos is as below:
Figure 7. Graph of f(x) = 0.1335 cos (π / 3 (x-6)) + 11.8935 by Desmos (0 ≤ x ≤ 6)
To know the difference of actual data and value from new function, here is the table:
x Actual data Value of new function
1
11.959
11.96025
2
11.838
11.82675
3
11.760
11.760
4
11.768
11.82675
5
11.877
11.96025
6
12.027
12.027
Table 6. The difference of actual data and value from new function
Figure 8. Graph of the difference of actual data and value from new function
Then based on the difference, we can calculate the percentage of error:
Percentage of Error =
| (Value of Actual Data − Value of New Function) / Value of New Function | × 100
x Percentage of Error
1 0.008%
2 0.095%
3 0.000%
4 0.495%
5 0.698%
6 0.000%
Table 7. Percentage of error between actual data and value from new function
We need to calculate mean of percentage of error to know the mean of it:
Mean Of Percentage Of Error = Total Percentage of Error / Total X
Mean Of Percentage Of Error = 1.106 / 6 = 0.1843%
Now, go to average monthly length of daylight in Jakarta, Indonesia throughout the years (2019-2021) for coldest months by Ms. Excel, it shows that the graph is similar to graph of cosine, only one amplitude in one period. Thus, we use cosine function for average monthly length of daylight in Jakarta, Indonesia (2019-2021) for coldest months.
Figure 9. Graph of average monthly length of daylight in Jakarta, Indonesia (2019-2021) for coldest months (left) and cosine graph from internet (Openstax, 2020) (right)
Because the graph is same as previous one for summer months, we can jump to model new function. To model new function, we need to calculate some characteristics of average monthly length of daylight in Jakarta, Indonesia throughout the years (2019-2021) for coldest months data:
Maximum monthly length of daylight 12.284 Minimum monthly length of daylight 12.138
What month reach maximum Desember
What month reach minimum March
What period of time in the data 6
Table 8. Some characteristics of average monthly length of daylight in Jakarta, Indonesia throughout the years (2019-2021) for coldest months data
Based on the previous table, we can calculate for modelling new function:
a = (max value – min value) / 2 a = (12.284 - 12.138) / 2 a = 0.073
period = 2π / b 6 = 2π / b b = 2π / 6 b = π / 3
c = 3
(the max value is at Desember as 3th month as summer start from October to March)
d = (max value + min value) / 2 d = (12.284 + 12.138) / 2 d = 12.211
Thus, the new function of average monthly length of daylight in Jakarta, Indonesia throughout the years (2019-2021) for coldest months is:
f(x) = 0.073 cos (π / 3 (x-3)) + 12.211
Then the graph of that function by Desmos is as below:
Figure 10. Graph of f(x) = 0.073 cos (π / 3 (x-3)) + 12.211 by Desmos (0 ≤ x ≤ 6)
To know the difference of actual data and value from new function, here is the table:
x Actual data Value of new function
1
11.959
11.96025
2
11.838
11.82675
3
11.760
11.760
4
11.768
11.82675
5
11.877
11.96025
6
12.027
12.027
Table 9. The difference of actual data and value from new function
Figure 11. Graph of the difference of actual data and value from new function
Then based on the difference, we can calculate the percentage of error:
Percentage of Error =
| (Value of Actual Data − Value of New Function) / Value of New Function | × 100
x Percentage of Error
1 0.14%
2 0.012%
3 0%
4 0.053%
5 0.18%
6 0%
Table 10. Percentage of error between actual data and value from new function
We need to calculate mean of percentage of error to know the mean of it:
Mean Of Percentage Of Error = Total Percentage of Error / Total X
Mean Of Percentage Of Error = 0.385 / 6 = 0.064%
Now, go to average monthly length of daylight in Amsterdam, Netherland throughout the years (2019-2021) for summer months by Ms. Excel, it shows that the graph is similar to graph of cosine, only one amplitude in one period. Thus, we use cosine function for average monthly length of daylight in Amsterdam, Netherland (2019-2021) for summer months.
Figure 12. Graph of average monthly length of daylight in Amsterdam, Netherland (2019- 2021) for summer months (left) and cosine graph from internet (Openstax, 2020) (right)
Because the graph is same as previous one for Jakarta, Indonesia, we can jump to model new function. To model new function, we need to calculate some characteristics of average monthly length of daylight in Amsterdam, Netherland throughout the years (2019-2021) for summer months data:
Maximum monthly length of daylight 16.460 Minimum monthly length of daylight 11.726
What month reach maximum June
What month reach minimum March
What period of time in the data 6
Table 11. Some characteristics of average monthly length of daylight in Amsterdam, Netherland throughout the years (2019-2021) for summer months data
Based on the previous table, we can calculate for modelling new function:
a = (max value – min value) / 2 a = (16.460- 11.726) / 2
a = 2.367
period = 2π / b 6 = 2π / b b = 2π / 6 b = π / 3
c = 4
(the max value is at June as 4th month as summer start from March to August)
d = (max value + min value) / 2 d = (16.460 + 11.726) / 2 d = 14.093
Thus, the new function of average monthly length of daylight in Amsterdam, Netherland throughout the years (2019-2021) for summer months is:
f(x) = 2.367 cos (π / 3 (x-4)) + 14.093
Then the graph of that function by Desmos is as below:
Figure 13. Graph of f(x) = 2.367 cos (π / 3 (x-4)) + 14.093 by Desmos (0 ≤ x ≤ 6) To know the difference of actual data and value from new function, here is the table:
x Actual data Value of new function
1
11.726
11.726
2
14.166
12.9095
3
15.743
12.9095
4
16.460
16.460
5
16.072
15.2765
6
14.288
12.9095
Table 12. The difference of actual data and value from new function
Figure 14. Graph of the difference of actual data and value from new function
Then based on the difference, we can calculate the percentage of error:
Percentage of Error =
| (Value of Actual Data − Value of New Function) / Value of New Function | × 100
x Percentage of Error
1 0%
2 9.74%
3 21.98%
4 0%
5 5.22%
6 10.68%
Table 13. Percentage of error between actual data and value from new function
We need to calculate mean of percentage of error to know the mean of it:
Mean Of Percentage Of Error = Total Percentage of Error / Total X
Mean Of Percentage Of Error = 47.62 / 6 = 7.94%
Now, go to average monthly length of daylight in Amsterdam, Netherland throughout the years (2019-2021) for coldest months by Ms. Excel, it shows that the graph is similar to graph of cosine, only one amplitude in one period. Thus, we use cosine function for average monthly length of daylight in Amsterdam, Netherland (2019-2021) for coldest months.
Figure 15. Graph of average monthly length of daylight in Amsterdam, Netherland (2019- 2021) for coldest months (left) and cosine graph from internet (Openstax, 2020) (right)
Because the graph is same as previous one for summer months, we can jump to model new function. To model new function, we need to calculate some characteristics of average monthly length of daylight in Amsterdam, Netherland throughout the years (2019-2021) for coldest months data:
Maximum monthly length of daylight 12.600 Minimum monthly length of daylight 7.720
What month reach maximum September
What month reach minimum December
What period of time in the data 6
Table 14. Some characteristics of average monthly length of daylight in Amsterdam, Netherland throughout the years (2019-2021) for coldest months data
Based on the previous table, we can calculate for modelling new function:
a = (max value – min value) / 2 a = (12.600- 7.720) / 2
a = 2.440
period = 2π / b 6 = 2π / b b = 2π / 6 b = π / 3
c = 1
(the max value is at September as 1th month as coldest start from September to February)
d = (max value + min value) / 2 d = (12.600 + 7.720) / 2
d = 10.160
Thus, the new function of average monthly length of daylight in Amsterdam, Netherland throughout the years (2019-2021) for coldest months is:
f(x) = 2.440 cos (π / 3 (x-1)) + 10.160
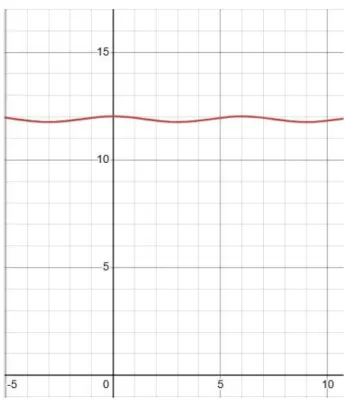
Then the graph of that function by Desmos is as below:
Figure 16. Graph of f(x) = 2.440 cos (π / 3 (x-1)) + 10.160 by Desmos (0 ≤ x ≤ 6) To know the difference of actual data and value from new function, here is the table:
x Actual data Value of new function
1
12.600
12.600
2
10.526
11.380
3
8.417
8.940
4
7.720
7.720
5
8.247
8.940
6
10.310
11.380
Table 15. The difference of actual data and value from new function
Figure 17. Graph of the difference of actual data and value from new function
Then based on the difference, we can calculate the percentage of error:
Percentage of Error =
| (Value of Actual Data − Value of New Function) / Value of New Function | × 100
x Percentage of Error
1 0%
2 7.51%
3 5.85%
4 0 %
5 7.75%
6 9.41%
Table 16. Percentage of error between actual data and value from new function
We need to calculate mean of percentage of error to know the mean of it:
Mean Of Percentage Of Error = Total Percentage of Error / Total X
Mean Of Percentage Of Error = 30.52 / 6 = 5.09%
Conclusion
The new function of average monthly length of daylight in Jakarta, Indonesia throughout the years (2019-2021) for summer months and its Mean Of Percentage Of Error are:
f(x) = 0.1335 cos (π / 3 (x-6)) + 11.8935 Mean Of Percentage Of Error = 1.106 / 6 = 0.1843%
The new function of average monthly length of daylight in Jakarta, Indonesia throughout the years (2019-2021) for coldest months and its Mean Of Percentage Of Error are:
f(x) = 0.073 cos (π / 3 (x-3)) + 12.211
Mean Of Percentage Of Error = 0.385 / 6 = 0.064%
The new function of average monthly length of daylight in Amsterdam, Netherland (2019- 2021) for summer months and its Mean Of Percentage Of Error are:
f(x) = 2.367 cos (π / 3 (x-4)) + 14.093 Mean Of Percentage Of Error = 47.62 / 6 = 7.94%
The new function of average monthly length of daylight in Amsterdam, Netherland (2019- 2021) for coldest months and its Mean Of Percentage Of Error are:
f(x) = 2.440 cos (π / 3 (x-1)) + 10.160 Mean Of Percentage Of Error = 30.52 / 6 = 5.09%
Thus, the best function with smallest error is function of average monthly length of daylight in Jakarta, Indonesia throughout the years (2019-2021) for coldest months (error: 0.064%) and the worst functiom with biggest error is function of average monthly length of daylight in Amsterdam, Netherland (2019-2021) for summer months (error: 7.94%).
Bibliography
Haese, et. al. Mathematics and Analysis Approaches SL. Second Edition. Haese Mathematics, 2019.
Openstax. Graphs of Sine and Cosine Functions. Precalculus 2e.
www.openstax.org//books/precalculus-2e/pages/6-1-graphs-of-the-sine-and-cosine- functions. Accessed 15 November 2024.