Nanometer-sized Aerosol Particles in the Atmosphere:
Measurement, Analysis, and Impact
Thesis by
Weimeng (Stephanie) Kong
In Partial Fulfillment of the Requirements for the Degree of
Doctor of Philosophy
CALIFORNIA INSTITUTE OF TECHNOLOGY Pasadena, California
2020
Defended June 19, 2020
© 2020
Weimeng (Stephanie) Kong ORCID: 0000-0002-9432-2857
All rights reserved
ACKNOWLEDGEMENTS
In the beginning, I would like to express my sincere gratitude to my advisors Dr.
John Seinfeld and Dr. Richard Flagan for guiding me well throughout this adventure and encouraging me to grow as an independent scientist. John, thank you for inspiring my passion for aerosol research and teaching me to always stay curious and keep learning; Rick, thank you for encouraging me to pursue a career in science policy and offering guidance when I need the most, whether it is a surprise visit to your office, or a random video call from the US to Finland. It has truly been a privilege to work with both of you in the past five years. Besides my advisors, my sincere thanks also go the other members of my thesis advisory committee, Dr. Zhen-gang Wang and Dr. Mitchio Okumura, for their insightful comments and encouragement. I would also like to acknowledge the generous support from the National Science Foundation, the NASA Airborne Science Program and the Naval Postgraduate School.
Many graduate students and postdoctoral researchers in the Seinfeld and Flagan lab have helped me throughout my time at Caltech. In particular, I am grateful to Yuanlong Huang, Stavros Amanatidis, and Huajun Mai for introducing me to the realm and the beauty of instrumentation development. To Dr. Tran Nguyen, although we did not overlap for a long time at Caltech, it was a great pleasure to work with you on ICARUS. Additionally, I thank Sophia Charan, Ryan Ward, Ben Schulze, Chris Kenseth, Reina Buenconsejo, Becky Schwantes, and Kelvin Bates, for all the exciting collaborative projects that we worked together. To Elyse Pennington, thank you for the company, from Claremont to Pasadena. I also appreciate all the support from my fellow labmates, Brigitte Rooney, Wilton Mui, Changhyuk Kim, Atsushi Matsuki, Buddhi Pushpawela, and Renee McVay.
I will always remember my colleagues and coworkers at CLOUD, for the sleepless nights in the T11 and for the fun we had exploring Geneva, Stockholm, Wengen, and Helsinki. I wholeheartedly appreciate all the guidance from Dr. Jasper Kirkby and Dr. Neil Donahue, and I feel very lucky to work with Mingyi Wang and Ruby Marten on the runaway growth project.
To my undergraduate advisor, role model, and friend, Dr. Lelia Hawkins, I would not be who I am today without you. I sincerely appreciate your continuous support and encouragement, from my sophomore year at Harvey Mudd College until now.
Thank you for convincing me that I should pursue a doctoral degree in atmospheric science, which is one of the best and rewarding, yet hard, experiences I have had so far.
To my friends who motivated me throughout this journey: thank you all for always supporting me, encouraging me, and making sure that I have a life outside Caltech.
Thanks to Ge Jin who has been a sturdy shelter for me ever since our freshman year in high school, regardless of how far apart we are; to the "Squad": Amis Pan, Taotao Zhou, and Yushuang Sun, for laughing and crying with me, exploring our
"La La Land" together, being my partners-in-crime, and sharing the love for Zipper, Chloe, and Infinite; to my roommates Yanzhe Zhu and Alison Wu, for being the best company during the COVID-19 crisis, for taking care of me when I was not at my best, and for all the food adventures, work-out sessions, long and deep chats, and holiday or birthday parties, whether it be 2 p.m. or 2 a.m.; to Ji Su Lee, Alex An, Obosa Obazuaye, and Bruce Yan, for being there for me with a helping hand or a word of advice whenever I need you; to Hao Xie, for being my best surfing buddy and a great listener; to Xinran Liu, Zach Wu, Xinyan Liu, and my fellow Chemical Engineering graduate students, for all the fun working together on homework and projects in our first year; to Jinglin Huang, Sam Zhang, Jing Li, Siteng Fan, and many others from the Caltech Graduate Student Council, the Caltech Y, and the Caltech International Student Program, for making my life in graduate school more enjoyable and meaningful. To Chloe, Hengheng, and Heehee, you will be missed.
Lastly, I am grateful to my parents and my grandparents for their unconditional love, patience, and encouragement. Staying 6,000 miles away from my family for ten years has not been easy for me, and yet it is just as difficult, if not more, for you.
The distance, however, did not prevent you from keeping me sane and grounded.
You mean the whole world to me. I love you.
ABSTRACT
New particle formation (NPF) from gaseous precursor vapors is frequently observed in the ambient environment and contributes to a major source of global cloud con- densation nuclei (CCN). The survival and CCN activation of newly formed particles are highly dependent on particle growth below 10 nm. Characterizing and under- standing nanoparticle early growth will therefore help to quantify the impact of NPF on cloud reflectivity and global energy budget. In this work, I first present a recently developed instrument, the Caltech nano-Scanning Electrical Mobility Spectrome- ter (nSEMS), which consists of a charge conditioner, a novel differential mobility analyzer (DMA), and a two-stage condensation particle counter (CPC). This new design, coupled with a data inversion method that combines empirical calibration and COMSOL simulation, can help to measure nanoparticle size distributions from 1.5 nm to 25 nm more accurately. This instrument was employed in the experi- ments conducted in the Cosmics Leaving OUtdoor Droplets (CLOUD) chamber at the European Organization for Nuclear Research (CERN) to better understand NPF, particle growth and survival. Multiple experimental parameters were varied to study the influence of different highly oxygenated molecules (HOMs) and inorganic trace gases, such as ammonia and nitrogen oxides on particle early growth. Experiment results have suggested a novel mechanism that may help to explain nanoparticle formation and growth in highly polluted urban environments or in the cold free troposphere. In as little as a few minutes, freshly nucleated particles as small as 2 nanometers in diameter can grow very rapidly due to simultaneous condensation of nitric acid and ammonia. This can help them to survive through the so-called
“valley of death” where they would otherwise be lost to larger particles, and in- stead allow them to grow to sizes where they are less vulnerable to loss and can continue on to sizes where they influence local air quality or climate. Further, the laboratory results of nanoparticle growth were incorporated into the Global Model of Aerosol Processes (GLOMAP) model to study the impact of this extremely rapid growth on the global CCN budget. Having realized the importance of conducting well-controlled chamber experiments and of using chamber experimental data, we established an online data infrastructure, the Index of Chamber Atmospheric Re- search in the United States (ICARUS), for storing, sharing, and using chamber data.
A combined effort of the described works contributes to better measuring the size distribution of nanoparticles and to understanding their impact on global climate.
PUBLISHED CONTENT AND CONTRIBUTIONS
W. Kong, S. Amanatidis, H. Mai, C. Kim, B. Schulze, Y. Huang, G. Lewis, S. V.
Hering, J. H. Seinfeld, and R. C. Flagan (2020). “The nano-scanning electrical mo- bility spectrometer (nSEMS) and its application to size distribution measurements of 1.5-25 nm particles”. In:Atmospheric Measurement Techniques. Submitted.
W.K. designed and conducted the experiment, assisted in building the instrument and running the simulation, analyzed the data, and wrote the manuscript for this project.
M. Wang, W. Kong∗, R. Marten, and the CLOUD Collaboration (May 2020). “Rapid growth of new atmospheric particles by nitric acid and ammonia condensation”.
In: Nature 581.7807, pp. 184–189. issn: 1476-4687. doi: 10.1038/s41586- 020-2270-4.
∗These authors contributed equally to this work. W.K. prepared the CLOUD measuring instruments, collected the data, contributed to the scientific discussion, and wrote the manuscript for this project.
R. H. Schwantes, S. M. Charan, K. H. Bates, Y. Huang, T. B. Nguyen, H. Mai, W. Kong, R. C. Flagan, and J. H. Seinfeld (2019). “Low-volatility compounds contribute significantly to isoprene secondary organic aerosol (SOA) under high- NO𝑥 conditions”. In:Atmospheric Chemistry and Physics19.11, pp. 7255–7278.
doi:10.5194/acp-19-7255-2019.
W.K. assisted in DMA operation and data analysis for this project.
S. Charan, W. Kong, R. C. Flagan, and J. H. Seinfeld (2018). “Effect of particle charge on aerosol dynamics in Teflon environmental chambers”. In:Aerosol Science and Technology52.8, pp. 854–871. doi:10.1080/02786826.2018.1474167.
W.K. designed and conducted the experiments, and analyzed the DMA data for this project.
O. V. Kalashnikova, M. J. Garay, K. H. Bates, C. M. Kenseth, W. Kong, C. D.
Cappa, A. I. Lyapustin, H. H. Jonsson, F. C. Seidel, F. Xu, D. J. Diner, and J. H. Seinfeld (2018). “Photopolarimetric Sensitivity to Black Carbon Content of Wildfire Smoke: Results From the 2016 ImPACT-PM Field Campaign”. In:
Journal of Geophysical Research: Atmospheres 123.10, pp. 5376–5396. doi:
10.1029/2017JD028032.
W.K. collected and analyzed field data for this project.
H. Mai, W. Kong, J. H. Seinfeld, and R. C. Flagan (2018). “Scanning DMA data anal- ysis II. Integrated DMA-CPC instrument response and data inversion”. In:Aerosol Science and Technology52.12, pp. 1400–1414. doi:10.1080/02786826.2018.
1528006.
W.K. conducted the experiments and assisted in data analysis and model devel- opment for this project.
D. Stolzenburg, M. Simon, A. Ranjithkumar, and the CLOUD Collaboration (June 25, 2020). “Enhanced growth rate of atmospheric particles from sulfuric acid”. In:
Atmospheric Chemistry and Physics20 (12), pp. 7359–7372. doi:10.5194/acp- 20-7359-2020.
W.K. prepared the CLOUD measuring instruments and collected the data for this project.
B. C. Schulze, S. M. Charan, C. M. Kenseth, W. Kong, K. H. Bates, W. Williams, A. R. Metcalf, H. H. Jonsson, R. Woods, A. Sorooshian, R. C. Flagan, and J. H.
Seinfeld (June 3, 2020). “Characterization of aerosol hygroscopicity over the Northeast Pacific Ocean: Impacts on prediction of CCN and stratocumulus cloud droplet number concentrations”. In:Journal of Geophysical Research: Earth and Space7 (7). doi:10.1029/2020EA001098.
W.K. collected and analyzed field data for this project.
M. Simon, L. Dada, M. Heinritzi, and the CLOUD Collaboration (Aug 3, 2020).
“Molecular understanding of new-particle formation from𝛼-pinene between−50 and +25 𝑜C”. English. In: Atmospheric Chemistry and Physics Discussions 20 (15), pp. 9183–9207. issn: 1680-7316. doi:10.5194/acp-20-9183-2020.
W.K. prepared the CLOUD measuring instruments and collected the data for this project.
TABLE OF CONTENTS
Acknowledgements . . . iii
Abstract . . . v
Published Content and Contributions . . . vi
Table of Contents . . . vii
List of Illustrations . . . ix
List of Tables . . . xxiii
Nomenclature . . . xxiv
Chapter I: Introduction . . . 1
1.1 Background and Motivation . . . 1
1.2 Content and Organization . . . 3
Chapter II: The nano-scanning electrical mobility spectrometer (nSEMS) and its application to size distribution measurements of 1.5–25 nm particles . 8 2.1 Introduction . . . 9
2.2 The nSEMS Design and System Features . . . 11
2.3 Characterization of the nSEMS . . . 15
2.4 Application to Particle Size Distribution Measurement . . . 22
Chapter III: Rapid Growth of New Atmospheric Particles by Nitric Acid and Ammonia Condensation . . . 42
3.1 Introduction . . . 43
3.2 Methods . . . 44
3.3 Results . . . 51
3.4 Atmospheric implications . . . 56
Chapter IV: Size-Dependent Nitrate Particle Growth Parameterization for Large-Scale Modeling . . . 79
4.1 Introduction . . . 79
4.2 Methods . . . 82
4.3 Results and Discussion . . . 86
4.4 Summary and Conclusions . . . 88
Chapter V: Index of Chamber Atmospheric Research in the United States . . 103
5.1 Background and Motivation . . . 103
5.2 Chamber Data Organization and Archiving Convention . . . 104
5.3 The ICARUS Online Database . . . 110
5.4 Inter-comparison Study Experimental Protocol . . . 111
5.5 Summary and Future Work . . . 113
5.6 Code availability . . . 114
Chapter VI: Conclusions and future work . . . 120
LIST OF ILLUSTRATIONS
Number Page
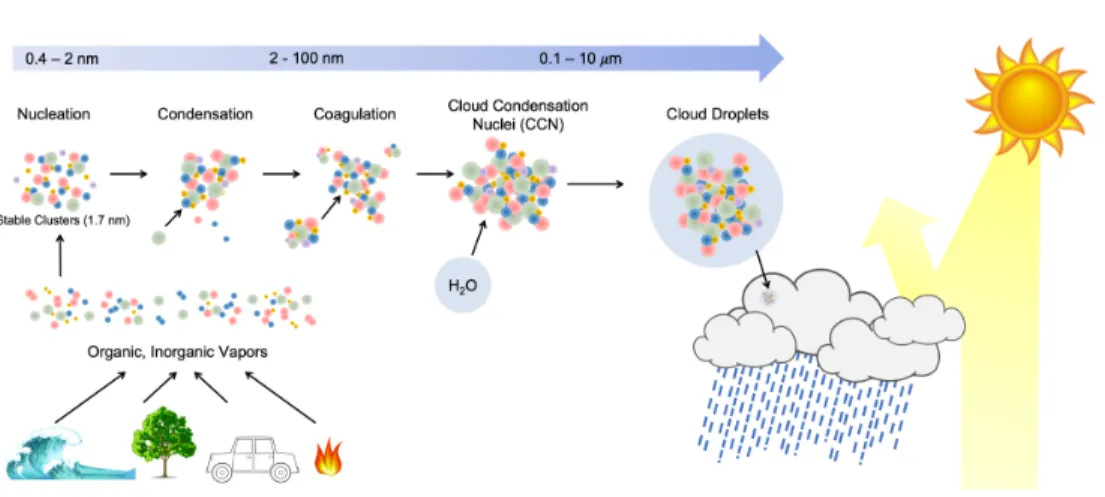
1.1 A schematic showing the complication and importance of new parti- cle formation and growth in the atmosphere. Inorganic and organic vapors from a variety of sources can form nucleating clusters which stabilize at around 1.7 nm. These clusters can further grow to fine par- ticles (CCNs) through condensation or coagulation, which involves complex physical and chemical processes that could not be fully in- corporated into current global models. The failure to capture these processes has resulted in the greatest uncertainty in estimating and interpreting Earth’s changing energy budget. . . 2 1.2 Organizational roadmap of this dissertation on investigating atmo-
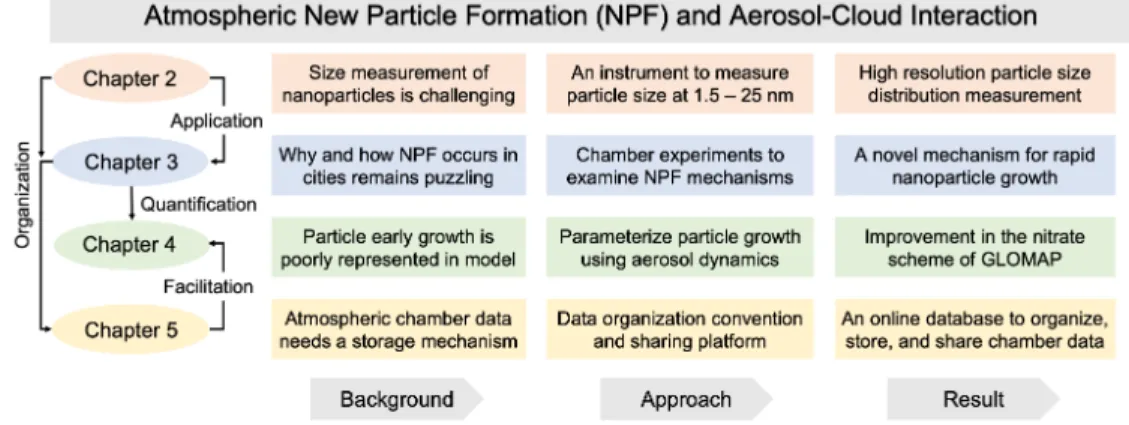
spheric new particle formation and aerosol-cloud interaction . . . 3 2.1 Schematic of the nSEMS main components; a soft x-ray charge con-
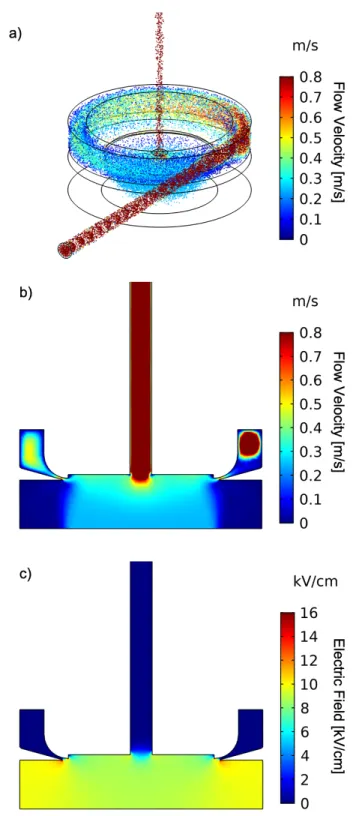
ditioner, a radial opposed-migration ion and aerosol classifier (RO- MIAC), and a two-stage condensation particle counter (CPC). Core- sampling of the input sample flow is employed to minimize particle diffusional losses in the charge conditioner. The ROMIAC is oper- ated on exponentially increasing voltage ramps between 20 V and 10,000 V of both positive and negative polarity, at 1.2 L/min and 12 L/min aerosol and cross-flows (Table 2.1). After exiting the classifier, monodisperse aerosol particles are mixed with 0.3 L/min diethylene glycol (DEG) vapor in the first stage of the CPC. This fast-mixing stage allows nanoparticles to grow through rapid vapor condensation before they enter the second, "booster" CPC stage, a modified Aerosol Dynamics Inc. (ADI) MAGICTMwater CPC operated at a flow rate of 1.0 L/min, where particles grow further and are optically detected. 25 2.2 Example of finite-element simulations of the scanning ROMIAC at
𝑄a =1.2 L/min,𝑄c =12 L/min,𝑑p=4.0 nm. (a) Particle trajectories over a 50 s upscan at 𝑡 ≈ 25 s. Cross-section view of (b) the flow velocity, and (c) electric field distribution. The magnitude of the electric field corresponds to the maximum, 10 kV, electric potential. 26
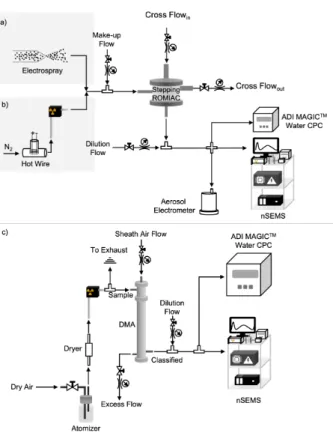
2.3 Simulated transfer function of the scanning ROMIAC with monodis- perse input particles in the 1.3 −25 nm size range. The transfer function is calculated as the ratio of particle number at the exit and the entrance of ROMIAC over a voltage scan (dashed black line) with 𝑡𝑟 𝑎𝑚 𝑝 = 50 s. Solid lines show the transfer function of the classifier (scanning ROMIAC) only; dashed lines show the simulated ROMIAC transfer function coupled with the CPC residence time dis- tribution (see Eq. (2.12)). The integrated transfer function peaks (dashed lines) are used to compute the inversion kernel for nSEMS data inversion. . . 27 2.4 The experimental setup used for the nSEMS calibration and charac-
terization in different particle size ranges. (a) < 3 nm size range:
tetra-alkyl ammonium ions produced by an electrospray were classi- fied using static ROMIAC as classifier (Rnom,nd ≈10), and an aerosol electrometer as a reference for the upstream particle number. The electrospray was operated at 3000 V and 25 cm H2O pressure. The tetra-alkyl ammonium solutions were prepared with 10 - 20 mg salt in 1.5 ml methanol. (b) 1.5−20 nm size range: A heated Nichrome wire (hotwire) was employed as aerosol source, a static ROMIAC as classifier (Rnom,nd ≈ 10), and both an aerosol electrometer and ADI MAGICTM water CPC as upstream particle counters. The hotwire was operated in the range of 5.0 - 7.0 V and 4.5 - 6.5 A. (c) 12.0−26.5 nm size range: atomized sodium chloride was employed as aerosol source, a cylindrical differential mobility analyzer (DMA) as classi- fier (𝑄a = 0.5𝐿/𝑚𝑖𝑛, 𝑄sh = 5.8𝐿/𝑚𝑖𝑛, Rnom,nd ≈ 12), and an ADI MAGICTM water CPC as upstream particle counter. Both b) and c) follow a TDMA calibration setup (Rader and McMurry, 1986), which uses a classifier at a constant voltage to select particles within a narrow distribution of sizes. . . 28
2.5 Experimental setup used to characterize the two-stage CPC detection efficiency. A heated Nichrome wire (hotwire) aerosol generator was used to provide aerosol samples. The ROMIAC was operated at static mode to provide stable, monodisperse aerosol particles for both the two-stage CPC and the aerosol electrometer. The ROMIAC aerosol and cross-flow rates were𝑄𝑎 =2.5 L/min and𝑄𝑐 =35.5 L/min. The electrometer was pre-calibrated against a TSI 3760A butanol-based CPC and an ADI MAGICTMwater-based CPC. . . 29 2.6 Detection efficiency of the two-stage CPC as a function of 𝑑p, the
mobility-equivalent particle diameter. The efficiency is corrected for the dilution due to the vapor flow. The size-dependent detection efficiency is fitted to a logistic function with fitting parameters 𝜂max
= 0.841, 𝑘 = 6.30 nm−1, and 𝑑p,0 = 1.54 nm. The fit is used to approximate the CPC detection efficiency,𝜂cpc, in the data inversion. 29 2.7 Effect of voltage ramp time, 𝑡ramp, on the nSEMS scanning transfer
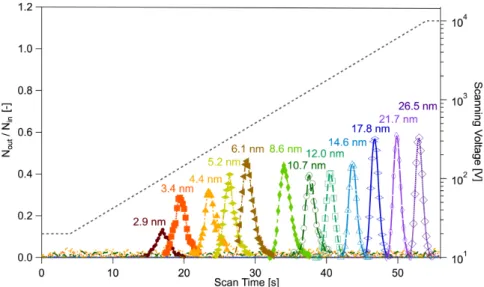
function with 𝑑p = 18 nm input particles. The nSEMS voltage is increased exponentially from 20 V to 10 kV, over ramp times within 10−1400 s, including the default𝑡ramp =50 s. CPC smearing of the transfer function increases with decreasing 𝑡ramp, and becomes very pronounced at𝑡ramp <20 s. . . 30 2.8 Experimental calibration of the nSEMS using the TDMA setup shown
in Figure 2.4. Particles entering the nSEMS were classified as described; the reported mobility-equivalent diameters were calcu- lated based on the upstream classifier operating parameters. The nSEMS was operated at the default parameters listed in Table 2.1, with 𝑡ramp = 50 s. The ratio of downstream to upstream particle counts of the nSEMS is shown as a function of time over the voltage scan, with input particles in the 2.9−26.5 nm range. The applied voltage is indicated by the dashed gray line. Only a fraction of the sizes used in the calibration are shown here for clarity; results from the complete size calibration summary are presented in Figure 2.10. . 30
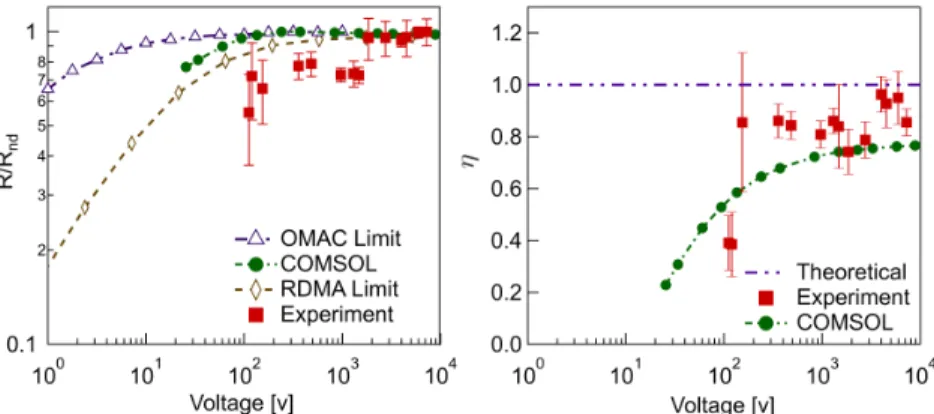
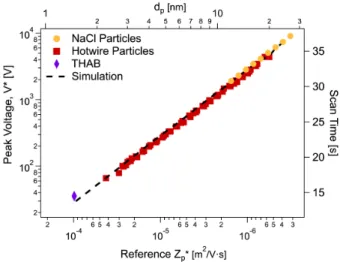
2.9 Comparison between experimental, simulated, and theoretical trans- fer functions. (a) Effect of operating voltage on classifier resolution, calculated as the actual resolution based on the full width at half maximum (FWHM) (Eq. (2.24)) overRnd, the resolution at the non- diffusive regime (>5000V). (b) Particle transmission efficiency as a function of operating voltage. Transmission efficiency, 𝜂, is calcu- lated as the ratio of the actual over the ideal area below the transfer function peak. The error bars represent one standard deviation of uncertainty from multiple experiments at one size. . . 31 2.10 nSEMS voltage at the peak transmission (𝑉∗) as a function of the in-
put reference particle mobility, 𝑍∗
p. Symbols represent experimental results with tetra-heptyl ammonium bromide (THAB), hotwire, and atomized NaCl particles produced using the setups shown in Figure 2.4. The black dotted line demonstrates the voltage at peak transmis- sion predicted by the finite-element simulations. The top axis shows the corresponding particle diameter, 𝑑p, at a given mobility, 𝑍∗
p, as defined in Eq.(2.1); the right axis shows the corresponding time in the scan. . . 31 2.11 Particle size distribution measured by the nSEMS during a nucle-
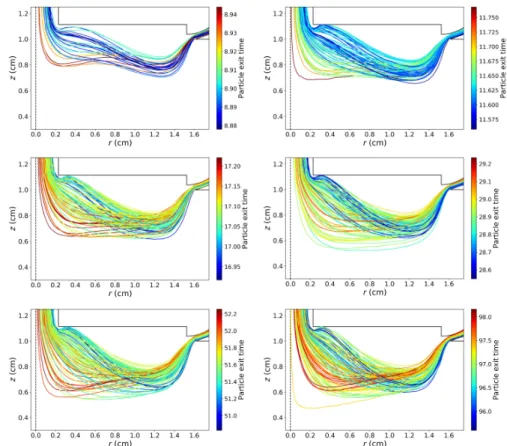
ation and growth event in the CLOUD 13 campaign with anthro- pogenic trace gases. The experiment was conducted at -10𝑜C and 60% RH, with 24 pptv HNO3, 2131 pptv NH3, 0.46 pptv H2SO4, and 0.28 pptv highly oxygenated organic molecules (HOM). The nSEMS high-voltage polarity was switched between scans to probe both pos- itively and negatively charged particles from the soft x-ray charge conditioner. A clear bimodal size distribution was observed by the nSEMS due to the rapid co-condensation of nitric acid and ammonia (M. Wang et al., 2020). The activation diameter,𝑑act, for nitric acid condensation is around 4.6 nm. . . 32 2.12 Finite-element simulations of particle trajectories at 𝑑p = 20.8 nm
with different ramp time, 𝑡ramp = 3, 6, 12, 25, 50, 100 s, from top left to bottom right, respectively. Particles were assumed to be nondiffusive. The simulation was conducted with the flow setting 𝑄x/𝑄a =10 LPM/1 LPM.The color bar indicates the time at which the particles leave the classifying ROMIAC. . . 34
2.13 CPC residence time distribution fitting using PFR-CSTR in series.
The residence time distribution in the CPC can be computed by deconvoluting the quasi-static nSEMS transfer function measured with𝑡ramp =1400 s, from that measured with𝑡ramp =50 s. CPC was modeled as a PFR in series with a CSTR and the mean residence time of the PFR,𝜏p, 0.7 s and that of the CSTR,𝜏c, is 0.2 s . . . 35 3.1 Example of a typical measurement sequence of nucleation purely
from nitric acid and ammonia with no sulfuric acid (measured as
< 5 × 104 cm−3 or 2 × 10⁻³ pptv) as a function of coordinated universal time (UTC), at 60 % relative humidity and -25 ◦C. a) Gas-phase ammonia and nitric acid mixing ratios. The run started with injecting the nitric acid and ammonia flow into the chamber to reach chosen steady-state values near 30 pptv and 1500 pptv, respectively. The nitric acid flow was increased at 5:53, 14 Nov. 2018 to prove consistency. b) Clearing field voltage and ion concentrations.
Primary ions were formed from galactic cosmic rays (GCR). The clearing field high voltage (HV) was used to sweep out small ions at the beginning of the run, and turned off at 05:21, 14 Nov. 2018 to allow the ion concentration to build up to a steady state between GCR production and wall deposition. c) Particle concentrations at two different sizes. Particles formed slowly in the chamber under
“neutral” conditions with the HV clearing field on and thus without ions present. The presence of ions (GCR condition) caused a sharp increase in the particle number concentration by about one order of magnitude, with a slower approach to steady state because of the longer wall deposition time constant for the larger particles. Particle numbers rose again with rising nitric acid. . . 60
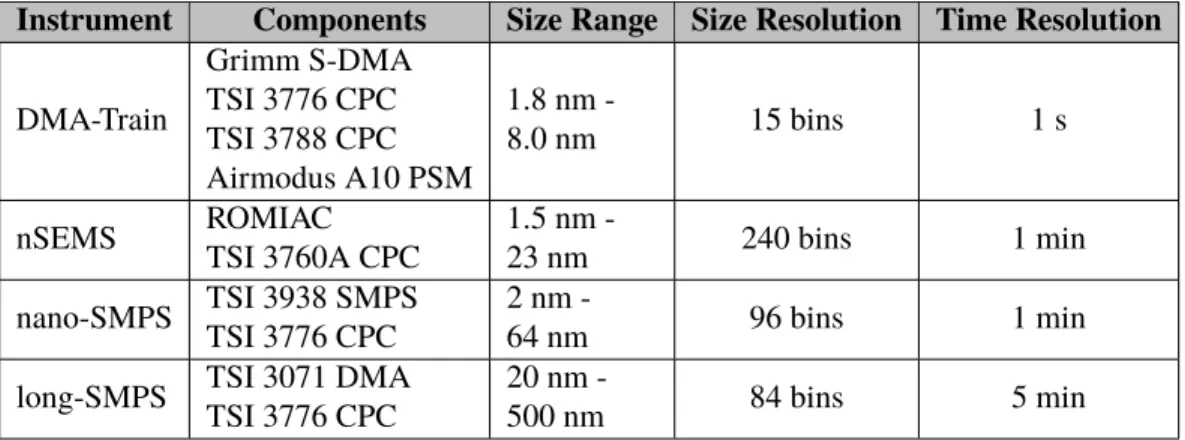
3.2 Combined particle-size distribution and total concentrations from four particle characterization instruments. (a) Combined size distri- butions,𝑛◦
𝑁 𝑑𝑝
=𝑑𝑁/𝑑log 𝑑𝑝, from four electrical mobility parti- cle size spectrometers of different, but overlapping, detection ranges.
The DMA-Train, nSEMS and nano-SMPS data were averaged every five minutes to coordinate with the long-SMPS scanning time reso- lution. The tail of the size distribution of large particles outside the detection range was extrapolated by fitting a lognormal distribution.
(b) Comparison of the integrated number concentrations from the combined size distributions in (a) with total number counts obtained from fixed cut-off size condensation particle counters. We obtained the total number concentration of particles, 𝑁𝑡(𝑑𝑝
0), above a cut-off size, 𝑑𝑝
0, by integrating the particle size distribution using (Seinfeld and Pandis, 2006): 𝑁𝑡 = ∫∞
𝑑𝑝
0
𝑛𝑁 𝑑𝑝
×𝜂UCPC d𝑑𝑝, applying the size-dependent detection efficiency, 𝜂UCPC (Mordas et al., 2008), to adjust the integrated total number concentration. We plot the total number concentrations for three different cut-off sizes: 𝑑𝑝
0 =1.7,2.5, and 3.0 nm, obtained every 5 minutes, with colored symbols as shown in the legend. We also plot measured total number concentrations from two instruments: the Airmodus A11 nCNC-system at nominal cut-off sizes𝑑𝑝
0 =1.7 and 2.5 nm and a TSI 3776 UCPC with a nom- inal cut-off size 𝑑𝑝
0 = 2.5 nm. The Airmodus A11 nCNC-system consists of an A10 PSM and an A20 CPC, which determined both the size distribution of 1-4 nm aerosol particles and the total number concentration of particles smaller than 1 𝜇m (Lehtipalo et al., 2016).
The TSI 3776 UCPC has a rapid response time and so rather than the 5-minute basis for the other points we plot the values from this instrument with a dashed curve. . . 61
3.3 Determination of growth rate using appearance time method. (a) Logarithmic interpolated time-dependent growth profiles for particles of 100 nm, 150 nm, and 200 nm diameters. Three appearance times when particle number concentrations reached 10 %, 50 %, and 90 % of their maximum are labelled with different symbols for the three different diameters, respectively. (b) Growth rate calculation for a rapid growth event (same as Fig. 3.9) above the activation diameter.
The growth rates, in nm h−1, that we report in this work are the slopes of linear fits to the 50 % appearance times calculated from all sizes above the activation diameter (the slope of the solid black line and the black circles in (b)). . . 62 3.4 Activation diameter of newly-formed particles. (a) Determination of
the activation diameter, 𝑑act, from a rapid growth event at +5◦C, in the presence of nitric acid, ammonia, and sulfuric acid. The solid orange trace in the insert indicates the first size distribution curve that exhibited a clear bimodal distribution, which appeared roughly 7 minutes after nucleation. We define the activation diameter a the largest observed size of the smaller mode. In this case, 𝑑act = 4.7 nm, which agrees well with the MABNAG simulation of ∼ 4 nm under the same conditions as shown in Fig. 3.11. (b) Activation diameter versus vapor product. Measured activation diameters at a given temperature correlate inversely with the product of nitric acid and ammonia vapors, in a log-log space. Approximately 1 order of magnitude higher vapor product is required for the same 𝑑act at +5 ◦C than at -10 ◦C because of the higher vapor pressure (faster dissociation) of ammonium nitrate when it is warmer. (c) Equilibrium particle diameter (𝑑p) at different saturation ratios of ammonium nitrate calculated according to nano-Köhler theory. Purple curves are for +5◦C and green curves are for -10◦C, as with all figures in this work. The line type shows the diameter of the seed particle (𝑑s).
The maximum of each curve corresponds to the activation diameter (𝑑act). A higher supersaturation is required for activation at lower temperature. . . 63
3.5 Saturation ratio as a function of temperature. At constant nitric acid and ammonia, a decline in temperature leads to an exponential increase in the saturation ratio of ammonium nitrate, given by the product of nitric acid and ammonia vapor concentration. With an adiabatic lapse rate of -9 ◦C/km during adiabatic vertical mixing, upward transport of a few hundred meters alone is sufficient for a saturated nitric acid and ammonia air parcel to reach the saturation ratio capable of triggering rapid growth at a few nanometers. . . 64 3.6 Comparison of growth rates and chemical composition in four simula-
tions at +5◦C and -10◦C with the thermodynamic model MABNAG.
The simulation points are shown in Fig 3.10a) with diamonds as in- dicated (open for non activating, filled for activating). Top panels (a, c, e and g) show temporal evolution of the particle diameter. Lower panels (b, d, f and h) show temporal evolution of the particle-phase chemical composition. The left-hand column (a, b and e, f) shows simulations without activation. The right-hand column (c, d and g, h) shows simulations with activation. We set the HNO3mixing ratios at 80 pptv and 400 pptv with 1500 pptv NH3 at +5 ◦C, and set the HNO3mixing ratios at 20 pptv and 0.5 pptv with 1500 pptv NH3at -10◦C, to simulate unsaturated (a, b and e, f) and supersaturated (c, d and g, h) conditions, respectively. All other conditions were held constant for the simulations, with the [H2SO4] at 2×107 cm−3and relative humidity at 60 %. Activation corresponds to a rapid increase in the nitric acid (nitrate) mass fraction; the simulations for activation conditions suggest that water activity may be an interesting variable influencing activation behavior. The activated model results (c, d and g, h) confirm that supersaturated nitric acid and ammonia lead to rapid growth of nanoparticles. The simulated activation diameter at +5◦C is∼4 nm, similar to that from the chamber experiment (4.7 nm, Fig 3.10a); at -10 ◦C the simulated activation diameter is < 2 nm, smaller than observed. . . 65
3.7 New-particle formation events observed in various remote and urban environments (see Table 3.3 for a complete set of references). (a) Growth rates (GR) versus condensation sink (CS) showing both the GR and CS are higher in polluted urban environments than in other environments. (b) Particle formation rates (J) versus a measure of particle loss via coagulation (CS·104/GR, similar to the the McMurry L parameter) showing high new-particle formation rates in urban conditions where the condensation sinks were so high compared to the growth rate that survival of nucleated particles should be very low. J and GR were calculated over the size range from a few nm to over 20 nm, except for J at Shanghai Xiao et al., 2015 and Tecamac Iida et al., 2008, which were calculated from 3 to 6 nm. The bars indicate 1𝜎total errors. . . 66 3.8 Rapid growth events observed in the CERN CLOUD chamber. (a)
Particle nucleation and growth at -10 ◦C with a mixture of 0.44 pptv sulfuric acid and 1915 pptv ammonia at 60 % RH. Particles form and grow to roughly 10 nm in 30 min. The black curve shows the linear fit to the 50 % appearance times. (b) Particle formation and growth under identical conditions but with the addition of 24 pptv of nitric acid vapor formed via NO2oxidation. Once particles reach roughly 5 nm they experience rapid growth to much larger sizes, reaching more than 30 nm in 45 min. (c) Observed growth rates after activation versus the product of measured nitric acid and ammonia levels at +5 and -10◦C. The point corresponding to (b) is a black bordered green circle and the point corresponding to Fig. 3.9 is a black bordered purple square. Growth rates at a given vapor product are significantly faster at -10 ◦C than at +5 ◦C, consistent with semi-volatile condensation that is rate-limited by ammonium nitrate formation. Error bars are 95 % confidence limits on the fitting coefficients used to determine growth rates. The overall systematic scale uncertainty of ± 10 % on NH3 mixing ratio and ± 25 % on HNO3mixing ratio are not shown. . . 67
3.9 Chemical composition during a rapid growth event at +5 ◦C and 60
% RH, indicated in Fig. 3.8 with a black outlined purple square. (a) Gas-phase nitric acid, ammonia and sulfuric acid mixing ratios versus time in an event initiated by SO2oxidation, with constant nitric acid and ammonia. (b) Particle number distributions versus time showing a clean chamber, followed by nucleation after sulfuric acid formation and rapid growth once particles reach 2.3 nm. Black curves are the linear fit to the 50 % appearance times. (c) Particle volume distributions from the same data, showing that 200 nm particles dominate the mass after 15 minutes. (d) FIGAERO thermogram from a 30 minute filter sample after rapid growth. Particle composition is dominated by nitrate with a core of sulfate, consistent with rapid growth by ammonium nitrate condensation on an ammonium sulfate (or bisulfate) core (note the different 𝑦 scales; the instrument is not sensitive to ammonia). A thermogram from just before the formation event shows no signal from either nitrate or sulfate, indicating that vapor adsorption did not interfere with the analysis. . . 68
3.10 Phase space for rapid growth and nucleation. (a) Ammonium nitrate saturation ratios versus gas-phase nitric acid and ammonia at 60 % RH. Solid (slope = -1) lines are S = 1 (bold), 5 (dashed), and 25 (dotted) at -10 ◦C (green) and +5 ◦C (purple). The slope = +1 dot- dashed gray line indicates a 1:1 ammonia:nitric-acid stoichiometry;
the phase space to the upper left is nitric-acid limited. Observed activation diameters for measured nitric acid – ammonia pairs are plotted as numbers inside solid circle and square symbols; open symbols show no activation. Activation only occurs for 𝑆 > 1 and the activation diameter decreases as 𝑆 increases. Points for MAB- NAG simulations are shown with open triangles for no activation and filled triangles for activation; simulations indicated with diamonds are shown in detail in Fig. 3.11 and Fig. 3.6. Points for runs shown in Figs 3.8 and 3.9 are emphasized with a thick black outline. (b) Ammonia and nitric acid vapor during a pure ammonium nitrate nu- cleation scan from -16 to -24 ◦C. (c) Particle formation rates (𝐽1.7) during the nucleation scan, showing a strong inverse relationship with temperature at constant HNO3 and NH3, with H2SO4 < 0.002 pptv and RH starting at 60 % and ending at 40 %. The bars indicate 30
% estimated total error on the nucleation rates, although the overall systematic scale uncertainties of±10 % on NH3mixing ratio and± 25 % on HNO3mixing ratio are not shown. . . 69
3.11 Conditions for rapid growth. Persistent supersaturations of ammonia and nitric acid with respect to ammonium nitrate will be sustained by inhomogeneity for high source-strength urban conditions. This will be sufficient to accelerate particle growth in the 1-10 nm range, where survival is threatened by high coagulation surface area from high pollution. (a) Concept for urban conditions, where inhomo- geneity in ammonia and nitric acid vapor concentrations as well as temperature are caused by non-uniform sources and large-scale ed- dies. (b) Particles nucleate and grow slowly as (base stabilized) sulfate (red). Activation size (dashed curve corresponding to x-axis) depends on the ammonium-nitrate saturation ratio (qualitatively on y axis). Available gas-phase nitric acid can exceed sulfuric acid by a factor of 1000, so modest supersaturation drives rapid growth (blue) above an activation diameter determined by particle curvature (the Kelvin term, indicated as a dashed curve). (c,d) Monodisperse thermodynamic growth calculations (MABNAG) for high and low ammonium-nitrate saturation ratios corresponding to (b) and also the closed and open diamonds towards the upper right in Fig. 3.10a. For a saturation ratio near 4, activation is predicted to occur near 4 nm, consistent with our observations. . . 70 4.1 Annual mean SO2 concentration in pptv predicted by the current
GLOMAP model (a) at the surface, (b) at 10 km, and (c) latitude vs altitude in km, with an annual mean over longitudes. . . 89 4.2 Annual mean NH3 concentration in pptv predicted by the current
GLOMAP model (a) at the surface, (b) at 10 km, and (c) latitude vs altitude in km, with an annual mean over longitudes. . . 90 4.3 Annual mean HNO3 concentration in pptv predicted by the current
GLOMAP model (a) at the surface, (b) at 10 km, and (c) latitude vs altitude in km, with an annual mean over longitudes. . . 91 4.4 Annual mean particle number concentration in cm−3predicted by the
current GLOMAP model (a) at the surface, (b) at 10 km, and (c) lat- itude vs altitude in km, with an annual mean over longitudes. Since particle number concentration decreases with altitude, it already sug- gests that there is not enough nucleation represented in the model in the upper troposphere. . . 92
4.5 Molecular ratio of ammonium to sulfate (NH+4/SO2−4 ) predicted by GLOMAP in particle phase for (a) nucleation mode particles at the surface, (b) accumulation mode particles at the surface, (c) accu- mulation mode particles at 10 km altitude, (d) accumulation mode particles at 10 km altitude. Since the ratio of NH+4/SO2−4 can be over 20 at the surface (a), it indicates that there are a large number of nitrate particles in the nucleation mode, which are yet to be included.
Ammonia is limited in remote oceans and Antarctica at the surface, suggesting not much nitrate particle may be formed at higher altitude. 92 4.6 Nitrate particulate mass fraction predicted by the GLOMAP simu-
lation for (a) particles in nucleation mode at the surface in January;
(b) particles in accumulation mode at the surface in January; (c) par- ticles in nucleation mode at 10 km altitude in January; (d) particles in accumulation mode at 10 km altitude in January; (e) particles in nucleation mode at the surface in July; (f) particles in accumulation mode at the surface in July; (g) particles in nucleation mode at 10 km altitude in July; (h) particles in accumulation mode at 10 km altitude in July. . . 93 4.7 Comparison of 2016 daily mean total particle number concentra-
tions to Atom1 observations. (a) Five-minute-averaged observation data from the NASA Atom1 campaign plotted as total number con- centrations against latitude. The color denotes the altitudes of the measurement; (b) Similar to (a), but the color indicates the value of the ratio of simulated to observed particle number concentration with blue meaning that the model underestimates particle numbers, and red meaning it overestimates. 577 out of 996 data points have sim- ulated number concentrations a factor of 2 or more below observed number concentration; 105 have a factor 2 or more above. . . 94
4.8 Rapid growth events observed in the CLOUD chamber. (a) (b) con- densation sinks calculated for the two events. (c) Particle nucleation and growth at 5oC from a mixture of 0.2 pptv sulfuric acid, 3 ppbv ammonia, 10 ppbv HONO, 10 pptv dimethylamine at 60% RH under a constant CS of 0.06 s−1. Nanoparticles grow to roughly 4.3 nm with a growth rate of 5.5 nm/h in 30 min before they lost to the larger particles. (d) Particle formation and growth under similar sulfuric acid and HONO conditions, but with 150 pptv dimethylamine, 8 ppbv ammonia, and the addition of 600 pptv HNO3. The nucleation took place when the CS decreases from 0.08 s−1 to 0.025 s−1 and was more intense due to the extra dimethylamine. The existence of HNO3 resulted in an extremely fast growth with a growth rate above 100 nm/h, 80 min after nucleation started, growing particles from 5 nm to 50 nm in 30 min. . . 95 4.9 Growth rates after activation versus the excess vapor product of mea-
sured nitric acid and ammonia levels at+5oC and−10oC. The growth rates are the slopes of linear fits to the 50% appearance times calcu- lated from all sizes above the activation diameter. The excess vapor product (denoted by EVP in the fitting equation), is calculated using the dissociation constant as described in Eq.(4.12). . . 96 4.10 Observed activation diameters versus saturation ratio, with a temper-
ature dependence. The activation diameters are the sizes at which the rapid growth from nitric acid and ammonia co-condensation take place. The experimental data at+5oC and−10oC are fitted using the BFGS algorithm with two temperature dependent terms, as shown in Eq.4.13. Predictions of the Kelvin diameters are given in solid lines from−10oC to 20oC using the optimization results. . . 97 5.1 A list of default experiment procedures in the ICARUS timeline
generator . . . 116 5.2 A simplified entity-relationship diagram for the Caltech Atmospheric
Chamber. . . 116
LIST OF TABLES
Number Page
2.1 Default nSEMS operating parameters, optimized for measurements of NPF events and nanoparticle growth. These settings enable particle size distribution measurements in the range of 1.5 - 25 nm, with a duty cycle of 1 min and a size classification resolution ofRnom,nd= 10. 33 3.1 Specifications of the four particle sizing instruments employed in this
work. . . 48 3.2 Conditions for all nucleation and growth experiments, and nano-
Köhler simulations discussed in this work. . . 52 3.3 A summary of ambient particle formation rates (J), growth rates (GR)
and condensation sinks (CS) in various remote and urban environments. 53 5.1 Institutions participating in ICARUS and their chamber characteris-
tics. All the listed chambers have humidity controls and are primarily operated in batch mode. . . 114 5.2 Chamber characteristics for the Caltech Near Bag, Far Bag, and
CPOT. Note that each chamber can be cleaned with air flushing, and CPOT can also be cleaned with solvent when necessary. The three chambers use the same temperature (20 - 45 ◦C) and relative humidity (5 - 100%) controls. The mixing of the two Teflon chambers is accomplished by injecting additional inflow air to the chamber. . . 115 5.3 Proposed experiments for the ICARUS inter-comparison study with
experimental details and leading research groups. . . 115 5.4 ICARUS experiment data formatting convention with the file con-
verting tool. Since the data reporting format of the HR-ToF-AMS and the PILS+LC-ESI-MS can vary given the different scientific na- ture of the experiments, there is currently no convention established for these two instruments for Caltech chamber users. . . 115
NOMENCLATURE
CERN. European Organization for Nuclear Research.
CI-APi-TOF. Chemical Ionization with the Atmospheric Pressure interface Time- Of-Flight Mass Spectrometer, often used for molecular sulfuric acid detec- tion.
CLOUD. Cosmics Leaving OUtdoor Droplets, an experiment being run at CERN to investigate the microphysics between galactic cosmic rays (GCRs) and new aerosol particles under controlled conditions.
CPC. Condensation Particle Counter, a particle counter that detects and counts aerosol particles by first growing them by condensing supersaturated vapors on particle seeds.
CS. Condensation sink, a parameter to quantify the rate of vapor condensation onto an existing aerosol population.
DMA. Differential Mobility Analyzer, the classifier component in an SEMS or SMPS system that selects particles of different sizes.
FIGAERO-CIMS. Chemical Ionization Time-Of-Flight Mass Spectrometer equipped with a Filter Inlet for Gases and AEROsols, a mass spectrometer that mea- sures aerosol composition.
GCR. Galactic cosmic rays, high-energy protons and atomic nuclei that move through the space.
GLOMAP. Global Model of Aerosol Processes, a box model that studies aerosol microphysics on a large scale.
GR. Growth rates, a parameter to describe how fast nanoparticles grow, given in nm/h.
HOM. Highly oxygenated molecules, formed from autoxidation involving peroxy radicals arising from volatile organic compounds.
ICARUS. Index of Chamber Atmospheric Research in the United States, an online database for atmospheric chamber data storing, sharing, and using.
MABNAG. Model for Acid-Base Chemistry in Nanoparticle Growth, a model that studies the effect of salt formation on nanoparticle growth.
NPF. New particle formation, a process where nanometer-sized atmospheric par- ticles form from gaseous reactions.
PTR-TOF-MS. Proton Transfer Reaction Time-of-Flight Mass Spectrometry, an instrument that detects volatile organic compounds.
SEMS. Scanning Electrical Mobility Spectrometer, an instrument that uses electri- cal mobility to measure aerosol particle diameters, also known as a Scanning Mobility Particle Sizer, or SMPS.
VOC. Volatile organic compounds, organic chemicals that have high vapor pres- sures at ambient conditions.
C h a p t e r 1
INTRODUCTION
1.1 Background and Motivation
A more accurate estimation of cloud formation and cloud reflectivity can substan- tially improve our understanding of global solar radiation and climate (IPCC, 2013).
Because most clouds owe their existence to aerosols, which can serve as tiny seeds for cloud formation, aerosol-cloud interactions remains one of the most important phenomena that must be quantified to evaluate the multiplex impact of atmospheric composition on climate.
Aerosols are minute solid or liquid particles suspended in the air, and they play an important role in the overall global energy balance and climate. They can scatter or absorb sunlight and thus directly affect the Earth’s solar radiation. In addition, because aerosols participate in cloud formation, they can indirectly alter cloud reflectivity and Earth’s albedo (IPCC, 2013). Aerosol particles can exist in sizes from 10−4 to 10 𝜇m, falling under the following categories: nucleation mode (<
10 nm), Aitken mode (10 to 100 nm), accumulation mode (100 nm to 1𝜇m), and coarse mode (> 1 𝜇m) (Seinfeld and Pandis, 2006). Once aerosol particles are in the accumulation mode, they can act as cloud seeds for water vapors to condense on, which are called cloud condensation nuclei (CCNs). Size, composition, and other properties of CCNs can alter cloud brightness and reflectivity (Albrecht, 1989;
Penner et al., 2004). Bright clouds block sunlight from reaching Earth’s surface, and dark clouds keep the Earth warm. In spite of their small sizes, particles in the nucleation mode have been estimated to contribute to half of the global CCN budget (Merikanto et al., 2009). These nanoparticles are formed through the nucleation of atmospheric condensable vapors and can grow from clusters to large size CCNs through condensation or coagulation, and thus influence cloud formation and climate (Fig1.1).
Atmospheric nucleation and new particle formation (NPF) are frequently observed across the globe: in deserted forests, highly polluted megacities, coastal sites, polar regions, or the remote free troposphere (Kulmala et al., 2004; Sihto et al., 2011;
Guo et al., 2014; Kerminen et al., 2018; Lee et al., 2019). Field observations have shown that NPF in the free troposphere and its subsequent downward transport to the
Figure 1.1: A schematic showing the complication and importance of new particle formation and growth in the atmosphere. Inorganic and organic vapors from a variety of sources can form nucleating clusters which stabilize at around 1.7 nm.
These clusters can further grow to fine particles (CCNs) through condensation or coagulation, which involves complex physical and chemical processes that could not be fully incorporated into current global models. The failure to capture these processes has resulted in the greatest uncertainty in estimating and interpreting Earth’s changing energy budget.
boundary layer has a significant impact on the CCN concentrations and low clouds formation, which is a major uncertainty source for calculating the Earth’s radiative forcing (IPCC, 2013; Rose et al., 2017). For example, a rapid downward transport of nanoparticles was observed during the GoAmazon2014/5 campaign through precipitation, which influenced cloud properties in the pristine boundary layer (Wang et al., 2016). In addition to the campaign in the Amazon, the NASA Atmospheric Tomography Mission results indicated that NPF in the upper troposphere persists at all longitudes across the tropical band of the globe, which covers about 40% of Earth’s surface, and is a globally important source of CCNs in the lower troposphere (Williamson et al., 2019). Other than its impact on clouds, NPF is believed to be a major contributor to urban smog and haze formation in populated cities, which raises significant health concerns that are related to human exposures to particulate matter (Anderson et al., 2012; Guo et al., 2014; Yao et al., 2018). Compared to large particles, these tiny nanoparticles freshly formed from nucleation are believed to exert the most severe health effects, since they are small enough to be deposited in the pulmonary region or to penetrate into bloodstream (Lee et al., 2019).
Given the significance of NPF in both climate and human health, it is crucial for us scientists to better study this process and to evaluate its impact. Despite the rigorous efforts that have been made to measure, characterize, and understand NPF, there are
many challenges lying ahead. For instance, particle-size distribution measurement in the low-nanometer regime suffers great uncertainties due to the low transmis- sion efficiencies in conventional sizing instrument because small particles are more prone to high diffusional losses (Jiang et al., 2011). Although field observations have provided valuable information on NPF, the mechanism of nucleation and NPF can only be understood if isolated from other atmospheric processes, which will require precisely controlled laboratory setup with state-of-the-art measurement techniques.
The explicit detailed schemes of NPF and its subsequent growth observed in labora- tory are often too computationally expensive to include in large-scale modeling. Yet the current simplified representation of NPF and its contribution to cloud formation in current models cannot fully capture the importance of NPF on a global scale.
Compared to the measurement data, models tend to underestimate the magnitude of NPF and subsequent growth of nanoparticles to CCN sizes (Williamson et al., 2019).
1.2 Content and Organization
In an effort to overcome the above challenges in understanding NPF and its impact, I have dedicated my dissertation work, included in the chapters and appendices of this thesis, to better measure, characterize, and quantify nanoparticle formation and its early growth (Figure 1.2). This dissertation aims to present advances in nanopar- ticle measuring techniques that can be used both in laboratory and field studies, demonstrate significant findings from well-controlled environmental chamber stud- ies, bridge the discrepancies between modeling and observations, and establish a new platform to better organize, share, and use environmental chamber data.
Figure 1.2: Organizational roadmap of this dissertation on investigating atmospheric new particle formation and aerosol-cloud interaction
Chapter 2: Instrumentation Development
Nanoparticle size distributions measured from conventional differential mobility analyzers often suffer great uncertainties in the small size range (< 10 nm) due to particle diffusional loss and biased data interpretation. The Caltech nano-Scanning Electrical Mobility Spectrometer (nSEMS) has demonstrated a better instrument performance in nanometer-sized range with a completely new design. The nSEMS consists of a soft x-ray charge conditioner, a novel particle classifier, and a two- stage condensation particle counter (CPC). The accuracy of data interpretation and inversion has also been enhanced using detailed numerical modeling of flows, fields, and particle trajectories. I characterized each individual component of the nSEMS and validated the integrated transfer function with empirical measurements. The viability of nSEMS has been proved by its successful application in experiments conducted in the Cosmics Leaving OUtdoor Droplets (CLOUD) chamber at the European Organization for Nuclear Research (CERN). The size distribution results acquired from the nSEMS during the CLOUD experiments have greatly improved our understanding of urban NPF.
Chapter 3: Laboratory Studies
How nanoparticles survive in urban environments remains one of the most puzzling topics in the field. If urban particle growth rates are similar to those found in cleaner environments (1-10 nm/h), then conventional understanding suggests that new urban particles should be rapidly scavenged by the high concentration of pre-existing particles. In order to better understand the chemical and physical processes of NPF in cities and isolate other factors that may affect nanoparticle growth, we conducted a number of experiments under various atmospheric conditions in the well-controlled CLOUD chamber. Multiple experimental parameters were varied to study the influence of different highly oxygenated molecules (HOMs) and inorganic trace gases, such as ammonia and nitrogen oxides on particle early growth. Our results suggest that below about +5𝑂C, nitric-acid and ammonia vapors can condense onto freshly nucleated particles as small as a few nanometers in diameter and the resulting particle growth rates can be extremely high, reaching well above 100 nm/h. This phenomenon is very likely to occur in inhomogeneous urban settings, especially in wintertime with strong local sources such as traffic, as well as vertical mixing. The results from this CLOUD study may help to explain how freshly nucleated particles can be shepherded through the smallest size range where they are most vulnerable to scavenging loss and survive to form larger particles even in highly polluted cities.
Chapter 4: Modeling and Impact
The explicit physical and chemical processes of nanoparticle growth derived from chamber studies, including those from CLOUD, are often too computationally ex- pensive to include in large-scale modeling. To achieve the best trade-off between computation cost and accuracy, nanoparticle early growth results from CLOUD experiments have been parameterized using thermodynamic and kinetic principles.
In order to capture the full picture of nanoparticle growth, survival, and activa- tion, size distribution information from the nSEMS were compared and combined with other particle sizing instruments from CLOUD to obtain a continuous particle growth profile over the range from 1 to 500 nm. Nanoparticle growth was modeled as gas-to-particle condensational growth to compare with experimental measurements.
The resulting parameter was defined as the condensational flux that contributes to particle growth. I then evaluated the parameter derived from the CLOUD experi- ments by incorporating it into the Global Model of Aerosol Processes (GLOMAP), which introduces a new convention of describing particle growth in box models.
Chapter 5: Database Development
The CLOUD experiments demonstrated the importance of conducting chamber experiments to study aerosols as they help to constrain experimental variables and to understand complicated processes and mechanisms. In order to better store, share, and use atmospheric chamber data in the U.S., the Index of Chamber Atmospheric Research in the United States (ICARUS) project aimed to create a sustainable web- based infrastructure for chamber data archiving and organization. An open-access website was established by our project to upload and store atmospheric chamber experimental data. I have also developed multiple software tools, experimental protocols, and data conventions to facilitate the data organization process.
References
B. A. Albrecht (Sept. 1989). “Aerosols, Cloud Microphysics, and Fractional Cloudi- ness”. en. In:Science245.4923, pp. 1227–1230. issn: 0036-8075, 1095-9203. doi:
10.1126/science.245.4923.1227. (Visited on 05/06/2020).
J. O. Anderson et al. (2012). “Clearing the Air: A Review of the Effects of Particulate Matter Air Pollution on Human Health”. In:Journal of Medical Toxicology8.2, pp. 166–175. doi:10.1007/s13181-011-0203-1.
S. Guo et al. (2014). “Elucidating severe urban haze formation in China”. In:Pro- ceedings of the National Academy of Sciences111.49, pp. 17, 373–17, 378. issn:
0027-8424. doi:10.1073/pnas.1419604111.
IPCC (2013).Climate Change 2013: The Physical Science Basis. Cambridge Uni- versity Press, 32 Avenue of the Americas, New York, NY 10013-2473, USA.
J. Jiang et al. (2011). “Transfer Functions and Penetrations of Five Differential Mobility Analyzers for Sub-2 nm Particle Classification”. In: Aerosol Science and Technology45.4, pp. 480–492. doi:10.1080/02786826.2010.546819.
V.-M. Kerminen et al. (Sept. 2018). “Atmospheric new particle formation and growth: review of field observations”. In:Environmental Research Letters13.10, pp. 103, 003. doi:10.1088/1748-9326/aadf3c.
M. Kulmala et al. (Mar. 2004). “Formation and growth rates of ultrafine atmospheric particles: A review of observations”. In:Journal of Aerosol Science35, pp. 143–
176. doi:10.1016/j.jaerosci.2003.10.003.
S.-H. Lee et al. (2019). “New Particle Formation in the Atmosphere: From Molecular Clusters to Global Climate”. In:Journal of Geophysical Research: Atmospheres 124.13, pp. 7098–7146. doi:10.1029/2018JD029356.
J. Merikanto et al. (Nov. 2009). “Impact of nucleation on global CCN”. In:Atmo- spheric Chemistry and Physics9. doi:10.5194/acp-9-8601-2009.
J. E. Penner et al. (Jan. 2004). “Observational evidence of a change in radiative forcing due to the indirect aerosol effect”. en. In:Nature427.6971, pp. 231–234.
issn: 1476-4687. doi:10.1038/nature02234. (Visited on 05/06/2020).
C. Rose et al. (2017). “CCN production by new particle formation in the free troposphere”. In:Atmospheric Chemistry and Physics17.2, pp. 1529–1541. doi:
10.5194/acp-17-1529-2017.
J. H. Seinfeld and S. N. Pandis (2006).Atmospheric Chemistry and Physics. 2nd ed.
Hoboken, New Jersey: John Wiley & Sons.
S.-L. Sihto et al. (2011). “Seasonal variation of CCN concentrations and aerosol activation properties in boreal forest”. In: Atmospheric Chemistry and Physics 11.24, pp. 13269–13285. doi:10.5194/acp-11-13269-2011.
J. Wang et al. (2016). “Amazon boundary layer aerosol concentration sustained by vertical transport during rainfall”. In: Nature 539.7629, pp. 416–419. doi:
10.1038/nature19819.
C. J. Williamson et al. (2019). “A large source of cloud condensation nuclei from new particle formation in the tropics”. In:Nature 574.7778, pp. 399–403. doi:
10.1038/s41586-019-1638-9.
L. Yao et al. (2018). “Atmospheric new particle formation from sulfuric acid and amines in a Chinese megacity”. In: Science 361.6399, pp. 278–281. doi: 10 . 1126/science.aao4839.
C h a p t e r 2
THE NANO-SCANNING ELECTRICAL MOBILITY
SPECTROMETER (NSEMS) AND ITS APPLICATION TO SIZE DISTRIBUTION MEASUREMENTS OF 1.5–25 NM PARTICLES
W. Kong, S. Amanatidis, H. Mai, C. Kim, B. Schulze, Y. Huang, G. Lewis, S. V.
Hering, J. H. Seinfeld, and R. C. Flagan (2020). “The nano-scanning electrical mo- bility spectrometer (nSEMS) and its application to size distribution measurements of 1.5-25 nm particles”. In:Atmospheric Measurement Techniques. Submitted.
abstract
Particle size measurement in the low nanometer regime is of great importance to the study of cloud formation and to better understand aerosol-climate interaction.
Here we present the design, modeling, and experimental characterization of the nano-Scanning Electrical Mobility Spectrometer (nSEMS), a recently developed instrument that probes particle physical properties in the 1.5 - 25 nm range. The nSEMS consists of a charge conditioner, a novel differential mobility analyzer, and a two-stage condensation particle counter (CPC). The charge conditioner employs a soft x-ray bipolar ion source in a compact housing designed to optimize both nanoparticle charging and transmission efficiency. The mobility analyzer, a radial opposed migration ion and aerosol classifier (ROMIAC), can classify nanometer- sized particles with minimal degradation of its resolution or diffusional losses.
The ROMIAC operates on a dual high-voltage supply with fast polarity-switching capability to minimize sensitivity to variations in the chemical nature of the ions used to charge the aerosol. Particles transmitted through the charge conditioner and mobility analyzer are measured using a two-stage CPC. They are first activated in a fast-mixing diethylene glycol (DEG) stage before being counted by a second detection stage, an ADI MAGICTM water-based CPC. The transfer function of the integrated instrument is derived from both finite-element modeling and experimental characterization. The nSEMS performance has been evaluated during measurement of transient nucleation and growth events in the CLOUD atmospheric chamber at CERN. We show that the nSEMS can provide high time and size resolution measurement of nanoparticles, and can capture the critical aerosol dynamics of newly formed atmospheric particles.
2.1 Introduction
Aerosol particles can either be emitted into the atmosphere directly from primary sources, or generated through the nucleation of atmospheric condensable precursor vapors. Atmospheric nucleation, or new particle formation (NPF), is frequently observed across the globe under diverse environmental conditions, ranging from populated urban centers (Dunn et al., 2004; Z. Wang et al., 2017; Yao et al., 2018;
M. Wang et al., 2020) to remote areas such as forests or oceans (O’Dowd et al., 2002; Bonn and Moortgat, 2003; Paasonen et al., 2010; Dall’Osto et al., 2017), as well as in the free troposphere (Kulmala et al., 2004; Kerminen et al., 2018;
Lee et al., 2019). Large-scale simulations and parameterizations suggest that NPF may generate half of the global cloud condensation nuclei (CCN, Merikanto et al., 2009; Gordon et al., 2017). In addition to their climate impact, ultrafine particles formed by nucleation can also have disproportionate adverse effects on human health (Brown et al., 2000).
To understand the formation and subsequent growth of freshly nucleated particles in the atmosphere and to evaluate their impact on climate and human health requires measurement techniques that can enable particle size distribution measurements in the low-nanometer regime. Nanoparticle sizing is often achieved using electrical mobility to separate charged particles according to the velocities with which they migrate in an electric field. The differential mobility analyzer (DMA) has long been the most widely used instrument to measure size distribution of sub-micron (< 1𝜇m) aerosol particles (Knutson and Whitby, 1975; Flagan, 1998). Most DMAs separate charged aerosol particles of different electrical mobilities by applying an electric field between two coaxial electrodes that are parallel to a particle-free sheath flow.
Classified particles from the DMAs are typically counted by a condensation particle counter (CPC) that uses supersaturated vapors to grow particle seeds before detection (Quant et al., 1992). This integrated instrument initially used step-wise variation in the voltage. By keeping the voltage applied between the electrodes constant at each step, particles are transmitted throughout the entire system under a steady field profile before they are counted by the CPC. This static-mode measurement system is referred to as the DMPS, or the differential mobility particle sizer (Fissan et al., 1983). However, since the DMPS often requires the system to reach a steady- state before any reliable measurement can be made, the relatively long residence time of the particles in the DMA makes it less ideal to capture transient aerosol activities. By continuously changing the voltage through an exponential ramp, the scanning electrical mobility spectrometer (SEMS; also known as the Scanning
Mobility Particle Sizer, SMPS) considerably accelerates the particle classification using electrical mobility (S. C. Wang and Flagan, 1990).
While the traditional SEMS can only detect particles with mobility-equivalent di- ameters above 10 nm, many efforts have focused on extending the classification range to smaller aerosol particles. The first major step in this direction was the Vi- enna short-column DMA that measured nanoparticles down to 3.5 nm (Winklmayr et al., 1991); the "nano-DMA", modified from the traditional long-column DMA design, can measure particle size distribution in the range of 3 - 50 nm (D. .-.-R.
Chen et al., 1998); a radial DMA (RDMA) that classifies particles in a radial flow toward the center of parallel disk electrodes also demonstrated a high detection efficiency for particles between 3 - 10 nm (S.-H. Zhang et al., 1995). Both designs have been extended to smaller sizes. Through meticulous aerodynamic design and very large sheath flow rates, up to 1000 L/min, Rosell-Llompart et al. (1996) re- fined the Vienna DMA into one instrument suitable for particle classification down to as small as 1 nm. Brunelli et al. (2009) developed an RDMA that could also classify 1 nm particles at much more modest flow rates, albeit at lower resolution.
An opposed migration aerosol classifier (OMAC) design uses a particle-free cross flow instead of the parallel sheath flow in the DMAs to balance particle electrical migration. Since the aerosol being classified fills the space between the electrodes, rather than occupying only a narrow slice of that space as in a DMA, this changes of the scaling for where diffusion begins to degrade the resolution of the classifier, thereby enabling classification at lower voltages, or operation at higher resolution than is possible with conventional DMAs (Flagan, 2004; Downard et al., 2011). The radial opposed migration ion and aerosol classifier (ROMIAC), a radial form of the OMAC, was prototyped and proved its capacity of measuring sub-2 nm particles or ions and even separating peptide stereoisomers owing to its high resolving power (Mui et al., 2013; Mui et al., 2017). The challenges with measuring particles in the low-nanometer regime lie not only in classification, but also in particle detection.
Some single-stage CPCs have been operated at sufficiently high supersaturation to activate particles as small as 1 nm diameters, but in the experiment that requires high radiation environment for which this instrument was developed, this can lead to nucleation within the CPC. Therefore, we took a more conservative approach that has proven robust and effective for sub-10nm particle detection, namely a two-stage CPC, in which the first stage employs a low vapor pressure working fluid, typically diethylene glycol (DEG) that can activate small particles with minimal risk of ho- mogeneous nucleation (Iida et al., 2009). Owing to the low vapor pressure, the
first stage does not grow particles to optically detectable size, so a second "booster"
stage is used to grow the activated clusters and optically detect them. The second stage is typically a conventional CPC. The operation of two activation and growth systems in series compounds another challenge to SEMS/SMPS measurements; the residence time within the CPC can distribute counts of particles that exit the DMA over many time bins (Russell et al., 1995; Collins et al., 2002), thereby degrading the resolution of the instrument, especially for tiny nanoparticles for which resolution may already have been compromised due to diffusional broadening. This effect becomes increasingly important at scan rates that are fast relative to the response time of the CPC. Therefore, CPCs with a narrow distribution of residence times are preferred for a SEMS that targets the low-nanometer range.
In this work we show the development of a nano-scanning electrical mobility spec- trometer (nSEMS) that features a soft x-ray aerosol charge conditioner, a fast- scanning ROMIAC particle classifier, and a two-stage CPC, to acquire fast and accurate particle size distributions in the range of 1.5 - 25 nm. The two-stage CPC includes a fast-mixing activation stage using DEG as working fluid, followed by an eco-friendly, fast-response, water-based CPC (Hering et al., 2019). Each compo- nent of the nSEMS was characterized separately; the integrated transfer function was derived based on both experimental results and finite-element modeling using COMSOL MultiphysicsTM. The nSEMS has been intensively used in the Cos- mics Leaving OUtdoor Droplets (CLOUD) experiments at CERN. A comparison of nSEMS data with measurements from other well-calibrated particle sizing instru- ments at CLOUD confirms its capacity to provide reliable size distribution in the low-nanometer size regime.
2.2 The nSEMS Design and System Features
The nSEMS was designed to capture critical aerosol dynamics during atmospheric nucleation and subsequent nanoparticle growth, both in environmental chamber experiments and in ambient measurements. To this end, its design and operating parameters have been optimized to provide size distribution measurements with relatively high size resolution in the sub-25 nm range, and with a fairly short duty cycle. The nSEMS classifies particles of different sizes according to their electrical mobilities,𝑍𝑝, which is defined as the ratio of particle migration velocity,𝑣𝑚, to the electric field strength within the classifier,𝐸:
𝑍𝑝= 𝑣𝑚 𝐸
= 𝜙𝑒𝐶𝑐
3𝜋 𝜇 𝑑𝑝 (2.1)