34 Figure 3.2 H2/air fuel cell polarization curves for nanofibers and sputtered. a) Initial fuel cell performance and (b). The anode for both MEAs is a 0.1 mg/cm2 Johnson Matthey Pt/C nanofiber anode. a) Polarization curves for a PtCo/C nanofiber.
INTRODUCTION
Rationale
These reasons include low power output when operating at low (~40%) relative humidity (RH) and degradation of the fuel cell's membrane electrode assembly (MEA). The work in this thesis aims to reduce these obstacles by designing fuel cell electrodes with electrospun nanofiber morphologies.
Current Obstacles in Fuel Cell Technology
- Low Relative Humidity Operation
- Low Catalyst Loading
- PEMFC Membrane Electrode Assembly Durability
As a result, emphasis has been placed on reducing the amount of platinum in the fuel cell. The incorporation of PtCo/C into fuel cell MEAs will be discussed in more depth in Chapters 4 and 5 of this thesis.
BACKGROUND
Proton Exchange Membrane Fuel Cell Theory
- Governing Reactions
- Overpotential
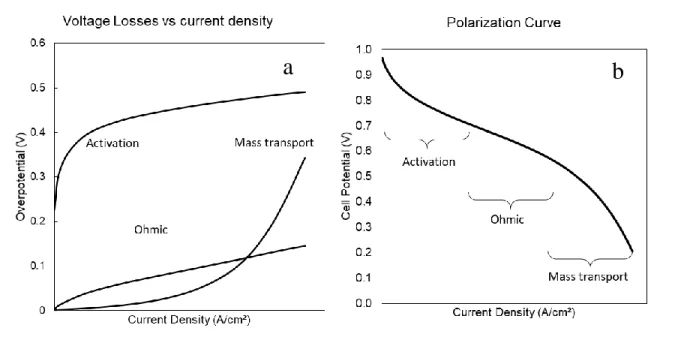
When a fuel cell membrane-electrode assembly produces current, it moves away from its equilibrium state.[12] The voltage of the cell can be expressed by Equation 2.2. The three sources of voltage loss are plotted in Figure 2.1 (a) and the curve resulting from the cumulative sum of the losses is plotted in Figure 2.1 (b).
![Figure 2.1: Schematic diagram of a PEMFC MEA. Adapted from Reference [4] .](https://thumb-ap.123doks.com/thumbv2/123dok/10740617.0/31.918.252.723.266.611/figure-2-schematic-diagram-pemfc-mea-adapted-reference.webp)
Analysis Techniques
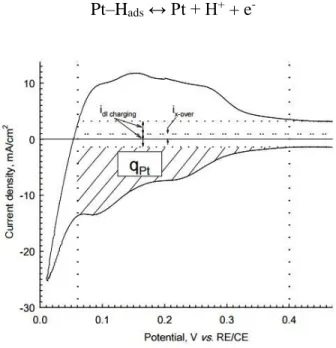
At sufficiently high voltages, hydrogen will immediately oxidize at the limiting conditions for mass transfer.[23] The current generated from the LSV can be directly related to the amount of hydrogen present in the cathode space using Equation 4. This shaded area neglects the charge associated with non-Faraday processes present in the fuel cell to avoid overestimating qPt - therefore, the reverse double-layer charge current density (idl) is subtracted from this area.[22] The voltage is scanned at a known rate v (0.04 volts/second) over a known V1-V2 voltage range (0.06 volts to 0.40 volts).

Electrospinning and its use in PEMFCs
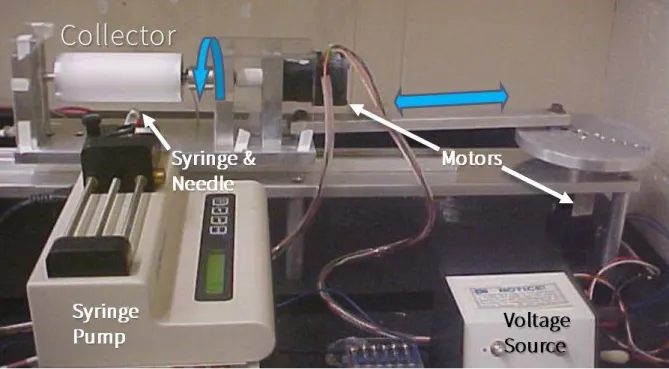
There are several conditions that are important for the electrospinning of a polymer-based solution that can affect the quality of the nanofibers or if the nanofibers form at all.[30]. These conditions include the bias voltage, the distance from the spinneret to the collector surface, the relative humidity, the rate at which the ink is pumped from the needle, the boiling point of the solvent system, the dielectric properties of the ink[31 ], the ratio of .
Strategies in the Literature for Overcoming Current Obstacles
- Approaches to Improve Performance at Low RH
- Electrode Design for Lowered Pt Content and Improved
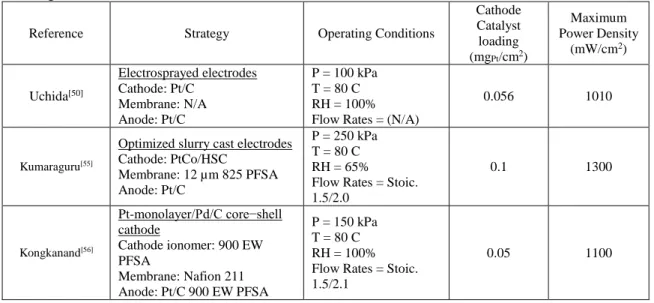
These structures exhibited more stable electrochemical surface area compared to their control electrode when an accelerated stress test of voltage cycling from 0.6 V – 1.2 V was applied.[54] The authors conclude that the absence of carbon in the catalyst layer is. Kumaraguru et al.[55] use a high ion exchange capacity ionomer (825EW perfluorosulfonic acid) for the anode and cathode binder and a membrane 12 microns thick (half the thickness of a standard Nafion 211 membrane) and a PtCo/C catalyst at the cathode to achieve 1, 3 W /cm2 at fuel cell operating conditions listed in table 1.1.
Objectives and Remaining Dissertation Format
PGM-FREE CATALYST POWDER AND NAFION/PVDF Binder 3.1 PGM-free catalyst in nanofibers with Nafion/PVDF.
PGM-FREE CATALYST POWDER AND NAFION/PVDF
- PGM-free catalyst in Nanofibers with Nafion/PVDF
- PGM-free Catalyst in Nanofibers with Nafion/Polyethylene Oxide
- Conclusions
- References
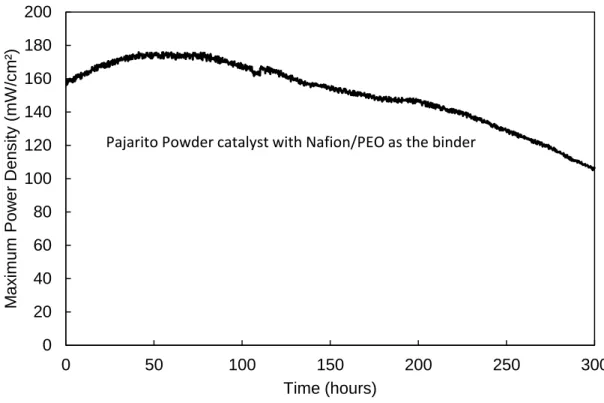
As expected, based on data in the literature,[5] the initial high performance of a slurry electrode MEA degraded over time, with a 63% drop in power density at 0.5 V after 300 h, presumably due to catalyst degradation.[4 ] The power of the slurry electrode MEA with a weight ratio of 1:1 Nafion:PVDF binder increased after start-up, reaching a maximum power density at ca. 150 hours of operation and then slowly declined for the remainder of the test with a final power density of only 47 mW/cm2. SHE results in extreme degradation.[13-14] The results of these experiments are summarized in Figure 3.4 a, where the maximum H2/air fuel cell output at 80 °C, 1 atm back pressure and 100% relative humidity, measured intermittently over 500 carbon corrosion stress cycles see you.
NANOFIBER FUEL CELL CATHODES WITH PLATINUM
Introduction
The performance and durability of these MEAs were evaluated in a hydrogen/air fuel cell at a cathode catalyst loading of 0.1 mgPt/cm2. PtCo/C nanofiber cathode MEAs were compared to sputter cathode MEAs with the same catalysts and pure Nafion binder.
Experimental
- Electrode Preparation
- Procedures for Fuel Cell Testing
- Accelerated Stress Tests
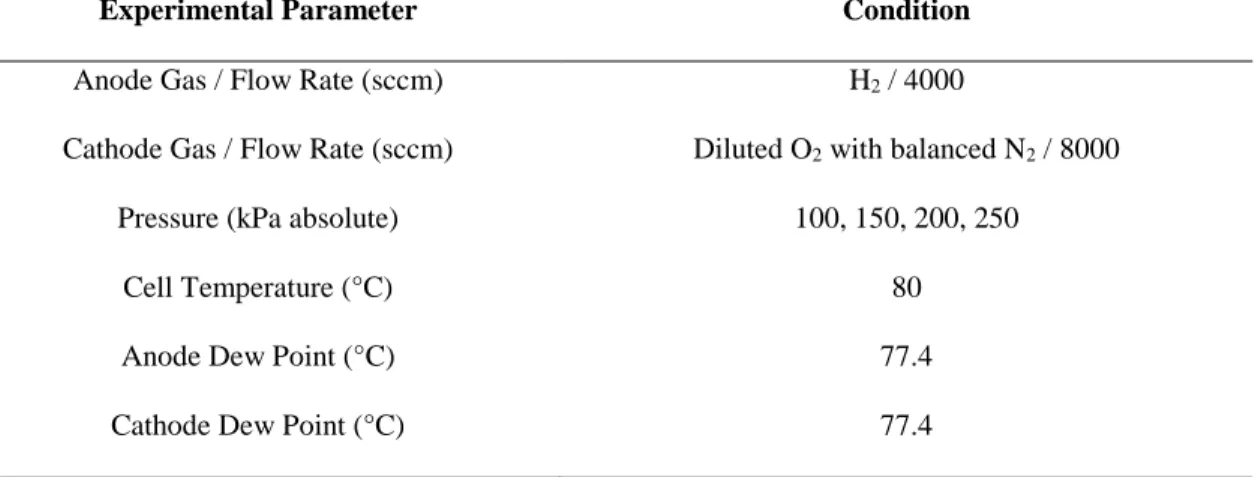
The spray cathode loading was ∼0.1 mgPt/cm2 and the sprayed anode loading was 0.4 mgPt/cm2, resulting in a total MEA loading of ∼0.5 mg/cm2. Sputtered electrode MEAs were fabricated at the Nissan Technical Center of North America (NTCNA) by hot pressing gas diffusion electrodes at 2 MPa and 130 °C for 10 min. At higher RH conditions (RH 100%), a decrease in the limiting current due to flooding was observed.
Results and Discussion
- PtCo/C Nanofiber Structure
- Electrochemical Characterization
- Metal Dissolution Accelerated Stress Tests
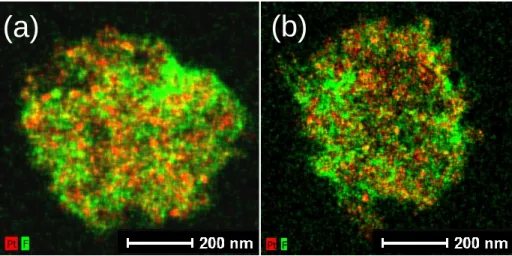
The relative amount of ionomer to carbon is important for energy production in fuel cells, as this ratio affects (1) the contact between the ionomer and the Pt particles that promotes proton transport, (2) the resistance to electrons, and (3) the resistance to gas transport. [31, 32] The effect of ionomer to carbon ratio on power density generation was studied in nanofiber electrodes containing PtCo/C and Nafion. The percentage of cobalt measured in Figure 4.19 is directly related to the percentage of platinum (ie, Pt% = 1 – Co%). Oxygen gas transport resistance (GTR): Inside the electrode, GTR is the local transport resistance of O2 to the catalyst sites through the ionomer thin film.[44] It is found that the high gas transport resistance leads to significant voltage losses in the high current density region of the polarization curve [44], [45] The oxygen transport resistance through the electrode is thought to be controlled by Knudsen diffusion (non-Fickian) when oxygen diffuses through thin layers Nafion to catalyst sites.[15] Electrode morphology can affect GTR; NTCNA and LANL measured GTR for MEA sputtered electrodes and PtCo/C-catalyzed nanofiber electrodes.
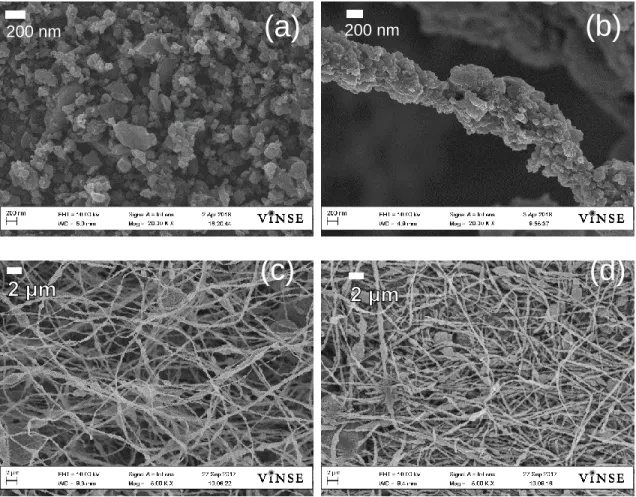
![Figure 4.1 SEM images of nanofiber mat with a binder of Nafion/PAA containing PtCo/C at (a) (5000x), and (b) PtCo/C (100,000x) (c) Pt/C (3000x) nanofiber mat with a binder of Nafion/PAA from reference [5] and (d) Pt/C (6000x) nanofiber mat with](https://thumb-ap.123doks.com/thumbv2/123dok/10740617.0/76.918.169.805.202.717/figure-nanofiber-nafion-containing-nanofiber-nafion-reference-nanofiber.webp)
Conclusions
PtCo/C as a cathode catalyst in MEAs with nanofiber electrodes significantly improved the power density compared to a nanofiber MEA with a Pt/C catalyst. A sprayed electrode MEA with PtCo/C with an additional Nafion coating was compared and found to have a slightly lower power density compared to nanofibers at BOL, and a significantly lower power density after metal dissolution. This behavior was consistent with observations made in previous nanofiber and spray electrode MEAs using a Pt/C cathode catalyst.[5] Thus, it appears that the nanofiber cathode architecture will improve the performance of any new cathode catalyst powder, compared to a conventional spray electrode design.
Gas transport resistance was measured and both were found to be superior in nanofibers compared to sputtering in both BOL and after an AST metal dissoln. The EOL GTR and mass activity measured at Los Alamos National Laboratory after 4 recovery cycles for a nanofiber cathode was higher than that of a conventional sputtered cathode. Gonzalez, Stability of Pt–M alloy catalysts (M=first row transition metal) and its effect on activity in low temperature fuel cells.
POLYETHYLENEOXIDE AS A CARRIER FOR PEMFC
Introduction
Despite the presence of PAA carrier polymer, an overall increase in initial power density was observed when using a nanofiber electrode morphology.[1]. However, after boiling in acid and water to remove the PEO carrier polymer, the conductivity returned to 0.054 S/cm. In this study, experiments were conducted to replace the PAA carrier electrospun fiber cathodes with PEO.
Experimental
- Ink Preparation
These conditions are significantly different from those required to form nanofibers when using PAA as a support (eg, the distance from the collection drum is more than double and the applied voltage is weaker). The water from this second leach was then analyzed in the same manner as described above. Mass activity was determined by plotting voltage and current collected from 1 A to 0.01 A under pure oxygen at 150 kPa absolute.[10] The current-voltage data were corrected for both hydrogen crossover and high-frequency resistance; mass activity was determined as the current generated at 0.9 V normalized to platinum loading.
Results and Discussion
- Physical Characterization of Nanofibers Spun from
- Initial Performance of Nafion/PEO Electrode MEAs
- Accelerated Stress Tests with Nafion nanofiber
- Relative Humidity Effects on MEA Power Output
In an MEA containing a (PtCo/C)/Nafion/PEO cathode and a (Pt/C)/Nafion/PAA anode, this pretreatment improved the power density compared to an MEA whose cathode and anode were (PtCo/C)/ Nafion/PAA. The peak power density of the (PtCo/C)/Nafion MEA nanofiber electrode was nearly twice that of the (PtCo/C)/Nafion/PAA MEA at 40% RH. The Nafion/PAA ratio was 2/1, while the Nafion/PEO ratio was 3.5/1.
Conclusions
Finally, there is a large difference in MEA HFR measured at 40% for 100 kPa and 200 kPa back pressure. This means that the HFR decreases by more than half when increasing the pressure from 100 kPa to 200 kPa at 40% RH while the MEAs with Nafion/PAA do not show a change in HFR for 100 kPa and 200 kPa. The STEM image also shows a smaller average pore size inside the Nafion nanofiber compared to a Nafion/PAA nanofiber.
The Nafion binder nanofiber electrode MEA showed faster ORR kinetics at low RH compared to a slurry electrode MEA due to presumably better water retention.
RELATING THE STRUCTURE OF NAFION/PVDF-BASED
- Introduction
- Experimental
- MEA Preparation and Degradation
- Electrochemical Characterization
- Electron Microscopy Characterization
- Results and Discussion
- Characterization of Catalyst Layer Thinning
- Porosity Collapse
- Conclusions
- References
Scanning transmission electron microscopy (STEM) was performed using an FEI Talos F200X to obtain high-resolution images of the cathode at the BOL and EOL for porosity determinations. Given that the same type of carbon was used in both sludge electrodes, the retention of the original catalyst layer thickness is unexpected. As seen in the slurry electrode of the same composition, there was no change in CL thickness.
SULFONATED SILICA NETWORK AS A HIGH IEC-BINDER
- Introduction
- Experimental
- Results and Discussion
- Ion Exchange Capacity of the Sulfonated Silica
- Physical Characterization of Electrospun PVDF Fibers
- Electrochemical Analysis
- Electrode Polarization after a Carbon Corrosion
- Conclusion
Top-down SEM images of the electrospun nanofibers composed of Pt/C, PVDF and sulfonated silica network are shown in Figure 7.2a (1/1 TEOS/CSPTC) and 7.2b (1/2 TEOS/CSPTC). The EOL power density of the nanofibers with the sulfonated silica network is strongly dependent on the relative amount of CSPTC to TEOS. Increasing the amount of sulfonated silica precursor (CSPTC) relative to unsulfonated silica precursor (TEOS) significantly reduced the power density at low relative humidity.
SUMMARY
STEM analysis also showed that the average pore size of the Nafion/PEO nanofiber cross section was smaller compared to the pore size of the Nafion/PAA nanofiber. This led to the hypothesis that water can condense in the tiny pores of the fibers. These results showed that the Tafel slopes of the nanofiber electrodes were lower than the slurry at low RF.
CONCLUSIONS
FUTURE WORK