Photographs of ZnS ceramics in the dark with the UV light turned off (a) and ZnS ceramics in the dark with the UV light turned on (b).58 Figure 35. PL spectra of ZnS ceramics measured at 300 K in air with excitation. wavelength 365 nm (before exposure to UV light and after 30 min of exposure to UV light).59 Figure 36.
Optical Ceramics
Development of Optical Ceramics
Additionally, when it comes to single crystals for solid-state laser gain media applications, the concentration and homogeneity of laser active ions is limited by single crystals. Thus, optical ceramics have emerged as promising candidates for extended-range transparent materials.
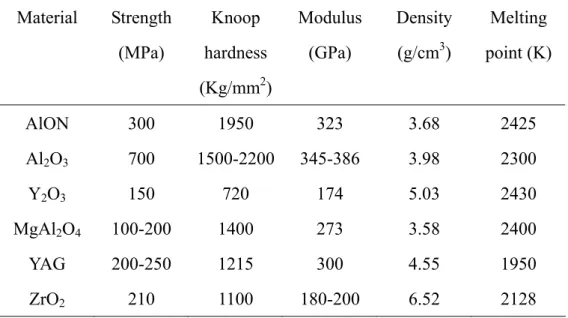
Materials for Optical Ceramics
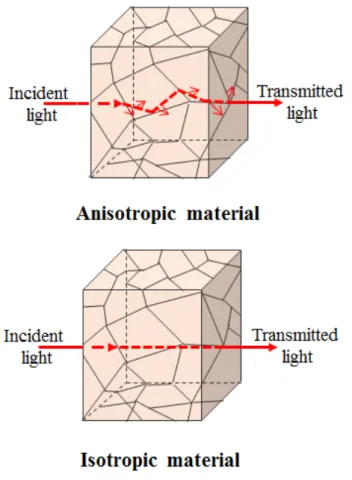
Since it is difficult to prepare MgAl2O4 optical ceramics from high-purity raw precursors via conventional sintering, the pressure-assisted sintering techniques are usually applied. Alpha-Alumina (α-Al2O3) ceramics are the most typical representative of optical ceramics with anisotropic structure.
Processing of Optical Ceramics
Optimization of the processing methods has been studied and carried out to obtain optical ceramics with higher performance. In addition to raw powder synthesis, the sintering process is another important factor contributing to the optical performance of optical ceramics.
Introduction of ZnS
- Fundamental Properties of ZnS
- Nanostructured ZnS
- ZnS IR Optical Ceramics
- Photoluminescence of ZnS
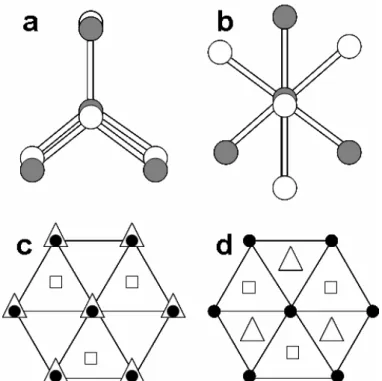
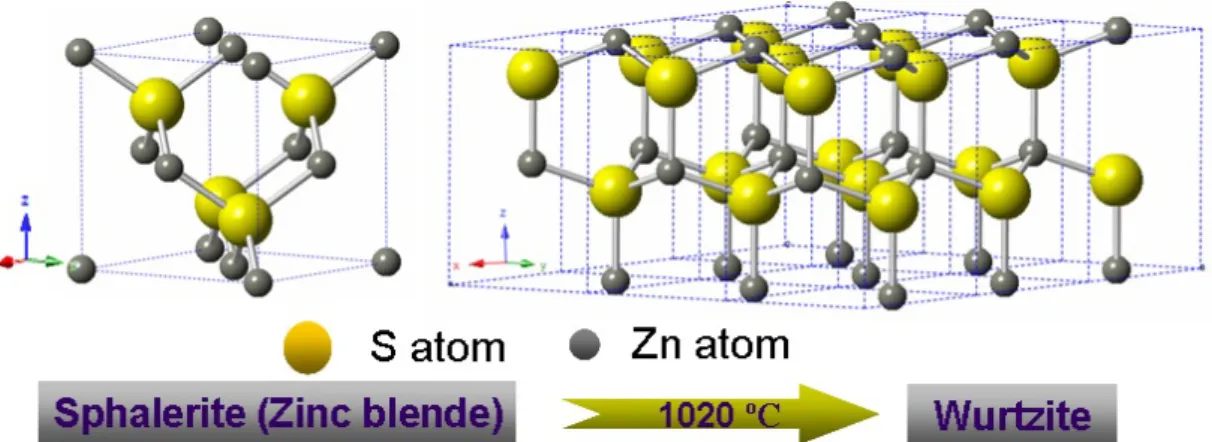
Thus, in applications where wurtzite is the desired phase, its stability can be increased by reducing particle size to the nanometer scale, which lowers the effective transition temperature of the ZnS. The presence of wurtzite in mainly sphalerite ZnS reduces transparency due to the anisotropic nature of the hexagonal structure of wurtzite.
Aims of This Work
Introduction
Experimental Procedures
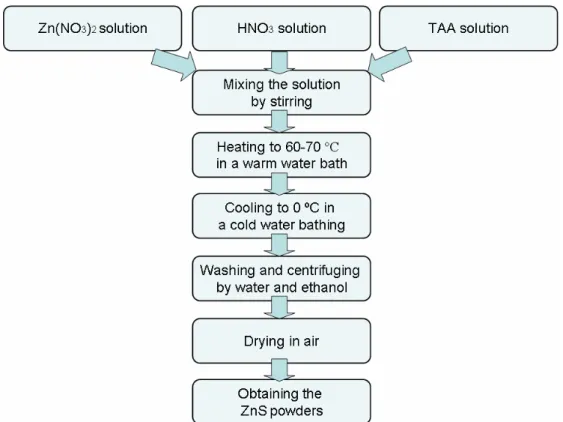
ZnS Powders Synthesis and Processing
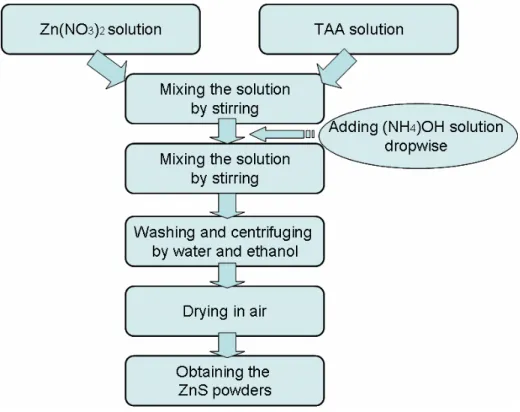
As the reaction proceeded, the solution became cloudy, indicating agglomeration of crystallized ZnS particles. The suspension of ZnS colloids was then cooled to 0 ºC in an ice water bath to stop particle growth. Flowchart of ZnS powder synthesis with TAA as sulfur source via a hot water bath under acidic conditions.
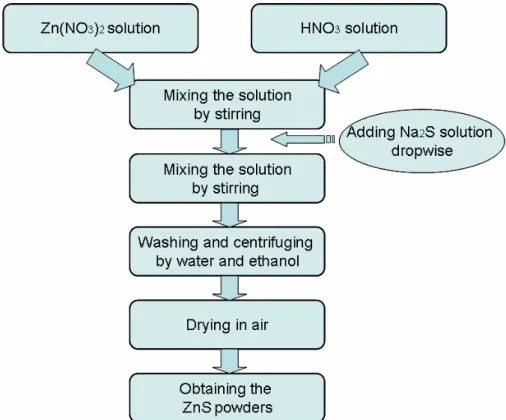
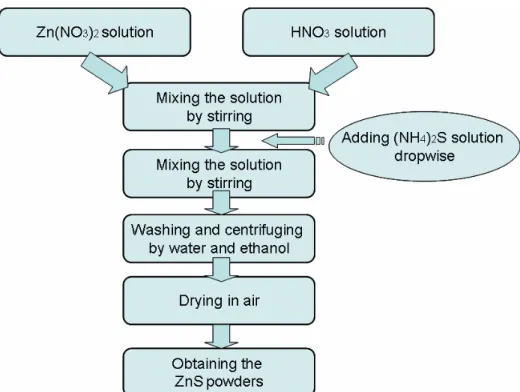
As the two solutions were mixed together, the solution changed to a milky suspension with white color, indicating the production of ZnS particles. The ZnS suspension was placed in an oven to be dried in air to obtain ZnS powders. ZnS powders synthesis with (NH4)2S as the sulfur source. NH4)2S was used as the sulfur source during the synthesis process of ZnS powders.
Mixing the two solutions resulted in immediate turbidity within the solution with yellowish-white precipitates forming, indicating the formation of ZnS particles. To make a comparison with the synthesized powders, the ZnS powders from Sigma-Aldrich were used as received and the ZnS single crystal flakes from Alfa were jet milled to finer powders.
Characterization of ZnS Powders
Results and Discussion
SEM images showing the morphology and microstructure of the studied ZnS powders are shown in Figure 10. It is shown that the commercial ZnS powders have larger particle sizes in the micron scale. The synthesized ZnS powders have much larger surface area than the commercial powders, which indicates higher surface energy of the synthesized powders.
It is believed that different specific surface areas of the synthesized ZnS powders are correlated with different synthesis routes with different sulfur sources. The detailed pore size distribution curves of the synthesized and commercial ZnS powders are shown in Figure 12 and Figure 14. The presence of the mesopores and macropores can lead to the high specific surface area of the ZnS powders.
The difference in the microstructure and morphology of the synthesized ZnS powders is attributed to the synthesis methods and sulfur sources. Growth schemes of ZnS powders synthesized by colloidal treatment with a hot water bath (a) and at room temperature (b).
Conclusions
ZnS Ceramics Consolidated via FAST
The grains and microstructure of the sintered ZnS ceramic can be clearly observed from Figure 22(b). IR transmission curve of the sintered ZnS ceramic (TAA & hot water bath) and the photo image of the ZnS ceramic grain (inset) with a diameter of 18.75. IR transmission curve of the sintered ZnS ceramic (Alpha & jet milled) and the photo image of the ZnS ceramic grain (inset) with a diameter of 10.00 mm.
The SEM images of the ZnS ceramics (TAA & hot water bath) sintered at different temperatures are displayed in Figure 29. The synthesis methods and sintering profiles of the ZnS powders and ash-sintered ZnS ceramics have been mentioned in the previous parts. The microstructures of the ZnS powders and ash-sintered ceramics were investigated by ambient SEM (Quanta 200, FEI).
Photographs of ZnS ceramics in the dark with the UV light turned off (a) and ZnS ceramics in the dark with the UV light turned on (b). Transient PL curve of ZnS ceramic measured at 300 K in air with an excitation wavelength of 365 nm. PL spectra of ZnS ceramics with different observation times are separated and combined in Figure 38.
PL spectra of the ZnS ceramics with different observation times (10 µs, 500 µs and 10 ms) with an excitation wavelength of 365 nm.
ZnS Ceramics Sntered via VHP
Comparison between FAST and VHP for Processing of ZnS Optical Ceramics
FAST uses pulsed direct current to enable high heating rate and short residence time for densification at lower temperatures. By evaluating the results of the as-sintered ZnS ceramics by different sintering techniques, it is considered that the VHP is more suitable for the production of the optical ZnS ceramics. The slower heating rate and solitary residence time may provide sufficient time and energy to move the remaining pores in the ceramic during the VHP process.
In addition, the slower heat and pressure loading of VHP may be advantageous for processing complete samples instead of cracking the samples in FAST with rapid heating and pressure loading. In addition, the applied electric field imposed on the graphite dies and samples facilitates the penetration and contamination of the highly conductive carbon in the ceramic wafers, resulting in the deterioration of the optical transmission.
Grain Growth Mechanism of ZnS Ceramics during VHP
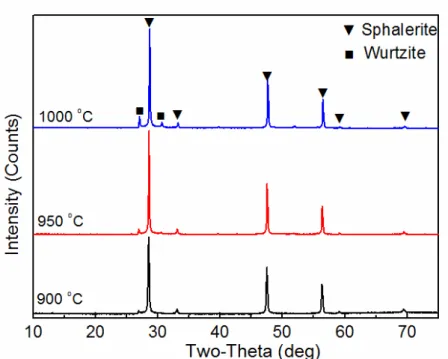
Here, based on previous results, it is considered that higher temperature is more favorable for sufficient densification and pore removal of ZnS ceramics, compared to the influence of the presence of the second hexagonal phase. The grain growth model can be predicted as a kinetic equation of the form below:82. From the SEM image analysis of the synthesized raw ZnS powders, the average particle size is 0.17 μm.
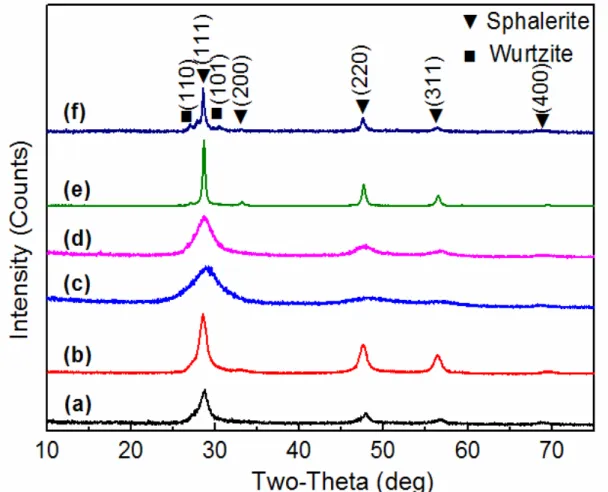
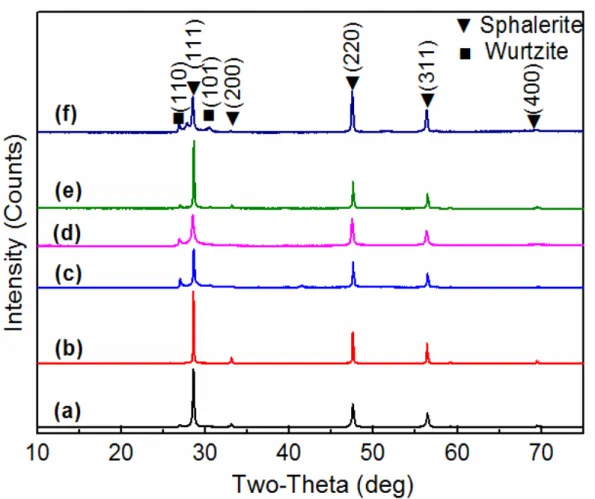
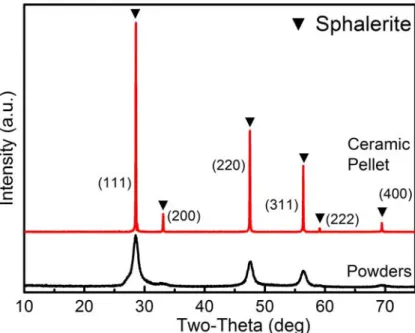
The grain growth of ZnS optical ceramics during densification in VHP is also briefly investigated, and the activation energy is 160.09 kJ/mol. The ZnS powders synthesized using Na2S as the sulfur source were sintered via FAST, while ZnS powders synthesized using TAA via a hot water bath under acidic conditions were sintered via VHP. The phase composition of the ZnS powders and ceramics was measured via XRD (D2 PHASER, Bruker) equipped with a CuKa radiation (30 kV, 10 mA), with the measurement conditions of 10 to 75 º2θ, step size 0.02 º2θ and 0.3 seconds count time.
The ZnS ceramics sintered via FAST and VHP were also characterized to study the photoluminescence performance and mechanism. The elemental chemical composition and valence of the ceramics were investigated by wavelength dispersive spectroscopy (WDS, JEOL-JXA-8200, JEOL), X-ray photoelectron spectroscopy. XPS, ESCALAB 250, Thermo Fisher) and X-ray fluorescence (XRF, Bruker S4 PIONEER).
Photoluminescence of the ZnS Ceramics via FAST
Meanwhile, the elemental composition and valences of the elements zinc and sulfur within the sample were detected using XPS. It should be noted that PL intensity for the peak at about 530 nm after UV light illumination is much weaker than the one before illumination, which results from the photo-oxidation process of elemental sulfur species on the surface of the ZnS ceramic. PL spectra of the ZnS ceramic measured at 300 K in air with an excitation wavelength of 365 nm (before UV light illumination and after 30 min UV light . illumination).
The total photoluminescence quantum efficiency (PLQE) of the ZnS ceramic sample is determined by the ratio of the number of photons emitted to that of photons directly absorbed by the instrument. The Streak camera with a detection range of 0–10 ms and a time resolution of was used to further confirm the green phosphorescence of the ZnS ceramic. It should be noted that the background of the streak image at 10 ms is attributed to delayed fluorescence of the ZnS ceramic.
Several references have claimed that the main reason for the green luminescence is the elemental sulfur species on the surface.69,70,87 To confirm that the green luminescence is attributed to the excess of elemental sulfur species, the PL spectrum of the ZnS ceramics were measured after 30 minutes of UV light illumination. The PL intensity recovers after UV light irradiation due to the irreversible transformation of the elemental sulfur species into sulfur dioxides.
Photoluminescence of the ZnS Ceramics via VHP
Considering that WDS and XPS have the limitation of detecting the underground elements, XRF is adopted to detect the elemental composition of the whole ZnS ceramic pellets. Based on these results, we hypothesize that it is the interaction of the transfer of sulfur defects associated with elemental sulfur species and the imperfections in the ZnS crystals resulting from small amounts of Na impurities from raw materials that facilitate the release of electromagnetic energy from triplet state to the ground state and extend the time of the green luminescence.88-91 Further studies are needed to confirm the more detailed causes of the phosphorescence. Further investigation needs to be carried out on the mechanism of the luminescent properties of sintered ZnS ceramics of VHP.
Photoluminescence emission spectrum for ZnS sintered ceramic with an excitation wavelength of 365 nm and photographic image of the ZnS ceramic pellet inside. It has also been found that the green photoluminescence results from the transfer interaction of electrons trapped in sulfur vacancies in interstitial states associated with elemental sulfur species on the surface. Further study and analysis will be needed to confirm the exact reason for the persistent green photoluminescence.
Heinz, "Equations of state and optical properties of the high-pressure phase of zinc sulfide," J. Qteish, "Ab initio pseudopotential study of structural phase transformations of ZnS under high pressure," Phys.