1
The Association between City-level Air Pollution and Frailty among the
1
Elderly Population in China
2
Kai Hu a, Katherine Keenan a, Jo Mhairi Hale a, Tobias Börger b 3
a Population and Health Research Group, School of Geography and Sustainable Development, University 4
of St Andrews, Fife, KY16 9AL, UK 5
b Economics Division, University of Stirling, Stirling, FK9 4LA, UK 6
7
1. Introduction 8
Gross domestic product (GDP) has increased ten-fold in China during the last two decades, quality of 9
life for most of the Chinese population has greatly improved, and their life expectancy has substantially 10
increased as well (Ebenstein et al., 2015). However, the environmental effects of economic 11
development have been a concern to the government and the public (Zhang et al., 2010). Industrial 12
manufacturing is a major source of pollutants, contributing to harmful materials in air, water, soil and 13
food. Among these, air pollution (AP) has attracted a great deal of attention, as most Chinese cities 14
experience air pollution levels above national air quality standards (Wang et al., 2014). The association 15
between AP and poor health is well established. Specifically, studies have found a strong association 16
between exposure to air pollution and reduced life expectancy (Ebenstein et al., 2015), higher levels of 17
respiratory mortality (Richardson et al., 2011), chronic diseases such as chronic obstructive pulmonary 18
disease (COPD) (Liu et al., 2018; Wang et al., 2018), mental health (Signoretta et al., 2019; Zhong et 19
al., 2017), cognitive health (Zhang et al., 2018), functional health (Sun and Gu, 2008), and self-rated 20
health (Charafeddine and Boden, 2008).
21
Alongside rising pollution levels, the population of China is ageing rapidly. Projections from the United 22
Nations predict that the proportion of Chinese elderly people aged 65 years and over will more than 23
double in the next 30 years, increasing from 12% in 2020 to 27% of the total population in 2050 (Fang 24
et al., 2015; United Nations, 2019). The proportion of the oldest old (those over 80 years) in the Chinese 25
Accepted refereed manuscript of: Hu K, Keenan K, Hale JM & Börger T (2020) The association between city-level air pollution and frailty among the elderly population in China. Health and Place, 64, Art. No.: 102362. https://doi.org/10.1016/j.healthplace.2020.102362
© 2020, Elsevier. Licensed under the Creative Commons Attribution-NonCommercial-NoDerivatives 4.0 International http://creativecommons.org/
licenses/by-nc-nd/4.0/
2
population is projected to quadruple by 2050 (United Nations, 2019). Along with extended lifespan 26
typically comes an expansion of physical and cognitive disability (Zeng et al., 2017). As elsewhere, 27
among the elderly population in China there is a high prevalence of co-morbid chronic diseases and 28
multimorbidity (Gu et al., 2017; Lei et al., 2014). Therefore, an adequate assessment of elderly health 29
must go beyond the single-disease model and take account of multiple co-morbid conditions.
30
Studies focussing on the Chinese elderly population largely confirm the links found between AP and 31
health, demonstrating a link between AP and individual chronic diseases, such as COPD (Wang et al., 32
2018), heart diseases (Bai et al., 2019), diabetes (C. Liu et al., 2016) and cardiovascular diseases (CVD) 33
factors like hypertension (Liu et al., 2017; Yang et al., 2018). Therefore, it seems likely that air pollution 34
influences elderly health through multiple disease pathways. In this study, we focus on frailty as a multi- 35
dimensional measure of increased health vulnerability in the elderly population (Fried et al., 2001;
36
Walston et al., 2006). A recent meta-analysis across 13 cohorts suggested that increased frailty is 37
strongly associated with increased mortality (Kojima et al., 2018). Compared with younger adults, the 38
elderly are expected to be more vulnerable to air pollution due to their increased levels of frailty 39
(Fougère et al., 2015), in part because exposure to air pollution will exacerbate existing frailty through 40
many disease mechanisms. There have, however, been only a limited number of studies on air pollution 41
and frailty in elderly populations (García-Esquinas and Rodríguez-Artalejo, 2017). One study has 42
demonstrated that increased air pollution was associated with increased frailty incidence after 43
myocardial infarction (MI) (Myers et al., 2013), and others suggest that frailty moderates associations 44
between air pollution and lung function (Eckel et al., 2012) and adverse events after MI (Gerber et al., 45
2014).
46
The overall aim of this study is to investigate the contribution of long- and short-term exposure to AP 47
on frailty incidence among the elderly in China. We advance previous studies in a number of ways.
48
First, to our knowledge this is the first study of the relationship between AP and frailty (a multi- 49
dimensional health indicator) in the elderly population, whose need for social and medical care leads to 50
important policy implications. Second, we use longitudinal data on frailty, linked to longitudinal 51
information on air pollution, to understand the association between air pollution and changes in frailty 52
3
over time. Third, we make use of this longitudinal data to distinguish the impact of long-term exposure 53
to AP from short-term fluctuations. This may be important as short-term fluctuations can impact 54
different disease pathways (Xiao et al., 2016). Finally, this study contributes to the literature by 55
exploring potential heterogeneities by age, sex, socioeconomic status, interview time, and regional 56
factors such as GDP per capita.
57
2. Methods 58
2.1 Study population 59
The data used in this study are from the 6th and 7th waves (2011 and 2014) of the Chinese Longitudinal 60
Healthy Longevity Survey (CLHLS 2011 & 2014). CLHLS started in 1998 and although initially 61
sampled older adults aged 85+, this was expanded to those aged 65+ from 2002. The survey collects 62
personal and family information, self-reports of functional health, lifestyle, diet, psychological health 63
and home care, as well as measures of cognitive health (according to a set of tests about memory, 64
calculation, recall and language). To allow purposive over-sampling of the older population, the 65
strategy of CLHLS is to randomly select some residential areas and then to interview some centenarians 66
(aged over 100) who are living in those areas. The second step is to interview randomly a nonagenarian 67
(aged over 90), an octogenarian (aged over 80) and a respondent aged 65-79, whose residential 68
addresses are close to the centenarians’ home. This strategy can ensure that the proportion of 69
centenarians is similar to respondents who are aged over 80 or 90.
70
In 2011, the full CLHLS sample size was 9,765. Between 2011 and 2014, 3,699 respondents (37.9%) 71
attrited due to death (29.5%) or non-specified reasons (8.4%). In 2014, the CLHLS added a refreshment 72
sample of 1,126 new respondents (making the 2014 sample N=7,192). In the longitudinal data 2011- 73
2014, restricting the sample to individuals living in cities with AP monitoring stations results in a 74
sample of 7,986 respondents (11,620 observations), living in 123 cities. Missingness on the frailty 75
indicators reduces the number of respondents to 6,943 (9,749 observations). We use listwise deletion 76
for missingness on other predictors (career is missing 4% and all other predictors are less than 1%
77
missing). This leaves 6,570 individuals (9,132 observations) from 123 cities in our longitudinal analysis 78
4
and sample of 4,284 from 117 cities in our cross-sectional analysis (only 2014). In the sensitivity 79
analysis where we use geographically weighted regression (GWR) to predict air pollution data, the 80
analytical sample is 8,644 respondents (12,743 observations), living in 174 cities.
81
Note that we made corrections to approximately 5% of sample by amending inconsistent reports of 82
gender, education and pre-retirement careers by drawing on data from earlier waves of the survey. All 83
results in the main body of this study are based on the complete case analysis, and GWR data is used to 84
conduct sensitivity analysis in the Supplementary material Table S8/12/13.
85
2.2 Frailty index 86
To capture an individual’s cumulative health deficits most studies calculate the frailty index by a 87
standard comprehensive geriatric assessment (Cesari et al., 2014; Jones et al., 2004). Following the 88
established studies, Gu et al (2009) defined a frailty index using 39 indicators of various dimensions of 89
self-reported health status, cognitive functioning, disability, hearing and visual ability, depression, heart 90
rhythm, and numerous chronic diseases that were collected in the 2002 CLHLS. They validated the 91
measure, demonstrating strong associations with subsequent 3-year mortality (Gu et al., 2009). Based 92
on this research, we constructed the frailty index as an unweighted count of the number of deficits. We 93
excluded 2 of the 39 original indicators (bedsores and duodenal ulcer) because they are missing over 94
10% in CLHLS 2011 and 2014, had low prevalence of “yes”, and high prevalence of reports of 95
“unknown”. We also exclude interviewer-rated health, as its answers may be biased by the researcher 96
effect. Nevertheless, Gu et al (2009) suggested that so long as a reasonable number of indicators from 97
each dimension are included, the index will be robust. There are 36 components of the frailty index 98
including limitations in activities daily living (ADL), limitations in instrumental activities daily living 99
(IADL), functional limitations, cognitive health, self-rated health, hearing, vision, heart rhythm, 100
psychological disorders, number of serious illnesses in the past two years and multiple chronic diseases 101
(hypertension, diabetes, tuberculosis, heart diseases, stroke, bronchitis/asthma, cancer, arthritis and 102
Parkinson’s disease). In the CLHLS, cognitive functioning was measured by a Chinese version of the 103
Mini-Mental State Examination (MMSE) with a total score of 30, and respondents with a score of 23 104
5
or lower were considered as cognitively impaired in this paper (Yang and Gu, 2016). All of the 105
components are listed in Supplementary Table S2. Each indicator is recorded as binary except the 106
number of serious illnesses in the past two years (which contains 0 for no illness, 1 for one illness and 107
2 for two or more illnesses), self-reported whether the respondent ever had a diagnosis. The frailty index 108
then sums the 36 indicators listed above and consequently ranges from 0 to 37.
109
2.3 Air Quality Index (AQI) 110
This study uses air quality data from the Ministry of Ecology and Environment of China provided for 111
each city for each day for the period from 1st January 2000 to 31st December 2014. The measure of air 112
pollution is the air quality index (AQI), which is calculated based on hourly readings of a set of air 113
pollutants (PM2.5, PM10, SO2, NO2, O3, CO). Higher values of AQI mean more polluted air. AQI is 114
a standardised indicator for air pollution, which has been reported as the local air quality evaluation in 115
21 nations (Cochran et al., 1992). The association of AQI with the public health burden is used to 116
quantify the negative impacts attributable to air pollution (Stieb et al., 2005), and the validity of using 117
the AQI to assess health impacts of air pollution has been established (Li et al., 2015). We chose AQI 118
as the indicator for air pollution as ambient air consists of an amalgamation of numerous gaseous or 119
solid substances, which prevents isolation of the health effects of individual pollutants (Fougère et al., 120
2015). The Ministry of Ecology and Environment of China provides more AQI values than other air 121
pollutants records before 2013, although there are still missing values for AQI. In this study, if AQI is 122
missing, but the records of air pollutants (which are the components of AQI) are available (accounting 123
for 5% of daily records), we computed it using a method provided by Ministry of Ecology and 124
Environment of China (2012). This computation of AQI is a piecewise linear function of the pollutant 125
concentration, using single air pollutants to calculate the individual air quality index (IAQI).
126
𝑰𝑨𝑸𝑰𝒑=𝐼𝐴𝑄𝐼"#− 𝐼𝐴𝑄𝐼$%
𝐵𝑃"#− 𝐵𝑃$% ,𝐶&− 𝐵𝑃$%. + 𝐼𝐴𝑄𝐼$% , (1)
6
where IAQIP is the individual air quality index of the pollutant of P; Cp is the pollutant concentration;
127
BPHi is the concentration cut-point over Cp; BPLo is the concentration cut-point below Cp; IAQIHi is the 128
index cut-point corresponding to BPHi; IAQILo is the index cut-point corresponding to BPLo. 129
𝐴𝑄𝐼 = max {𝐼𝐴𝑄𝐼', 𝐼𝐴𝑄𝐼(, 𝐼𝐴𝑄𝐼), … , 𝐼𝐴𝑄𝐼*} (2) We take the value of AQI as the highest value in the list of calculated IAQIs from different pollutants.
130
AQI data is available hourly. For each city, we use the daily average AQI.
131
This study follows the bulk of the research in defining long-term exposure as more than one-year of 132
exposure (R. Liu et al., 2016; Ma et al., 2016). However, this operationalisation is not unique, and we 133
also analysed longer periods of exposure (2-year and 3-year) in the Supplementary material (cross- 134
sectional analysis in Table S4 and S5, longitudinal analysis in Table S9 and S10) to test the robustness 135
of the estimates.
136
Note that the CLHLS does not provide the exact names of cities but it provides some community 137
information, like population size, administrative area, and GDP. The community information provided 138
in the CLHLS can be used to identify the city of residence in the CLHLS dataset via cross-referencing 139
to Tabulation in the 2010 Population Census of China by County (National Bureau of Statistics of China, 140
2010). Specifically, we used the population size of a county/district in 2010 to match it to county/district 141
names, as population size is unique for each county/district; these match perfectly. It is then a simple 142
step to locate the city of residence when county/district names are clear, because the county/district is 143
the secondary administrative area within the city in China. After matching, we inserted the cities names 144
into our dataset and then use these names to link the CHLHS dataset to the AQI data.
145
Due to the limited number of air quality monitoring stations before 2013 in China, over 30% of CLHLS 146
cities was missing air pollution data (details in the Supplementary material Table S3). Therefore, spatial 147
interpolation for AQI is necessary for this study as a sensitivity analysis. This study used the GWR to 148
interpolate the missing AQI data, which can include more information compared with the traditional 149
interpolation method. GWR characterized the distribution of daily AQI well with the cross-validation 150
(R2) of 1235.13 (0.379), compared with R2 (0.249) in global regression (details in Supplementary 151
7
material Table S1). We also examined the residuals from the GWR (comparing actual and predicted 152
values), by plotting these on a histogram and Q-Q plot, which are normally distributed shown in the 153
Supplementary material Figure S1.
154
2.4 Z-score of AQI 155
There is some research suggesting that some the components of our frailty index are related to long- 156
term air pollution exposure (Ranft et al., 2009), while other components are related to both long-term 157
and short-term exposure (Brunekreef and Holgate, 2002; Dauchet et al., 2018). For example, the 158
associations between exposure to air pollution and ADLs, IADLs, and cognitive impairment, which 159
stem from the degeneration of biological functions, have been examined (Kampa and Castanas, 2008).
160
Results suggest cumulative exposure has a more significant effect (Brunekreef and Holgate, 2002).
161
However, short-term exposure to air pollution can lead to some chronic diseases (e.g., bronchitis, stroke) 162
because air pollutants can lead to acute inflammatory responses induced in the respiratory, 163
cardiovascular and blood circulation system (Brunekreef and Holgate, 2002; Scheers et al., 2018).
164
Therefore, this is another reason for adjusting the short-term exposure in our models.
165
However, the literature is inconsistent in terms of defining short-term exposure. Daily exposure is 166
mostly measured as the short-term exposure but there is little evidence showing that daily exposure 167
effectively captures short-term exposure effects. Thus, this study calculated averages of AQI over a day, 168
week, month and quarter to account for shorter-term exposure and weekly z-score is the main short- 169
term fluctuation in our analysis as it has been found that there is an association between weekly 170
exposure to air pollution and human health (Karakatsani et al., 2017). We use the z-score to capture 171
short-term exposure calculated as:
172
𝑧_𝑠𝑐𝑜𝑟𝑒 =𝑀𝑒𝑎𝑛+,%-.− 𝑀𝑒𝑎𝑛/%*0
𝑆𝐷/%*0 (3)
Note that the z-score is a relative indicator capturing the relative deviation of the short-term average 173
from the long-term background level. Compared with a similar study that used absolute values of short- 174
and long-term exposure to air pollution simultaneously (Zhang et al., 2018), using the z-score for this 175
study is to decrease the collinearity between them and is beneficial to take into consideration the 176
8
interactive effects. For example, we hypothesize that a spike in air pollution from a higher level of long- 177
term exposure may have different health effects than the same spike (in absolute terms) from a lower 178
level of exposure. Also, the z-score including the variation of long-term AQI can capture the exposure 179
to air pollution better.
180
In measuring short- and long-term exposure to air pollution, we used the interview date as the end of 181
duration of exposure and then calculate the mean of AQI for the respective period prior to the interview 182
date: one week (7 days), one month (30 days), one quarter (90 days), previous one year (365 days), 183
previous two year (730 days), previous three year (1,095 days) for this study. The advantage of this 184
measure is that it can capture the comparable value for exposure to air pollution. As the interview dates 185
for respondents are different, the exposure window is respondent-specific and dynamic. Figure 1 uses 186
the 1-year exposure to show how the measure works for three exemplary respondents A, B and C.
187
188 189 190 191 192
Fig. 1. Hypothetical example of how 1-year exposure to air pollution is calculated 193
2.5 AQI category 194
In order to distinguish the long-term effects and short-term effects of exposure clearly, in some models 195
the long-term AQI measurements are adjusted for short-term exposures. As for long-term exposure, 196
there are four categories of AQI according to national air quality standards. Considering the cumulative 197
effects of air pollution on health, the concentration cut-point or threshold, of China’s AQI is set at the 198
National Ambient Air Quality Standards (NAAQS) (Ruggieri and Plaia, 2012). The standardising 199
transformation separates the AQI into five categories: good (0 - 50), moderate (51 - 100), unhealthy 200
(101 - 150), very unhealthy (151 - 200) and hazardous (200+ ). Different from the NAAQS’s standard, 201
the AQI category in this study is adjusted into four groups because its distribution is skewed, and there 202
…..
2000
id 2 id n
…..
1 year
2015 id 1
B A C
Note: A, B, and C mean three respondents interviewed at different dates.
1 year 1 year
9
are few respondents living in the most polluted area. The detailed index value of categories is shown in 203
Table 1 below.
204
Table 1 Sub-index of the Air Quality Index (AQI) in China 205
AQI categories AQI 1 Good
AQI 2 Moderate
AQI 3 Unhealthy
AQI 4 Very unhealthy
Index value 0-50 51-75 76-100 101-
206
2.6 Change in AQI variable 207
We also generated a new variable at the city level for change or stability of AQI category between 208
waves. For example, based on the AQI categories above, if one respondent resided in a city with AQI 209
1 in 2011 but that city had AQI 2 level in 2014, the change of AQI is categorized as ‘AQI 1-2’; however, 210
if a respondent was recorded as living in a city with AQI 1 in both waves, the change of AQI is 211
categorized as ‘AQI 1-1’. In the data we analysed, we find that all of cities with AQI 1 in 2011 remain 212
the AQI 1 in 2014; for the cities with AQI 2 in 2011, 21.55% cities remain AQI 2, but 66.17% cities 213
experience AQI 3 and 12.28% cities are with AQI 4 in 2014. However, most cities with AQI 3 in 2011 214
record AQI 4 (84.37%) in 2014, while 10.66% cities remain, and 4.97% cities move down to AQI 2.
215
2.7 Additional covariates 216
We also include a set of control variables that may confound or explain the association between air 217
pollution and later-life health. First, the demographic variables include sex, age and age squared (as 218
continuous measures). Marital status comprises three categories: married and living with their spouse, 219
widowed and single (including separate, never married and divorced respondents). The second set of 220
covariates capture socioeconomic status: education, self-rated economic status and pre-retirement 221
career. The education variable in CLHLS is recorded by years of education; however, as more than 50%
222
of respondents are without schooling experience, the education variable is divided into two categories:
223
no schooling or some education. Self-rated economic status was collected using the question “How do 224
you rate your economic status compared with others in your local area?” as a 5-point scale (very rich, 225
rich, so so, poor, very poor). Due to small variation of this variable, we combine rich and very rich to 226
10
“rich” and poor and very poor into “poor,” thus self-rated economic status has three categories: rich, 227
median and poor. Pre-retirement career is based on self-reports of primary job and includes two 228
categories: white collar (including industrial, governmental, commercial and military personnel) and 229
blue collar (including self-rated employed and agricultural personnel, houseworkers and people who 230
never had paid employment). Some area-level confounding factors are also included: natural logarithm 231
of population density, natural logarithm of GDP per capita, both of which are based on the annual city- 232
level information.
233
2.8 Statistical Models 234
To estimate the effects of air pollution on health, we test the association between AQI values and 235
incidence rate of frailty. We start with the cross-sectional analysis using the CLHLS 2014, as this one 236
wave provides more observations linked with AQI data. This allows us to explore the associations of 237
exposure to air pollution with frailty with less missing data. As frailty is a count variable, we use 238
multilevel random-intercept Poisson regression models. Individuals are nested within cities, and the air 239
pollution data, population density, and GDP per capita are city-level predictors. We next conduct a 240
three-level longitudinal analysis based on both CLHLS 2011 and 2014, where person-waves are nested 241
in persons, which are nested in cities. The benefit of the longitudinal analysis is that it reduces 242
confounding from unobserved heterogeneity at both the city and individual level.
243
Additionally, to assess whether change in AP between 2011 and 2014 was associated with frailty change 244
between 2011 and 2014, we also fitted another set of random-effects models with Poisson distribution, 245
which we fitted on a balanced dataset where everyone took part in both waves. No one in our data had 246
moved cities between 2011 and 2014. We generated a new variable at the city level for change or 247
stability of AQI category between waves. We fitted the random-effects model using this ‘change in 248
AQI’ variable instead of the main AQI variable, including all of the same covariates, and including a 249
time fixed effect (see Table 5).
250
11 3. Results
251
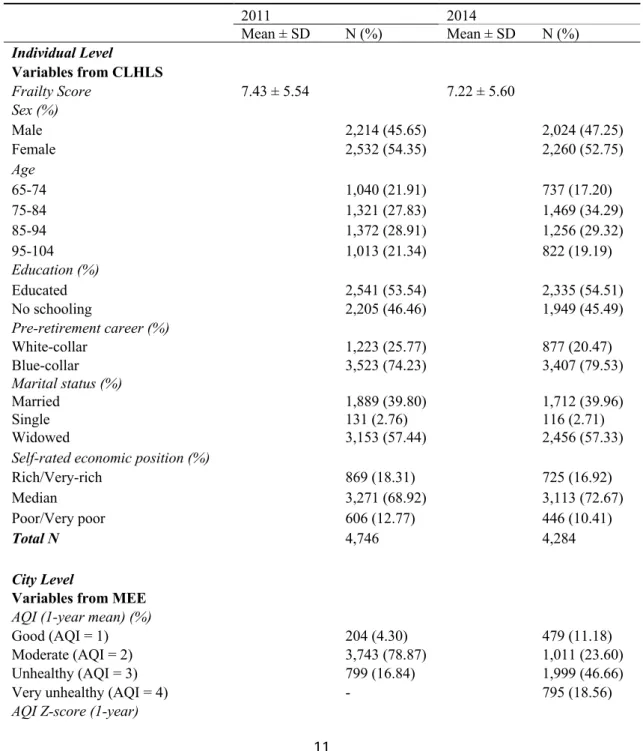
Descriptive statistics for the 4,746 CLHLS sample respondents in 2011 and 4,284 in 2014 are presented 252
in Table 2. This shows that there are some differences in the sample characteristics between the two 253
waves of CLHLS. As could be expected with an ageing sample, the frailty score goes up between 2011 254
and 2014, while the proportions male, educated and blue-collar respondents are relatively stable. The 255
proportion of cities recording ‘unhealthy’ and ‘very unhealthy’ AQI scores increased over time.
256
Table 2 Sample characteristics for analysis sample created from CLHLS, Ministry of Ecology and 257
Environment of China, and Yearbooks 2011 & 2014 258
2011 2014
Mean ± SD N (%) Mean ± SD N (%)
Individual Level Variables from CLHLS
Frailty Score 7.43 ± 5.54 7.22 ± 5.60
Sex (%)
Male 2,214 (45.65) 2,024 (47.25)
Female 2,532 (54.35) 2,260 (52.75)
Age
65-74 1,040 (21.91) 737 (17.20)
75-84 1,321 (27.83) 1,469 (34.29)
85-94 1,372 (28.91) 1,256 (29.32)
95-104 1,013 (21.34) 822 (19.19)
Education (%)
Educated 2,541 (53.54) 2,335 (54.51)
No schooling 2,205 (46.46) 1,949 (45.49)
Pre-retirement career (%)
White-collar 1,223 (25.77) 877 (20.47)
Blue-collar 3,523 (74.23) 3,407 (79.53)
Marital status (%)
Married 1,889 (39.80) 1,712 (39.96)
Single 131 (2.76) 116 (2.71)
Widowed 3,153 (57.44) 2,456 (57.33)
Self-rated economic position (%)
Rich/Very-rich 869 (18.31) 725 (16.92)
Median 3,271 (68.92) 3,113 (72.67)
Poor/Very poor 606 (12.77) 446 (10.41)
Total N 4,746 4,284
City Level
Variables from MEE AQI (1-year mean) (%)
Good (AQI = 1) 204 (4.30) 479 (11.18)
Moderate (AQI = 2) 3,743 (78.87) 1,011 (23.60)
Unhealthy (AQI = 3) 799 (16.84) 1,999 (46.66)
Very unhealthy (AQI = 4) - 795 (18.56)
AQI Z-score (1-year)
12
Daily Z-score -0.40 ± 0.66 -0.06 ± 0.65
Weekly Z-score -0.41 ± 0.44 -0.08 ± 0.47
Monthly Z-score -0.41 ± 0.33 -0.04 ± 0.29
Quarterly Z-score -0.25 ± 0.32 0.09 ± 0.25
Variables from Yearbooks
Logarithm of GDP 10.87 ± 0.41 10.97 ± 0.52
Logarithm of population density 6.39 ± 0.51 6.32 ± 0.54
Number of cities 77 117
Note: Variables in CLHLS are individual level; variables from Ministry of Ecology and Environment of China, and variables from yearbooks are city-level.
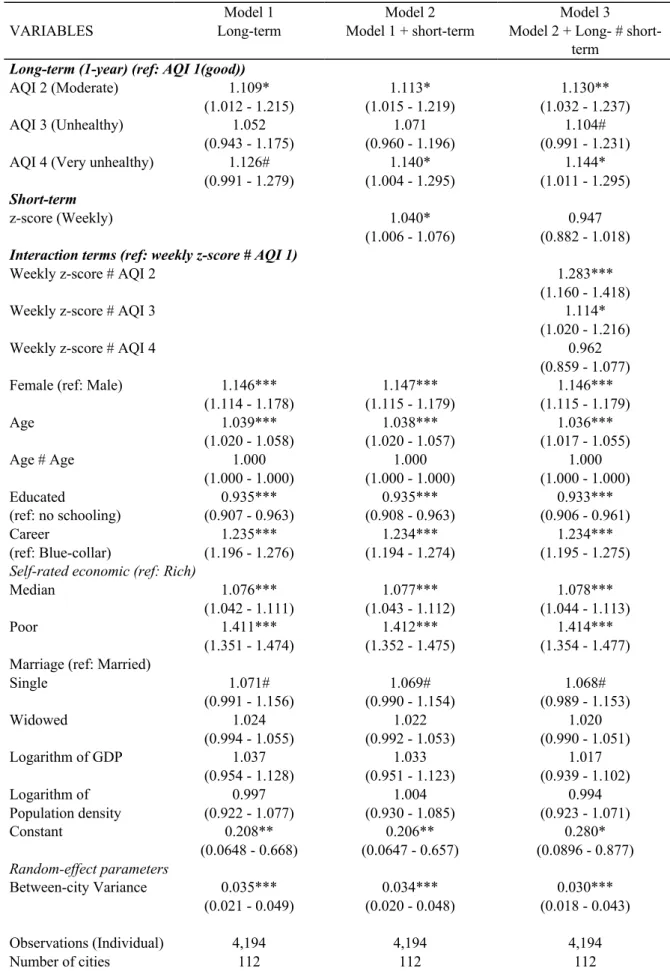
The results from the cross-sectional analysis are shown in Table 3 (in the Supplementary material Table 259
S6 shows more results from different combinations between long-term exposure and z-score). Model 1 260
includes all the covariates and the 1-year AQI exposure mean as the long-term measure. Model 2 adds 261
the weekly z-score to adjust for short-term AQI exposure. Model 3 includes an interaction term between 262
long- and short-term exposure. Overall, the results suggest that long-term AQI exposure is more 263
significantly associated with frailty than short-term weekly exposures. The results from Model 1 show 264
that, compared with those exposed to the AQI 1 (good air quality), the estimated effect of exposure to 265
AQI 4 (very unhealthy air quality) is to increase the incidence rate, and therefore the expected score of 266
frailty index in a year period, by about 12.6% higher, a result significant at the 10% level. In addition, 267
Model 1 also shows that each extra year of age is associated with an estimated 3.9% increase in the 268
incidence rate and the incidence-rate ratio for a 10-year increase in age is estimated as 1.03910 = 1.466, 269
corresponding to a 46.6% increase in the score of frailty index, holding other covariates constant. The 270
estimates also suggest that having some education vs. none is associated with reduced incidence rate 271
(over 5%) and that the frailty incidence rate increases by 23.7% for females relative to males, controlling 272
for the other variables. Similarly, the estimates of self-rated reported economic status show the higher 273
incidence rate of frailty among those with lower economic status. For example, frailty incidence rate 274
increases by 41.4% for respondents with poor self-rated economic status, compared with rich 275
respondents. However, compared with respondents who held blue-collar jobs before retirement, those 276
who had white-collar jobs have higher incident rate, 1.235 (95% CI: 1.196, 1.276), of being frail. We 277
tested whether the impact of air pollution varied by socio-economic status by including interaction 278
terms between sociodemographic factors and exposure to air pollution (results show in the 279
Supplementary material Table S7) but there are no significant effects.
280
13
Table 3 Incidence rate ratio (95% Confidence Intervals) and random-effect parameters of cross-sectional 281
impact of 1-year and weekly exposure to air pollution on frailty among Chinese elderly, CLHLS 2014 282
Model 1 Model 2 Model 3
VARIABLES Long-term Model 1 + short-term Model 2 + Long- # short-
term Long-term (1-year) (ref: AQI 1(good))
AQI 2 (Moderate) 1.109* 1.113* 1.130**
(1.012 - 1.215) (1.015 - 1.219) (1.032 - 1.237)
AQI 3 (Unhealthy) 1.052 1.071 1.104#
(0.943 - 1.175) (0.960 - 1.196) (0.991 - 1.231)
AQI 4 (Very unhealthy) 1.126# 1.140* 1.144*
(0.991 - 1.279) (1.004 - 1.295) (1.011 - 1.295) Short-term
z-score (Weekly) 1.040* 0.947
(1.006 - 1.076) (0.882 - 1.018) Interaction terms (ref: weekly z-score # AQI 1)
Weekly z-score # AQI 2 1.283***
(1.160 - 1.418)
Weekly z-score # AQI 3 1.114*
(1.020 - 1.216)
Weekly z-score # AQI 4 0.962
(0.859 - 1.077)
Female (ref: Male) 1.146*** 1.147*** 1.146***
(1.114 - 1.178) (1.115 - 1.179) (1.115 - 1.179)
Age 1.039*** 1.038*** 1.036***
(1.020 - 1.058) (1.020 - 1.057) (1.017 - 1.055)
Age # Age 1.000 1.000 1.000
(1.000 - 1.000) (1.000 - 1.000) (1.000 - 1.000)
Educated 0.935*** 0.935*** 0.933***
(ref: no schooling) (0.907 - 0.963) (0.908 - 0.963) (0.906 - 0.961)
Career 1.235*** 1.234*** 1.234***
(ref: Blue-collar) (1.196 - 1.276) (1.194 - 1.274) (1.195 - 1.275) Self-rated economic (ref: Rich)
Median 1.076*** 1.077*** 1.078***
(1.042 - 1.111) (1.043 - 1.112) (1.044 - 1.113)
Poor 1.411*** 1.412*** 1.414***
(1.351 - 1.474) (1.352 - 1.475) (1.354 - 1.477) Marriage (ref: Married)
Single 1.071# 1.069# 1.068#
(0.991 - 1.156) (0.990 - 1.154) (0.989 - 1.153)
Widowed 1.024 1.022 1.020
(0.994 - 1.055) (0.992 - 1.053) (0.990 - 1.051)
Logarithm of GDP 1.037 1.033 1.017
(0.954 - 1.128) (0.951 - 1.123) (0.939 - 1.102)
Logarithm of 0.997 1.004 0.994
Population density (0.922 - 1.077) (0.930 - 1.085) (0.923 - 1.071)
Constant 0.208** 0.206** 0.280*
(0.0648 - 0.668) (0.0647 - 0.657) (0.0896 - 0.877) Random-effect parameters
Between-city Variance 0.035*** 0.034*** 0.030***
(0.021 - 0.049) (0.020 - 0.048) (0.018 - 0.043)
Observations (Individual) 4,194 4,194 4,194
Number of cities 112 112 112
14
Note:
1. City-level variables include AQI, z-score, logarithm of GDP per capita, logarithm of population density;
2. *** p<0.001, ** p<0.01, * p<0.05, # p<0.1
In Model 2, when the short-term exposure term (weekly z-score) is included, the effect of long-term 283
exposure is strengthened in effect size and significance, that is those living in cities with a longer-term 284
AQI levels of 4 had higher frailty scores compared to those with AQI level 1, accounting for short-term 285
fluctuations and other covariates. Specifically, compared with exposure to AQI 1, the estimated effect 286
of exposure to AQI 4 is to increase the incidence rate ratio of frailty index score in a given year period, 287
by about 14.0% (p=0.02). Despite a positive coefficient for z-score, this is not significant when adding 288
interaction terms, suggesting that as expected, short-term exposure fluctuations are not associated with 289
the frailty score. The coefficients for marital status, GDP and population density are not significant.
290
We might also expect that the effect of short-term fluctuations might vary by the overall background 291
level of air pollution exposure, and that short-term fluctuations might affect the long-term mean and 292
then result in biased estimates for long-term exposure. Thus, we added interaction terms between long- 293
term exposure and short-term fluctuations. In Model 3, the interaction effects between weekly z-score 294
and yearly mean AQI are not always significant, providing no evidence that short-term exposure has a 295
differential impact on health at different longer-term air pollution levels.
296
In addition, all three models show the city-level specific random effects also appear significant, 297
suggesting that a significant amount of variance in frailty can be explained by city-level factors. For 298
example, in Model 3, the city-level random effects present a residual variance between cities 𝜎" = !"
299
0.030 with the confidence interval (0.018 - 0.043). The other coefficients (marital status, logarithm of 300
GDP per capita and logarithm of population density) are not significant at the 5%-level.
301
In addition, Tables S4 and S5 in the Supplementary material show effects of 2-year and 3-year exposure.
302
The results are mostly consistent with Table 3 (1-year exposure as the long-term exposure). Results 303
estimated using data obtained by means of GWR interpolation for the cross-sectional analysis also 304
supports the above findings (details shown in Supplementary material Table S8), which provide 305
reassurance that our complete case analysis is not substantially biased.
306
15
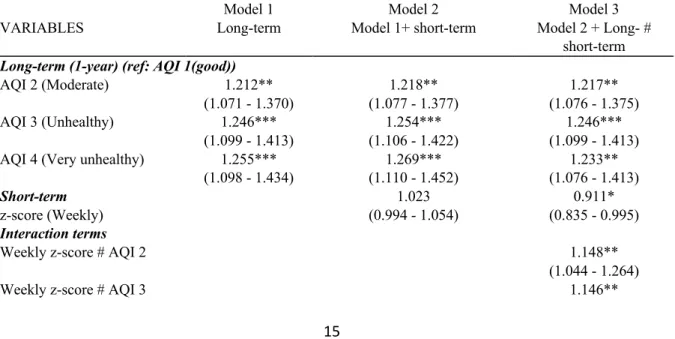
Moving to the longitudinal analysis, we present a similar set of models based on the two-wave panel 307
dataset in Table 4 which model the change in frailty between waves. Results clearly show that long- 308
term (1-year) exposure to air pollution has a positive association with frailty, and poorer air quality is 309
associated with higher frailty over a 3-year period from 2011 to 2014. Compared with the cross- 310
sectional analysis, the estimates of the frailty score associated with long-term exposure are much bigger 311
and more significant. Specifically, in Model 3, compared with those exposed to the AQI 1 (good air 312
quality), the estimated effect of exposure to AQI 4 (very unhealthy air quality) is to increase the 313
incidence rate, and therefore the expected score of frailty index in a year period, by about 23.3%
314
(p=0.003). In terms of the weekly z-score, Model 2 shows that the estimated effect of increasing weekly 315
z-score on frailty is not significant. Similar to the results from the cross-sectional analysis, the 316
interaction terms in Table 4 do not show consistently significant effects on frailty. In the Supplementary 317
material, we used 2-year and 3-year periods as the long-term exposure measure and found that long- 318
term effects are significantly associated with frailty but short-term exposure (weekly z-score) and 319
interaction terms have no significant effects on frailty (details shown in Tables S9-10). The analysis 320
from GWR data shows there is an association of long-term exposure with frailty score in Table S12. In 321
addition, in Table 4, gender, age, education, marital status and career are significantly associated with 322
frailty; but the coefficients of GDP and population density are not significant.
323
Table 4 Incidence rate ratio (95% Confidence Intervals) and random-effect parameters of longitudinal 324
impact of 1-year and weekly exposure to air pollution on frailty among Chinese elderly, CLHLS 2011 &
325
2014 326
Model 1 Model 2 Model 3
VARIABLES Long-term Model 1+ short-term Model 2 + Long- #
short-term Long-term (1-year) (ref: AQI 1(good))
AQI 2 (Moderate) 1.212** 1.218** 1.217**
(1.071 - 1.370) (1.077 - 1.377) (1.076 - 1.375)
AQI 3 (Unhealthy) 1.246*** 1.254*** 1.246***
(1.099 - 1.413) (1.106 - 1.422) (1.099 - 1.413)
AQI 4 (Very unhealthy) 1.255*** 1.269*** 1.233**
(1.098 - 1.434) (1.110 - 1.452) (1.076 - 1.413)
Short-term 1.023 0.911*
z-score (Weekly) (0.994 - 1.054) (0.835 - 0.995)
Interaction terms
Weekly z-score # AQI 2 1.148**
(1.044 - 1.264)
Weekly z-score # AQI 3 1.146**
16
(1.038 - 1.266)
Weekly z-score # AQI 4 1.054
(0.928 - 1.197)
Female (ref: Male) 1.119*** 1.120*** 1.124***
(1.080 - 1.160) (1.080 - 1.161) (1.084 - 1.165)
Age 1.025* 1.024* 1.026*
(1.002 - 1.047) (1.002 - 1.047) (1.004 - 1.049)
Age # Age 1.000 1.000 1.000
(1.000 - 1.000) (1.000 - 1.000) (1.000 - 1.000)
Educated 0.929*** 0.930*** 0.933***
(ref: no schooling) (0.894 - 0.966) (0.894 - 0.966) (0.897 - 0.969)
Career 1.159*** 1.159*** 1.161***
(ref: Blue-collar) (1.112 - 1.208) (1.112 - 1.208) (1.114 - 1.210) Self-rated economic (ref: Rich)
Median 1.120*** 1.120*** 1.121***
(1.084 - 1.157) (1.084 - 1.158) (1.085 - 1.158)
Poor 1.398*** 1.398*** 1.400***
(1.335 - 1.464) (1.336 - 1.464) (1.337 - 1.465) Marriage (ref: Married)
Single 1.120** 1.119** 1.119**
(1.029 - 1.219) (1.028 - 1.218) (1.028 - 1.218)
Widowed 1.048** 1.048** 1.047*
(1.011 - 1.085) (1.011 - 1.085) (1.010 - 1.084)
Logarithm of GDP 1.028 1.028 1.029
(0.956 - 1.106) (0.955 - 1.106) (0.955 - 1.107)
Logarithm of 1.018 1.020 1.018
Population density (0.949 - 1.092) (0.951 - 1.093) (0.949 - 1.091)
Constant 0.199** 0.199** 0.203**
(0.0605 - 0.652) (0.0607 - 0.651) (0.0622 - 0.665)
Year of 2014 (ref: 2011) 1.081*** 1.071*** 1.069***
(1.042 - 1.121) (1.031 - 1.112) (1.029 - 1.110) Random-effect parameters
Between-city Variance 0.017*** 0.016*** 0.016***
(0.008 - 0.025) (0.008 - 0.025) (0.008 - 0.024)
Between-individual Variance 0.281*** 0.281*** 0.280***
(0.264 - 0.298) (0.2614 - 0.297) (0.263 - 0.296)
Observations (Individual) 8,753 8,753 8,753
Number of cities 108 108 108
Note:
1. City-level variables include AQI, z-score, logarithm of GDP per capita, logarithm of population density;
2. *** p<0.001, ** p<0.01, * p<0.05, # p<0.1
327
Additionally, to make the analysis above more robust, we run some similar models but use weekly, 328
monthly and quarterly z-score as the short-term exposure in Table S11. We can see the estimated effect 329
of exposure to long-term air pollution on frailty slightly rises when the measures of short-term exposure 330
refer to different periods, from weekly z-score to quarterly z-score; but short-term fluctuations at a week, 331
a month or a quarter are not significantly associated with frailty even at the 10% level.
332
17
To assess whether long-term exposure to air pollution is associated with a more unfavourable change 333
in frailty between CLHLS 2011 and 2014, we set up two random-effects models using the type of AQI 334
change. Table 5 compares the effects of the change in AQI on the frailty index. Model 1 shows that 335
living in an area where AQI moved from 2 to 3, 2 to 4, or 3 to 4, compared with living in a constant 336
‘AQI 2’ area, is associated with increased frailty scores. Specifically, in Model 1, with AQI worsening 337
from 2 to 4, the incidence rate of frailty increases by about 21.4% (p=0.000), compared with a constant 338
‘AQI 2’. More control variables are added, such as year and other covariates, in Model 2 and Model 3.
339
When controlling all of covariates in Model 3, we can see respondents living in ‘AQI 1-1’, i.e. a constant 340
low level of AP, decreases frailty risk by 21.6% (p<0.001), while those living in ‘AQI 3-3’, i.e. a 341
constant high level, increases the risk by 19.0% (p=0.028), compared with the reference group ‘AQI 2- 342
2’. The same analysis using the GWR-interpolated data shows that the change in AQI is associated with 343
the change in frailty score (Table S13).
344
Table 5 Incidence rate ratio (95% Confidence Intervals) of longitudinal impact of 1-year AQI change on 345
frailty among Chinese elderly from random-effects models, CLHLS 2011 & 2014 346
Model 1: Model 2: Model 3:
VARIABLES Basic Model 1+year Model 2+covariates
AQI change type (ref: AQI 2-2)
AQI 1-1 0.853* 0.835** 0.784***
(0.753 - 0.966) (0.737 - 0.947) (0.698 - 0.880)
AQI 3-3 1.161# 1.145 1.190*
(0.976 - 1.380) (0.963 - 1.362) (1.018 - 1.390)
AQI 2-3 1.055# 1.056# 1.117***
(0.992 - 1.123) (0.992 - 1.124) (1.057 - 1.181)
AQI 2-4 1.214*** 1.203*** 1.163***
(1.113 - 1.324) (1.102 - 1.313) (1.075 - 1.259)
AQI 3-2 0.895 0.872 0.958
(0.696 - 1.150) (0.678 - 1.122) (0.769 - 1.195)
AQI 3-4 1.091* 1.081# 1.090*
(1.008 - 1.182) (0.998 - 1.172) (1.013 - 1.173)
z-score (Weekly) 1.164*** 1.020 1.012
(1.129 - 1.200) (0.986 - 1.055) (0.980 - 1.046)
Observations (Individual) 5,926 5,926 5,926
Number of cities 73 73 73
Note:
1.Model 2 includes time variables;
2.Model 3 includes control variables at individual level include sex, age, age square, marital status, education, self-rated economic, career; City-level variables include AQI, z-score, logarithm of GDP per capita, logarithm of population density and year;
3. *** p<0.001, ** p<0.01, * p<0.05, # p<0.1
347
18 4. Discussion
348
We conducted cross-sectional and longitudinal analysis among Chinese elderly people based on 349
CLHLS, a national dataset, linked to air pollution monitoring station data, to investigate the association 350
between air pollution at the city level and frailty. We also calculated comprehensive measures to assess 351
and adjust models for long- and short-term AP exposure. We identified that the frailty score among 352
Chinese elderly 65+ was strongly associated with long-term exposure (1-year) to AP rather than short- 353
term fluctuations, after individual and neighbourhood characteristics are controlled. Moreover, we also 354
established that living in a city with worsening AP over a three-year period, compared with one where 355
air pollution was stable, was associated with a higher incident frailty score, suggesting that increasing 356
air pollution could exacerbate the ageing process.
357
It is already well established that air pollution has an impact on elderly health in terms of individual 358
diseases, (Zeng et al., 2010), and others have established that in sub-populations AP is linked to the 359
development of frailty (Lüscher, 2017; Myers et al., 2013). This is the first study to our knowledge to 360
establish a longitudinal link between air pollution and frailty in the general elderly population. Previous 361
research about AP and frailty has not explored the role of long- and short-term exposure. As expected, 362
due to the chronic nature of many of the indicators in the frailty index, long-term exposure was the 363
dominant influence. However, this lack of association could also be related to the way health data were 364
collected. Given a source of health data that captured health shocks more adequately, such as acute 365
hospital admissions, it is plausible that short-term exposures may influence some components of frailty.
366
The associations between frailty and other covariates showed expected links with sex (women have a 367
higher frailty score than men), education (people with no schooling have a higher frailty score) and SES 368
(people with lower SES have a higher frailty score). However, it is interesting that respondents with 369
white-collar jobs before their retirement are much frailer than those who had worked in blue-collar jobs, 370
which seems to be incompatible with previous findings, because the effects of career should be same to 371
the effects of education and economic status (Goodman et al., 2011; O’Neill et al., 2003). Explanations 372
for this contradictory result should consider the social structure in China. Respondents with white-collar 373
19
jobs as their main occupation before retirement typically live in cities because most of them are well- 374
educated or working for government, whereby work opportunities depend on education and political 375
loyalty before the 1980s in China (Walder, 1995). In addition, urban residents have access to more 376
ancillary services to acquire health diagnoses than their rural counterparts (Mueser et al., 2001), which 377
might explain an underestimation of the incidence rate of diseases among rural residents. Popkin et al.
378
(1995) proposed that urban residents or high-income populations are likely to have higher fat intake 379
and lower physical activity. There is evidence showing urban adults in China have a higher probability 380
of being obese (Chen et al., 2011) and having hypertension (Xiaohui Hou, 2008). All of those reasons 381
can explain the association of white-collar jobs with higher risks of being frail in this study. Note that 382
all interactions between AP and these socio-demographic factors were insignificant, meaning that the 383
impact of AP on health is uniform regardless of socio-economic status.
384
In this study, frailty is positively related to long-term exposure to air pollution rather than short-term 385
fluctuations. This is partly contrary to what has been found in previous studies, which identified short- 386
term exposure to air pollution are associated with hospitalisation due to cardiovascular and respiratory 387
diseases (Raza et al., 2018), which are components of our frailty index. For example, Bedada et al.
388
(2012) found a positive association between short-term exposure to sulphur dioxide and stroke. As 389
another example, an increase of weekly exposure to ozone was associated with a decrease of 390
cardiopulmonary function (Karakatsani et al., 2017). However, it is likely that chronic conditions based 391
on survey self-reports are less sensitive to these recent short-term effects, which could explain why 392
short-term AP fluctuations were not found to be significant.
393
This study has not found a consistent interaction effect of long- and short-term exposure on frailty 394
among Chinese elderly people. However, this finding provides a more solid evidence to examine the 395
effect of long-term exposure than previous researches. For example, Zhang et al. (2018) recognised that 396
exploring the impact of exposure to AP on cognitive ability should consider the cumulative and 397
transitory exposure AP together. However, they neglected the variance of cumulative exposure to AP 398
and the collinearity between the mean of cumulative exposure and the mean of transitory exposure to 399
20
AP. In this study, using a z-score to operationalize and control short-term exposure to AP more 400
accurately measures the association between long-term exposure and frailty.
401
Our study has several methodological advantages over previous studies. First, the linkages of survey 402
data with air quality data were established using exact interview date and locations, enabling us to 403
accurately identify temporal trends in air pollution, even if interview dates varied between respondents.
404
We also used a comprehensive validated frailty index. Moreover, we exploited the available AP data to 405
measure both the average AQI exposure and the level of AQI short-term fluctuation through the AQI 406
z-score. Third, the samples in this study were aged 65 and more, a population who are vulnerable to 407
exposure to air pollution, rarely migrating and moving their residences, hardly changing their 408
socioeconomic status. Thus, the analysis was more likely to identify associations of exposure to air 409
when they are unaffected by time varying confounding. Finally, this study used a GWR method to 410
interpolate missing air pollution data, which provides reassurance as to the robustness of the results, 411
and that the complete case analysis was not biased. GWR contains more parameters (spatial information 412
and socioeconomic factors) for interpolation, which improves previous imputation or interpolation 413
approaches.
414
Several limitations should be considered in this study. First, our analyses do not include all of the 415
CLHLS sample, only using 60% respondents due to missing of AQI data, which cannot be nationally 416
representative. However, robustness checks using GWR to interpolate missing data suggested our 417
sample did not lead to biased estimates. Second, our AQI data is city-level; however, there is likely to 418
be variation of AQI within a city. This measure cannot compare the difference between respondents 419
within the same city, despite using the multilevel modelling in this study. Third, the explanatory variable 420
is a composite index of AP rather than specific air pollutants (such as PM10, ozone, SO2 etc.), and we 421
cannot separate the effect of each component of AQI. Nevertheless, numerous studies have used AQI 422
and found that it is a robust estimate of health risks (Li et al., 2015; Stieb et al., 2005). Fourth, as only 423
two waves of data are used in this paper, we are unable to truly understand trajectories of frailty (for 424
that, we need 3 waves, and our linked data are not sufficient). Furthermore, some unmeasured time- 425
variant variables, such as health or social-environmental factors, cannot be ruled out in this study, which 426
21
might affect the relationship we estimated. In addition, we are unable to address survival bias, a 427
perennial question in epidemiology. Finally, participation bias should be noted as all indicators of frailty 428
are self-rated, and some people could be suffering from conditions but not diagnosed. Therefore, our 429
estimations possibly underestimate the level of frailty.
430
5. Conclusions 431
This study expands the evidence that long-term exposure to air pollution contribute to higher incidence 432
of frailty among Chinese elderly people, when controlled for sex, age, self-rated economic status, 433
education, career, marital status, regional factors (GDP per capita and population density) and interview 434
time. Moreover, it suggests that worsening air quality may influence poorer frailty trajectories. Further 435
research is needed using a longer time span of data to understand how the interaction between short- 436
and long-term exposure to air pollution accumulate to affect elderly health trajectories. Our results 437
highlight the importance of improving air pollution for successful healthy ageing.
438 439
Declaration of Competing Interest 440
All authors declared no conflicts of interests.
441
Acknowledgments 442
This study is supported by China Scholarship Council (CSC), People’s Republic of China, and 443
Population and Health Research Group, School of Geography and Sustainable Development, University 444
of St Andrews, UK. We are grateful to Prof. Hill Kulu who made some critical suggestions for the final 445
manuscript.
446
References 447
Bai, L., Weichenthal, S., Kwong, J.C., Burnett, R.T., Hatzopoulou, M., Jerrett, M., van Donkelaar, A., 448
Martin, R. V, Van Ryswyk, K., Lu, H., Kopp, A., Chen, H., 2019. Associations of Long-Term 449
Exposure to Ultrafine Particles and Nitrogen Dioxide With Increased Incidence of Congestive 450
Heart Failure and Acute Myocardial Infarction. Am. J. Epidemiol. 188, 151–159.
451
https://doi.org/10.1093/aje/kwy194 452
Bedada, G.B., Smith, C.J., Tyrrell, P.J., Hirst, A.A., Agius, R., 2012. Short-term effects of ambient 453
22
particulates and gaseous pollutants on the incidence of transient ischaemic attack and minor 454
stroke: A case-crossover study. Environ. Heal. 11, 77. https://doi.org/10.1186/1476-069X-11-77 455
Brunekreef, B., Holgate, S.T., 2002. Air pollution and health. Lancet 360, 1233–1242.
456
https://doi.org/10.1016/S0140-6736(02)11274-8 457
Cesari, M., Gambassi, G., Van Kan, G.A., Vellas, B., 2014. The frailty phenotype and the frailty 458
index: Different instruments for different purposes. Age Ageing 43, 10-12.
459
https://doi.org/10.1093/ageing/aft160 460
Charafeddine, R., Boden, L.I., 2008. Does income inequality modify the association between air 461
pollution and health? Environ. Res. 106, 81–88. https://doi.org/10.1016/j.envres.2007.09.005 462
Chen, T.-J., Modin, B., Ji, C.-Y., Hjern, A., 2011. Regional, socioeconomic and urban-rural 463
disparities in child and adolescent obesity in China: a multilevel analysis. Acta Paediatr. 100, 464
1583–1589. https://doi.org/10.1111/j.1651-2227.2011.02397.x 465
Cochran, L.S., Pielke, R.A., Kovács, E., 1992. Selected international receptor-based air quality 466
standards. J. Air Waste Manag. Assoc. 42, 1567–1572.
467
https://doi.org/10.1080/10473289.1992.10467099 468
Dauchet, L., Hulo, S., Cherot-Kornobis, N., Matran, R., Amouyel, P., Edmé, J.L., Giovannelli, J., 469
2018. Short-term exposure to air pollution: Associations with lung function and inflammatory 470
markers in non-smoking, healthy adults. Environ. Int. 121, 610–619.
471
https://doi.org/10.1016/j.envint.2018.09.036 472
Ebenstein, A., Fan, M., Greenstone, M., He, G., Yin, P., Zhou, M., 2015. Growth, pollution, and life 473
expectancy: China from 1991-2012, in: American Economic Review. pp. 226–231.
474
https://doi.org/10.1257/aer.p20151094 475
Eckel, S.P., Louis, T.A., Chaves, P.H.M., Fried, L.P., Margolis, A.H.G., 2012. Modification of the 476
association between ambient air pollution and lung function by frailty status among older adults 477
in the cardiovascular health study. Am. J. Epidemiol. 176, 214–223.
478
https://doi.org/10.1093/aje/kws001 479
Fang, E.F., Scheibye-Knudsen, M., Jahn, H.J., Li, J., Ling, L., Guo, H., Zhu, X., Preedy, V., Lu, H., 480
Bohr, V.A., Chan, W.Y., Liu, Y., Ng, T.B., 2015. A research agenda for aging in China in the 481
21st century. Ageing Res. Rev. 24, 197–205. https://doi.org/10.1016/J.ARR.2015.08.003 482
Fougère, B., Vellas, B., Billet, S., Martin, P.J., Gallucci, M., Cesari, M., 2015. Air Pollution modifies 483
the association between successful and pathological aging throughout the frailty condition.
484
Ageing Res. Rev. 24, 299–303. https://doi.org/10.1016/J.ARR.2015.09.004 485
Fried, L.P., Tangen, C.M., Walston, J., Newman, A.B., Hirsch, C., Gottdiener, J., Seeman, T., Tracy, 486
R., Kop, W.J., Burke, G., McBurnie, M.A., 2001. Frailty in Older Adults: Evidence for a 487
Phenotype. Journals Gerontol. Ser. A Biol. Sci. Med. Sci. 56, M146–M157.
488
https://doi.org/10.1093/gerona/56.3.m146 489
García-Esquinas, E., Rodríguez-Artalejo, F., 2017. Environmental Pollutants, Limitations in Physical 490
Functioning, and Frailty in Older Adults. Curr. Environ. Heal. reports.
491
https://doi.org/10.1007/s40572-017-0128-1 492
Gerber, Y., Myers, V., Broday, D.M., Steinberg, D.M., Yuval, Koton, S., Drory, Y., 2014. Frailty 493
status modifies the association between air pollution and post-myocardial infarction mortality: A 494
20-year follow-up study. J. Am. Coll. Cardiol. https://doi.org/10.1016/j.jacc.2014.01.026 495
Goodman, A., Wilkinson, P., Stafford, M., Tonne, C., 2011. Characterising socio-economic 496
inequalities in exposure to air pollution: A comparison of socio-economic markers and scales of 497 measurement. Health Place 17, 767–774.
498
https://doi.org/10.1016/J.HEALTHPLACE.2011.02.002 499
23
Gu, D., Dupre, M.E., Sautter, J., Zhu, H., Liu, Y., Yi, Z., 2009. Frailty and mortality among chinese at 500 advanced ages. Journals Gerontol. - Ser. B Psychol. Sci. Soc. Sci. 64, 279–289.
501
https://doi.org/10.1093/geronb/gbn009 502
Gu, J., Chao, J., Chen, W., Xu, H., Wu, Z., Chen, H., He, T., Deng, L., Zhang, R., 2017.
503
Multimorbidity in the community-dwelling elderly in urban China. Arch. Gerontol. Geriatr. 68, 504
62–67. https://doi.org/10.1016/j.archger.2016.09.001 505
Jones, D.M., Song, X., Rockwood, K., 2004. Operationalizing a Frailty Index from a Standardized 506 Comprehensive Geriatric Assessment. J. Am. Geriatr. Soc. 52, 1929–1933.
507
https://doi.org/10.1111/j.1532-5415.2004.52521.x 508
Kampa, M., Castanas, E., 2008. Human health effects of air pollution. Environ. Pollut. 151, 362–367.
509
https://doi.org/10.1016/J.ENVPOL.2007.06.012 510
Karakatsani, A., Samoli, E., Rodopoulou, S., Dimakopoulou, K., Papakosta, D., Spyratos, D., Grivas, 511
G., Tasi, S., Angelis, N., Thirios, A., Tsiotsios, A., Katsouyanni, K., 2017. Weekly personal 512
ozone exposure and respiratory health in a panel of Greek schoolchildren. Environ. Health 513
Perspect. 125, 1–7. https://doi.org/10.1289/EHP635 514
Kojima, G., Iliffe, S., Walters, K., 2018. Frailty index as a predictor of mortality: a systematic review 515
and meta-analysis. Age Ageing 47, 193–200. https://doi.org/10.1093/ageing/afx162 516
Lei, X., Sun, X., Strauss, J., Zhao, Y., Yang, G., Hu, P., Hu, Y., Yin, X., 2014. Health outcomes and 517
socio-economic status among the mid-aged and elderly in China: Evidence from the CHARLS 518
national baseline data. J. Econ. Ageing 3, 29–43. https://doi.org/10.1016/j.jeoa.2014.05.001 519
Li, L., Lin, G.Z., Liu, H.Z., Guo, Y., Ou, C.Q., Chen, P.Y., 2015. Can the Air Pollution Index be used 520
to communicate the health risks of air pollution? Environ. Pollut. 205, 153–160.
521
https://doi.org/10.1016/j.envpol.2015.05.038 522
Liu, C., Chen, R., Zhao, Y., Ma, Z., Bi, J., Liu, Y., Meng, X., Wang, Y., Chen, X., Li, W., Kan, H., 523
2017. Associations between ambient fine particulate air pollution and hypertension: A 524
nationwide cross-sectional study in China. Sci. Total Environ. 584–585, 869–874.
525
https://doi.org/10.1016/J.SCITOTENV.2017.01.133 526
Liu, C., Yang, C., Zhao, Y., Ma, Z., Bi, J., Liu, Y., Meng, X., Wang, Y., Cai, J., Kan, H., Chen, R., 527
2016. Associations between long-term exposure to ambient particulate air pollution and type 2 528
diabetes prevalence, blood glucose and glycosylated hemoglobin levels in China. Environ. Int.
529
92–93, 416–421. https://doi.org/10.1016/j.envint.2016.03.028 530
Liu, H., Liu, S., Xue, B., Lv, Z., Meng, Z., Yang, X., Xue, T., Yu, Q., He, K., 2018. Ground-level 531
ozone pollution and its health impacts in China. Atmos. Environ. 173, 223–230.
532
https://doi.org/10.1016/J.ATMOSENV.2017.11.014 533
Liu, R., Young, M.T., Chen, J.-C., Kaufman, J.D., Chen, H., 2016. Ambient Air Pollution Exposures 534
and Risk of Parkinson Disease. Environ. Health Perspect. 124, 1759–1765.
535
https://doi.org/10.1289/EHP135 536
Lüscher, T.F., 2017. Frontiers of Prevention: Pollution, Infection, Cognitive Function and Frailty.
537
Eur. Heart J. 38, 3179–3182. https://doi.org/10.1093/eurheartj/ehx680 538
Ma, Z., Hu, X., Sayer, A.M., Levy, R., Zhang, Q., Xue, Y., Tong, S., Bi, J., Huang, L., Liu, Y., 2016.
539
Satellite-based spatiotemporal trends in PM2.5concentrations: China, 2004-2013. Environ.
540
Health Perspect. 124, 184–192. https://doi.org/10.1289/ehp.1409481 541
Ministry of Ecology and Environment of China, 2012. Technical Regulation on Ambient Air Quality 542
Index [WWW Document]. URL
543 https://web.archive.org/web/20190713234941/http://kjs.mee.gov.cn/hjbhbz/bzwb/jcffbz/201203/
544
W020120410332725219541.pdf (accessed 5.2.20).
545
24
Mueser, K.T., Essock, S.M., Drake, R.E., Wolfe, R.S., Frisman, L., 2001. Rural and urban differences 546 in patients with a dual diagnosis. Schizophr. Res. 48, 93–107. https://doi.org/10.1016/S0920- 547
9964(00)00065-7 548
Myers, V., Broday, D.M., Steinberg, D.M., Yuval, Drory, Y., Gerber, Y., 2013. Exposure to 549
particulate air pollution and long-term incidence of frailty after myocardial infarction. Ann.
550
Epidemiol. 23, 395–400. https://doi.org/10.1016/J.ANNEPIDEM.2013.05.001 551
National Bureau of Statistics of China, 2010. Tabulation on the 2010 population census of China by 552
county, 2nd ed. China Statistics Press.
553
O’Neill, M.S., Jerrett, M., Kawachi, I., Levy, J.I., Cohen, A.J., Gouveia, N., Wilkinson, P., Fletcher, 554
T., Cifuentes, L., Schwartz, J., Workshop on Air Pollution and Socioeconomic Conditions, W.
555
on A.P. and S., 2003. Health, wealth, and air pollution: advancing theory and methods. Environ.
556
Health Perspect. 111, 1861–70.
557
Popkin, B.M., Paeratakul, S., Zhai, F., Ge, K., 1995. Dietary and Environmental Correlates of Obesity 558
in a Population Study in China. Obes. Res. 3, 135s-143s. https://doi.org/10.1002/j.1550- 559
8528.1995.tb00456.x 560
Ranft, U., Schikowski, T., Sugiri, D., Krutmann, J., Krämer, U., 2009. Long-term exposure to traffic- 561
related particulate matter impairs cognitive function in the elderly. Environ. Res. 109, 1004–
562
1011. https://doi.org/10.1016/j.envres.2009.08.003 563
Raza, A., Dahlquist, M., Lind, T., Ljungman, P.L.S., 2018. Susceptibility to short-term ozone 564
exposure and cardiovascular and respiratory mortality by previous hospitalizations. Environ.
565
Heal. 17, 37. https://doi.org/10.1186/s12940-018-0384-z 566
Richardson, E.A., Pearce, J., Kingham, S., 2011. Is particulate air pollution associated with health and 567
health inequalities in New Zealand? Heal. Place 17, 1137–1143.
568
https://doi.org/10.1016/j.healthplace.2011.05.007 569
Ruggieri, M., Plaia, A., 2012. An aggregate AQI: Comparing different standardizations and 570
introducing a variability index. Sci. Total Environ. 420, 263–272.
571
https://doi.org/10.1016/j.scitotenv.2011.09.019 572
Scheers, H., Nawrot, T.S., Nemery, B., Casas, L., 2018. Changing places to study short-term effects 573
of air pollution on cardiovascular health: a panel study. Environ. Heal. 17, 80.
574
https://doi.org/10.1186/s12940-018-0425-7 575
Signoretta, P.E., Buffel, V., Bracke, P., 2019. Mental wellbeing, air pollution and the ecological state.
576
Health Place 57, 82–91. https://doi.org/10.1016/J.HEALTHPLACE.2019.03.003 577
Stieb, D.M., Doiron, M.S., Blagden, P., Burnett, R.T., 2005. Estimating the Public Health Burden 578
Attributable to Air Pollution: An Illustration Using the Development of an Alternative Air 579
Quality Index. J. Toxicol. Environ. Heal. Part A 68, 1275–1288.
580
https://doi.org/10.1080/15287390590936120 581
Sun, R., Gu, D., 2008. Air pollution, economic development of communities, and health status among 582
the elderly in urban China. Am. J. Epidemiol. 168, 1311–1318.
583
https://doi.org/10.1093/aje/kwn260 584
United Nations, 2019. World Population Prospects 2019 [WWW Document]. URL 585
https://population.un.org/wpp/Graphs/Probabilistic/POP/65plus/156 (accessed 5.2.20).
586
Walder, A.G., 1995. Career Mobility and the Communist Political Order. Am. Sociol. Rev. 60, 309.
587
https://doi.org/10.2307/2096416 588
Walston, J., Hadley, E.C., Ferrucci, L., Guralnik, J.M., Newman, A.B., Studenski, S.A., Ershler, 589
W.B., Harris, T., Fried, L.P., 2006. Research Agenda for Frailty in Older Adults: Toward a 590