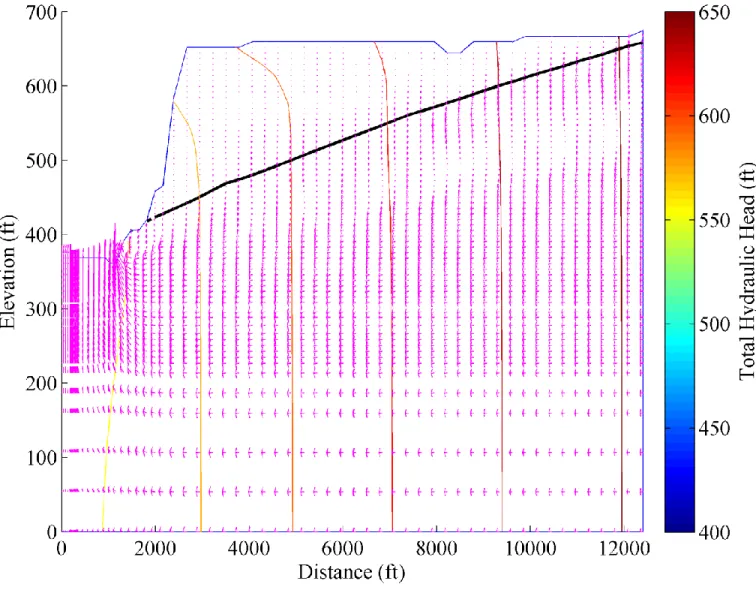
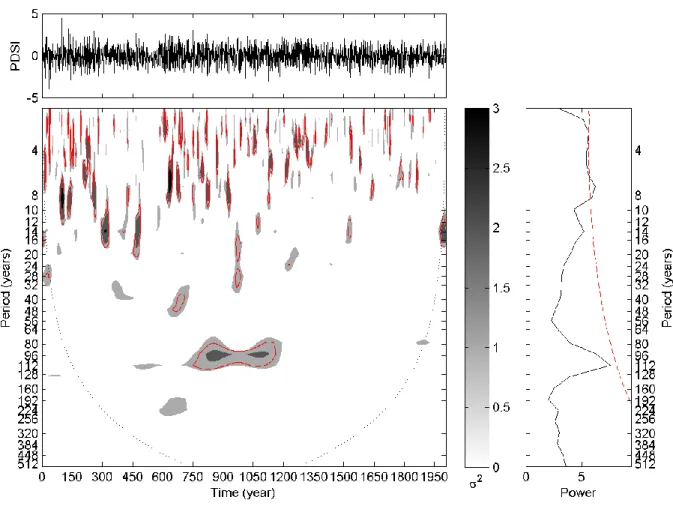
2008] Drought reconstruction in Canada, the United States and Mexico..59 Figure 3.2 | Reconstructed PDSI time series (top), continuous wave spectrum (bottom), and global wave spectrum (right) for grid number 32 of Cook et al. 2002] ..88 Figure 4.4 | Boundary assignments for the numerical solution domain ..105 Figure 4.5 | Groundwater flow field for base simulation; the thick black line represents the water table, and the contours represent lines of constant total hydraulic head..115. October Figure 4.7 | Normal daily component of specific discharge in the drainage face element along the river channel at the top of the landslide and hourly river staffs for October 1, 2007 to.
Background to the Problem
To date, much of the research on the impacts of land use change has focused on two issues: (1) the effects of land use change on climate [Bonan, 1997; DeFries and Eshleman, 2004;. Identifying and quantifying the hydrological impacts of land use changes are major undertakings and are complicated by: 1) the length and continuity of hydrological data; The science of the hydrological consequences of land use change can benefit from more than just this traditional distinction at the macro level.
Structure of Dissertation
DROUGHT PLANNING AND MANAGEMENT: USING HIGH SPATIAL
Introduction
Water scarcity is a common problem in many parts of the world [Intergovernmental Panel on Climate Change, 2008]. For example, regional values of the Palmer index are one of the key parameters that make up the current drought monitoring scheme in the USA [Svoboda et al., 2002]. Studies have used regional Palmer index values within probabilistic models such as Markov chain models [Lohani and Loganathan, 1997;.
Data and Methods
- Overview of the Palmer Drought Model
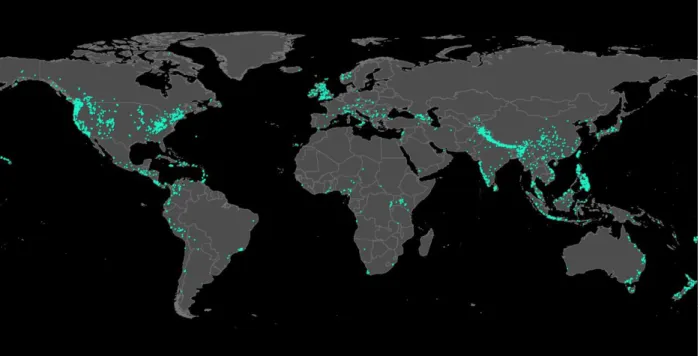
- Study Area
- Data
- Quantifying Differences
- Understanding Spatial Differences
Critical values of the K-S statistic 𝐷𝑚𝑛 were estimated using resampling tests for each of the 584 grid box–climate pairs. The differences between the Z Grid Index time series and the Z Climate Division Index time series were. AWC differences for each pair were calculated by subtracting the climate division value from the grid box value.
Results
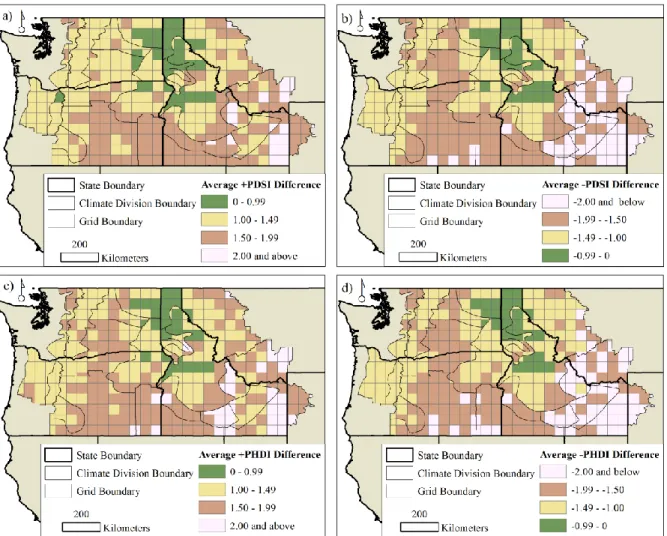
The resampled K-S test results for PDSI and PHDI, however, are spatially consistent with mean positive and negative differences in the grid box and PDSI and PHDI climate partition (Figures 2.5a – 2.5d). Forty-nine percent of grid box-climate separation pairs experience PDSI differences greater than or equal to two at least thirty percent of the time (Figure 2.6a). Similarly, fifty-six percent of climate-grid box separation pairs experience PHDI differences greater than or equal to two at least thirty percent of the time (Figure 2.6b).

Discussion
EVIDENCE OF SOLAR FORCING OF HYDROCLIMATE CYCLES IN THE
Introduction
2005] argued that both Pacific and Atlantic decadal variability contribute significantly to the low-frequency modulation of wetness and dryness over North America. It is also known that several well-known climate transitions occurred in the late Holocene before the transition from the Little Ice Age during the late 19th and early 20th centuries: the transition to the Medieval Climate Anomaly (~800 AD) during the late Variability in radiation emitted by the Sun has been suggested as a possible driver of lower frequency climate cycles [ Horiuchi et al ., 2008 ; Knudsen et al., 2009].
Data
- Study Area
- Drought Data
- Solar Data
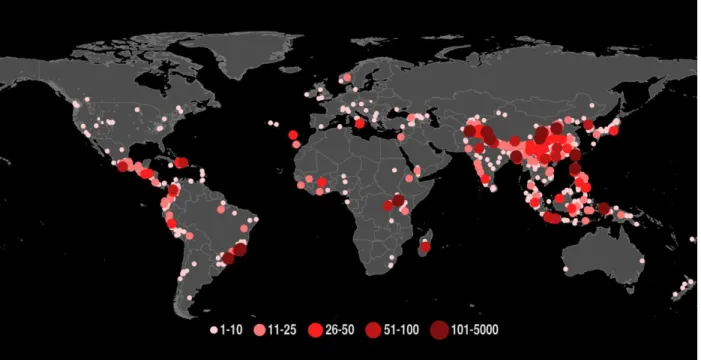
The method used to reconstruct the PDSI grid from tree rings is the point-by-point regression (PPR) method [Cook et al., 1999], which has been shown to be a robust method for. For a detailed explanation of how the PDSI reconstructions were updated for AD 2006, the reader is again referred to the online supporting material of Cook et al. A reconstructed record of total solar irradiance [ Steinhilber et al ., 2009a ] was also used in this study.
![Figure 3.1 | PDSI Grid for Cook et al. [2008] Drought Reconstructions in Canada, United States, and Mexico](https://thumb-ap.123doks.com/thumbv2/123dok/10730009.0/59.918.124.780.129.640/figure-pdsi-drought-reconstructions-canada-united-states-mexico.webp)
Methods
- Determining Periodic Oscillations
- Linking Periodic Oscillations
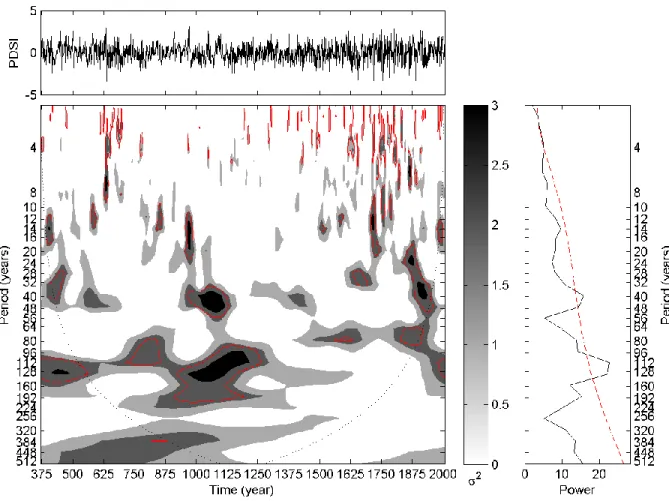
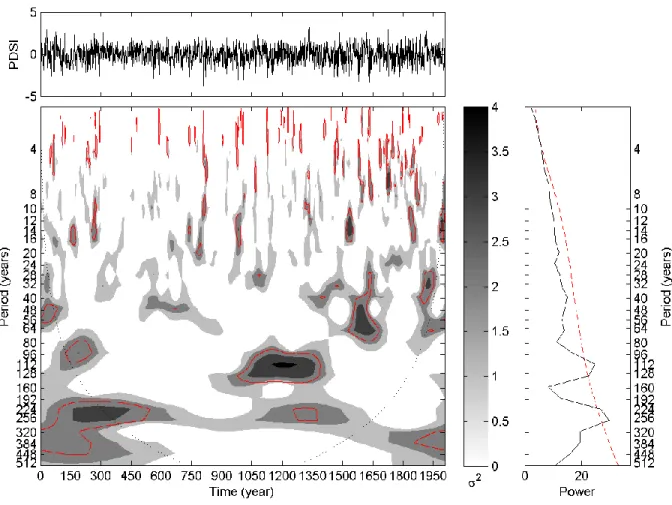
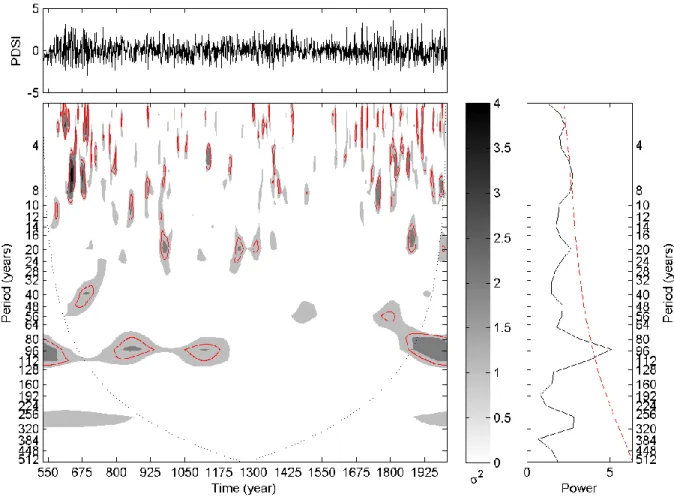
Since the time series are of finite length, errors will appear at the beginning and end of the power spectrum of the waltzes. The global wavelet spectrum has been shown to provide an unbiased and consistent estimate of the actual time series power spectrum [ Percival , 1995 ]. The level of statistical significance of the coherence of the waltzes is estimated using Monte Carlo methods [Grinsted et al., 2004].
Results
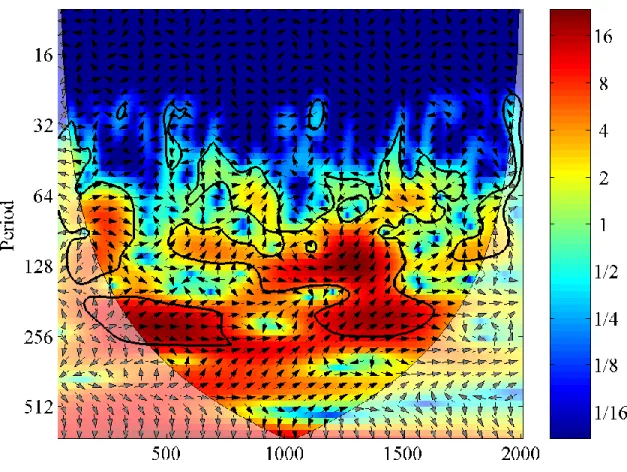
This period range partially characterizes the variability in the North Pacific Ocean, and also corresponds to that of the Gleissburg solar cycle. For a number of raster boxes with a record from 2006, a peak at 224-256 years emerges (Figure 3.4); however, locally these periods occur both within and outside the COI. From the cross-wave transforms of the resampled PDSI and the reconstructed total solar irradiance, large parts of the ordinary power exist at wavelengths ranging from ~64-256 years (Figures 3.5 and 3.6).
The cross-wave transforms show that PDSI and total solar irradiance are in phase over many of the low-frequency sectors with significant common power. Compared to the cross-wave transforms, a smaller portion of the quadratic wave coherence stands out as significant, and most of these regions show an in-phase relationship between them. Oscillations in the total solar irradiance manifest in the PDSI at wavelengths ranging from ~64-256 years.
Because both time series are resampled from 40-year averages, the low-frequency scales of ~96-256 are of more interest here. The 5% significance level against red noise is shown as a thin red contour on the continuous wave spectrum. The relative phase relationship is shown as arrows (with in-phase pointing to the right and anti-phase to the left).
Discussion
THE RELATIVE INFLUENCE OF LAND USE CHANGE AND CLIMATE
Introduction
This is mainly the result of the increasing exposure of people and infrastructure to landslides, driven by land use change and urbanization. Increased recharge – whether from intense or prolonged rainfall or land use change – and subsequent groundwater flow are among the most important factors that cause landslides [Johnson and Sitar, 1990; from Asch et al., 1999]. Increasing pore water pressure reduces the soil cohesion in the subsurface and shear strength of the soil, which can cause the buoyancy forces to overcome the resistance forces on a hillslope and trigger a landslide [Iverson, 2000; Wieczorek, 1996].
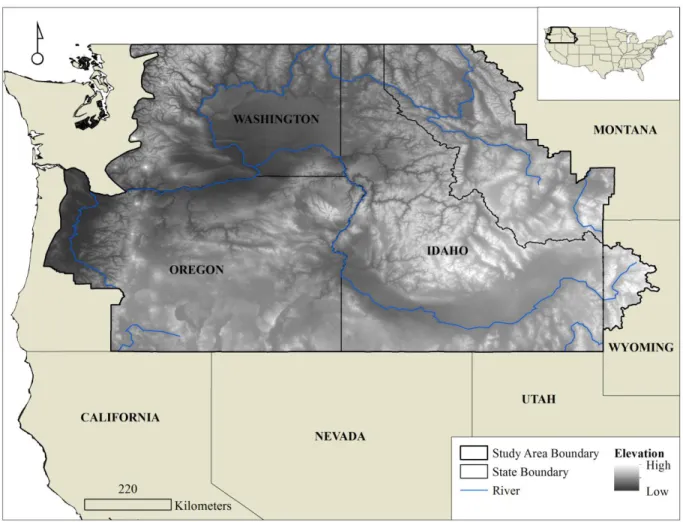
Changes in climate and land use pose risks to slope stability along the White Bluffs of the Columbia River in south-central Washington state, but the direction and relative magnitude of these impacts are still a matter of debate among local Indian tribes and the agency's government. Of particular interest to all parties is the Locke Island Landslide Complex in the eastern channel of the Columbia River and across from the Hanford Nuclear Reservation. Although there is no doubt that land use significantly affects the probability of landslides [Glade, 2003; Petley et al., 2007; Tasser et al., 2003], the influence of irrigation from.
For land managers and policy makers, assessing the impact of human-induced changes is necessary to take preventive measures. This study uses a variation of this approach due to the lack of most physical parameters associated with slope stability modeling. Of particular importance to understanding the hydrological context for the initial failure and longer-term stability of the Locke Island landslide are the subsurface recharge and flow conditions and the groundwater-river exchanges before and during the period of landslide to its current configuration.
Interpretations of modeling results aim to provide a physically based understanding of the processes that contribute to the initial failure and long-term stability of the landslide.
Methods
- Elements of the Work
- Site Description
- Dimensionality of Landslide Activity
- Climate and Land Use Characteristics
- Site Geology
- Model Development
- Groundwater Flow Model
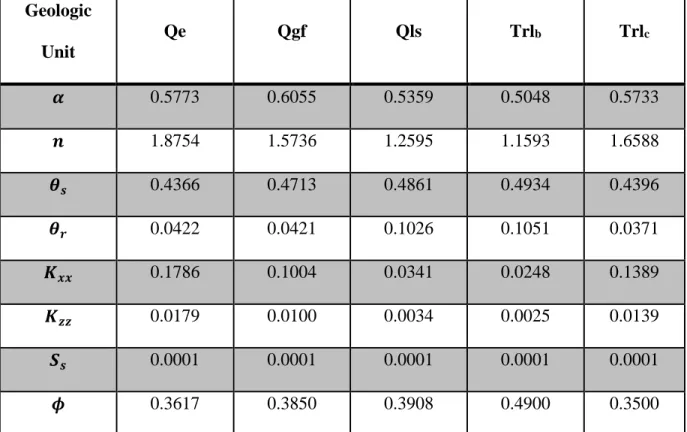
- Selection of Water Retention Parameters and Hydraulic Properties
- Finite Element Discretization
- Numerical Solution
- Finite Element Mesh and Initial and Boundary Conditions
- Simulation Descriptions
Locke Island is located in the Hanford Reach of the Columbia River, in south-central Washington state, about 40 km (25 mi) upstream from Richland, Washington. Locke Island is located approximately in the middle of the Columbia River; it is about 3.5 km long and is generally about 375 m wide. In an effort to stop subsidence, the dams were completely drained in the middle of the next decade.
The base layer consists of the Columbia River Basalt Group and slopes generally toward the river [Triangle Associates, Inc., 2003]. 𝐾𝑥𝑥, 𝐾𝑧𝑧 principal components of the hydraulic conductivity tensor, aligned with the 𝑥 and 𝑧 directions, respectively [LT-1];. The exponent in the approximation of the relationship between water saturation and relative permeability (𝑑 in Equation (4.4)) is directly related to the pore size distribution of the porous media [Winter, 1983].
The smaller the value of 𝑑, the closer the relationship is to linear; the curve for 𝑑 = 1 is a straight line [Winter, 1983]. For this simulation, rainfall recharge was held constant at ft/hr or 20 mm/yr, which is at the upper limit of the estimated natural recharge rate across the river at the Hanford site [ Rockhold et al ., 2009 ]. Water table elevation in one of the wells along cross section F-F' of Bennett et al.
Pond recharge was limited to rainfall recharge during the last 10 years of the simulation period.
Results
In fact, global climate models predict only small changes in annual precipitation (relative to variability) and show increases and decreases depending on the models, predicting a change of -4% to +14%. To simulate a change in climate more realistically, both the precipitation supplement and the fixed boundary condition were changed from the base simulation. Because the precipitation recharge was doubled for this simulation, the upward limit value was set such that the groundwater flux in the system was approximately double that of the base simulation.
While specific discharge normal to the seepage surface at the toe of the landslide may increase more than 700 percent from the base condition, these transient fluctuations most likely do not propagate any significant length into the width. Increased recharge at the irrigation wastewater ponds does not change the general groundwater flow field (Figure 4.8). In fact, specific discharge usually decreases to the seepage surface at the toe of the landslide by about one percent (Table 4-3).
A doubling of precipitation and the resulting increase in permanent height at this uplift limit cause the specific discharge at the tip of the landslide to roughly double (Table 4-3). Unlike the dramatic, albeit short-term, increases in specific discharge caused by fluctuations in river stage, this change in specific discharge represents a more permanent increase.
Discussion
SYNTHESIS
Initial Two-Sample K-S Test
Notes: The K-S test returns a test decision for the null hypothesis that the two data samples are from the same continuous distribution; the test either rejects or fails to reject the null hypothesis. The numbers and percentages of grid box-climate separation pairs where p<0.05 include those where p<0.01.
Multiple Linear Regression
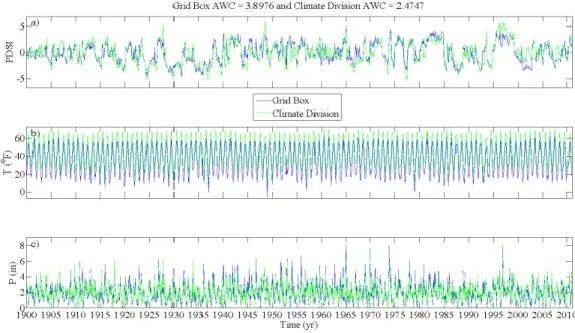
PDSI, Temperature, and Precipitation Time Series
For this pair of grid box and climate section, the mean positive and negative differences were between -1 and 1. For the grid box located at climate section Idaho 10: a) PDSI time series; b) temperature time series and c) precipitation time series. This appendix contains additional continuous wavelet transform, cross wavelet transform, and wavelet coherence diagrams for grid fields within the study area (described in sections of Chap. 2.
Additional Continuous Wavelet Transform Plots
Additional Cross Wavelet Transform Plots
Additional Wavelet Coherence Plots
FINITE ELEMENT GROUNDWATER MODEL