I would also like to thank the following people for their essential contributions to my research: Hong-Jung Chen for generating the synGAP knockout mouse;. I would also like to thank Scott Fraser and BIC for providing confocal microscopes and microscope training; Tim Masloski (Zeiss) for help with the KS 300 software;.
Historical background on dendritic spines
Further studies led to the detection of the structural element actin and the signal transduction protein calmodulin in the PSD [Blomberg et al., 1977]. Shortly thereafter, Kennedy and colleagues identified Ca 2+ /calmodulin-dependent protein kinase II (CaMKII) as a major component of the PSD [Kennedy et al., 1983].
Spine morphology
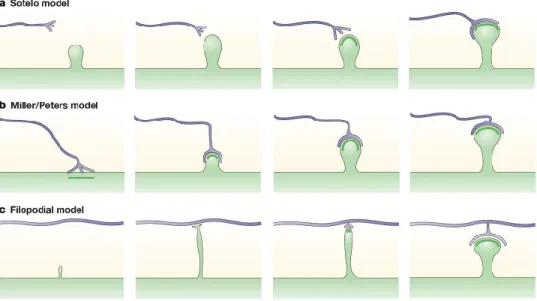
In addition, filopodia predominate early in development and are thought to be the precursors of spines [Fiala et al., 1998]. They are also generally accompanied by an active presynaptic bouton and are capable of synaptic transmission, and the strength of synaptic transmission is likely related to spine size [Bailey and Kandel, 1993, Yuste and Bonhoeffer, 2001, Harris et al., 2003].

Spine and synapse formation
Spine formation in the adult brain
Another study used electron microscopy to show that in adult rats, stimulation of a whisker increased total synaptic density in the corresponding cortical barrel [Knott et al., 2002]. A recent study described NMDAR-initiated signal transduction events that lead to the synaptic insertion of AMPARs [Zhu et al., 2002].
The actin cytoskeleton of dendritic spines
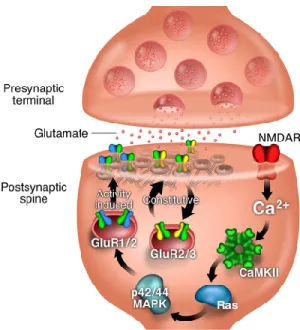
Cartoon representation of pathways thought to be involved in the regulated insertion of AMPA receptors into the synapse. This cascade leads to the rapid insertion of intracellular GluR1-containing AMPA receptors into the synapse and thus an increase in postsynaptic responsiveness.
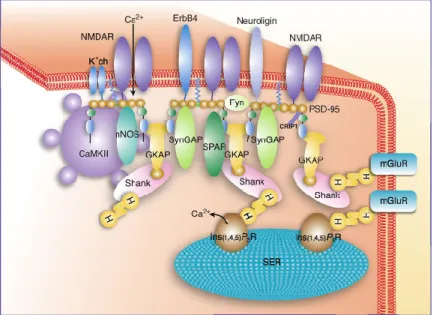
The postsynaptic density
SynGAP
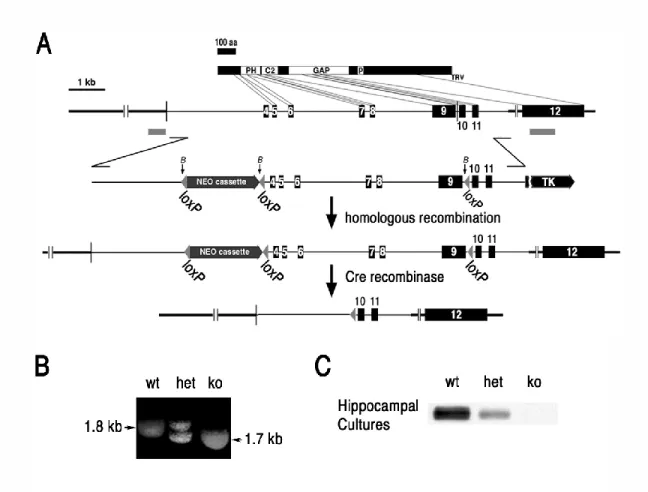
The short arm of the synGAP targeting construct was a 2.4 Kb fragment of intron 3 of synGAP genomic DNA. It was inserted at the 5' end of the Neo cassette upstream of the first loxP site in pPNTloxPv2.
Generation of mouse ES cells for injection into blastocysts
Genotyping
Primary neuronal culture
Immunocytochemistry
Immunoblotting
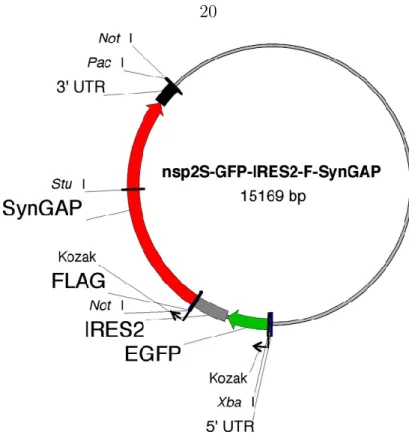
Viral constructs and infections
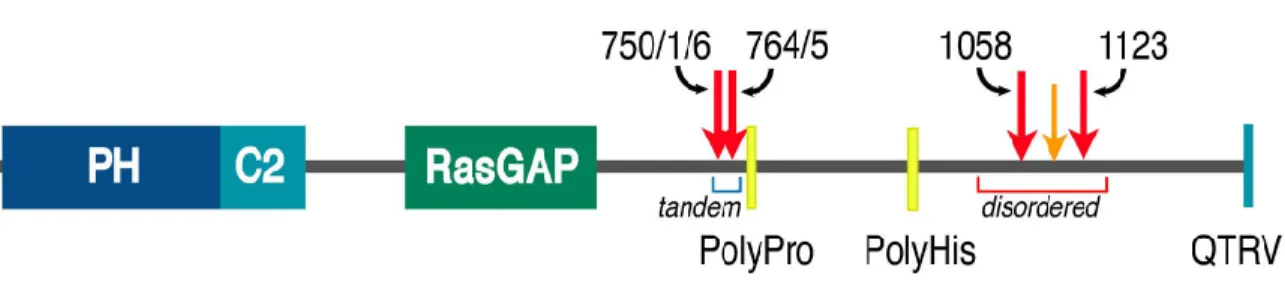
Mutations homologous to these three mutations reduce the catalytic activity of the GAP domain of p120 RasGAP severalfold [Ahmadian et al., 1997, Skinner et al., 1991]. The neurons were incubated under normal growth conditions for 16-20 h post-infection, then fixed as described above.
Light, epifluorescence and confocal microscopy
Neurons were infected by adding viruses (~0.5µl) to the culture medium at 9th or 20th DIV.
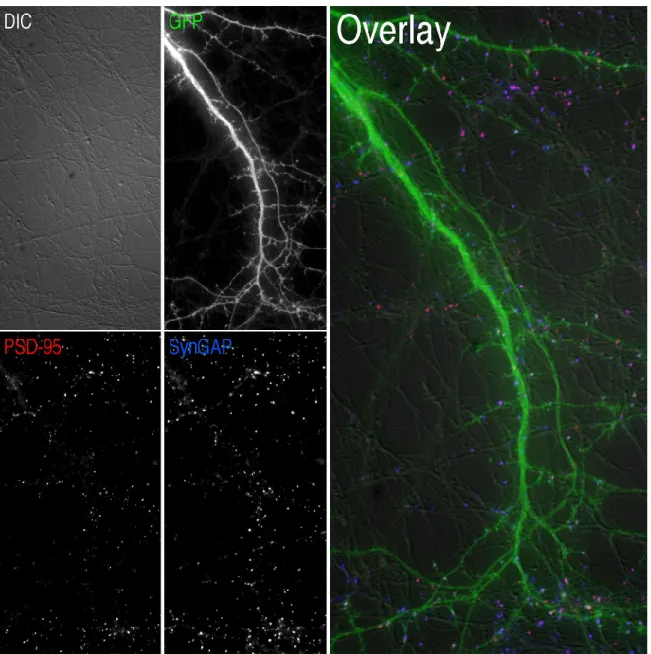
Image analysis
- Protrusion masking
- Dendrite masking
- Puncta masking
- Measurements and statistical analyses
This appears as puncta (clusters of bright pixels) whose brightness is mostly confined within the upper 95th percentile of all pixels in an image (Fig. 2.6A, B). We therefore thresholded each masked image at the brightness index of the 95th percentile of pixels using KS 300 (Fig. 2.6C). Right, Overlay of the protrusion mask (green) with the puncta masks of PSD-95 (red) and SynGAP (blue).
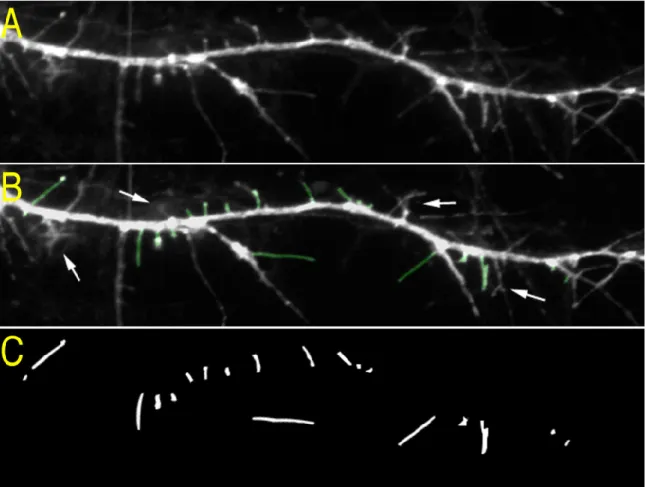
Using the KS 300, the number of puncta and protrusions per 50 µm of dendrite, as well as the area and mean pixel brightness of each punctum were obtained from the masked images (see Appendix B). To obtain the width of the protrusions, the protrusion mask was applied to each GFP image (Fig. 2.4), then the software drew a rectangle bounding the mask around each protrusion, and the length and width of each rectangle was recorded. To obtain the percentage of puncta in protrusions, or the percentage of protrusions containing a punctum (cluster), the intersection of the protrusion mask and binary images of immunostained puncta were obtained (Fig. 2.6C, right).
We measured the average brightness of syn-GAP fluorescence in the dendrite mask (total brightness/area).
Electrophysiological recordings
ES cells were transfected with a targeting construct containing three loxP sites flanking a neomycin selection cassette and genomic DNA including exons 4 to 9 of synGAP (Fig. 3.1A). After selection for homologous recombination, mutant ES cells were transfected with a vector transiently expressing Cre-recombinase (see section 2.1). Two distinct colonies of ES cells carrying the ko mutation were used to develop two independent lines of synGAP ko mice.
The genotype of individual mice is determined by a chain reaction with the polymerase of the genomic DNA (Figure 3.1b), as described in section 2.3. At postnatal day 0 (P0), homozygous ko mice are initially similar in size and weight, and a milky patch is often seen in their abdomens, suggesting that mortality was not caused by immediate malnutrition. Expression of Cre recombinase in recombinant ES cells resulted in the deletion of exons 4–9 of the synGAP (ko) gene in a subset of ES cells, two of which were used to construct synGAP ko lines.
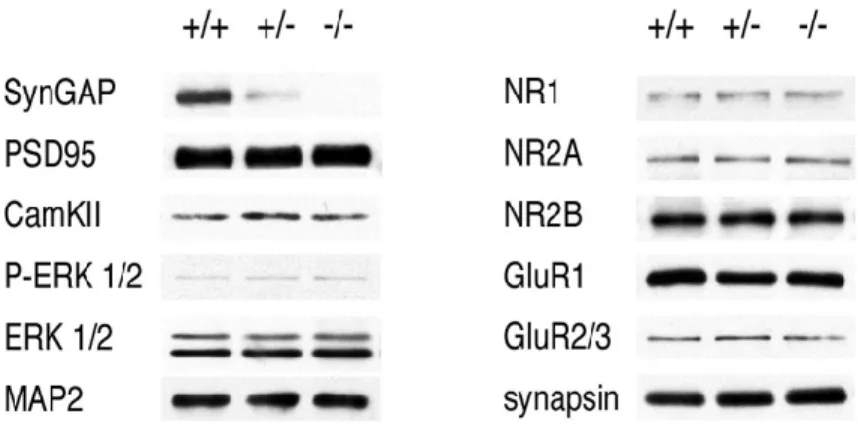
Expression of all four isoforms of synGAP protein is absent in inko neurons and reduced in inhet neurons compared to wt.
Spine morphology in neuronal cultures
Development of spines in neuronal cultures
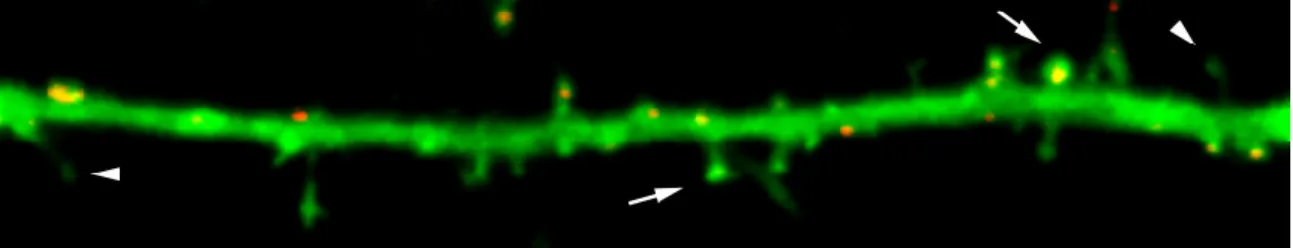
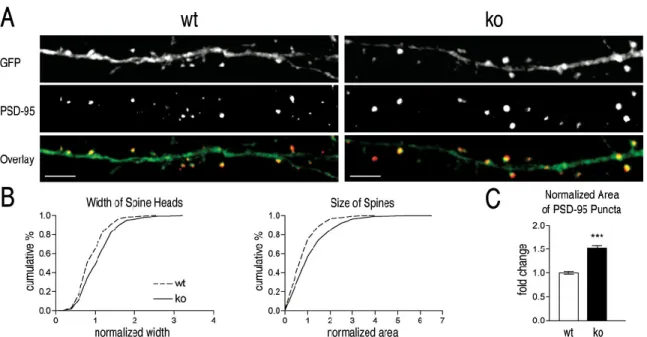
Both spine widths and areas are shifted to larger values in ko neurons compared with wt neurons. The population of protrusions on the dendrites of ofko neurons is shifted toward those with large heads that resemble mature spines, compared with the distribution of protrusions on the dendrites of wt neurons. Thinner, elongated filopodia predominate in wt neurons (see arrows). B) Quantification of the number, width and area of dendritic protrusions at 10 DIV.
Widths and areas of normalized protrusions are shown as cumulative histograms with bins of 0.2 normalized units. Both width and area are shifted to higher values in koneurons (width (mean±sem);wt vs. Note that the automated measurement of width underestimates the differences in head width between wt andko (see section 2.9.4).
Measurements were made of 653 projections on 79 dendrites from 29wt neurons and 870 projections on 87 dendrites from 27ko neurons.
Synaptic proteins
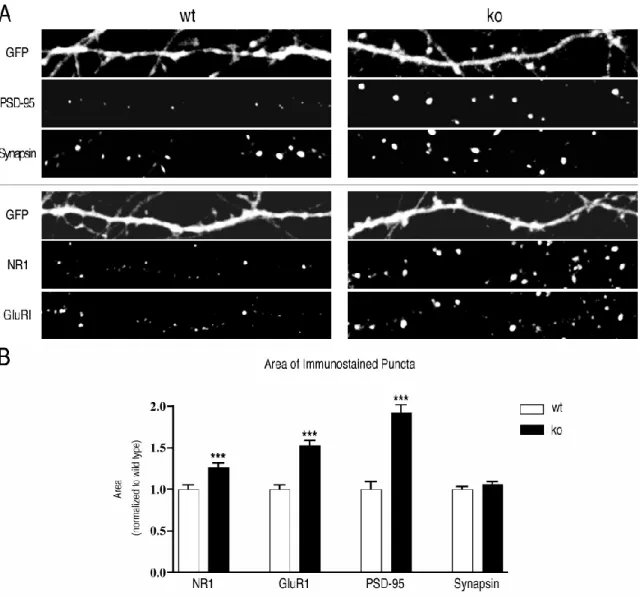
The GFP image was rendered with a dominant filter for a better view of the distribution of PSD-95 (green) and synapsin (red) in dendrites. From the data described in Fig. 3, we measured the percentage of PSD-95, NR1, and GluR1 puncta that overlap with dendritic protrusions as determined by the protrusion mask described in section 2.9.4. Representative images of dendrites stained for PSD-95 (green) and synapsin (red) are shown as in Fig.
The percentage of protrusions overlapping with a PSD-95 puncta or with both a PSD-95 puncta and a synapsin puncta was determined as described in Section 2.9.4. Measurements were made on the same set of data analyzed in Fig. C) Inconeurons, more spines contain both AMPA and NMDA-type glutamate receptors than contain NMDA-type receptors alone. Representative images of dendrites stained for NR1 (green) and GluR1 (red) are presented as in Fig.
Immunostained spots were identified as in Fig. D) The percentage of extensions containing only NMDA receptors decreased from 36.
Miniature excitatory postsynaptic currents in neuronal cultures
Reintroduction of synGAP into ko neurons
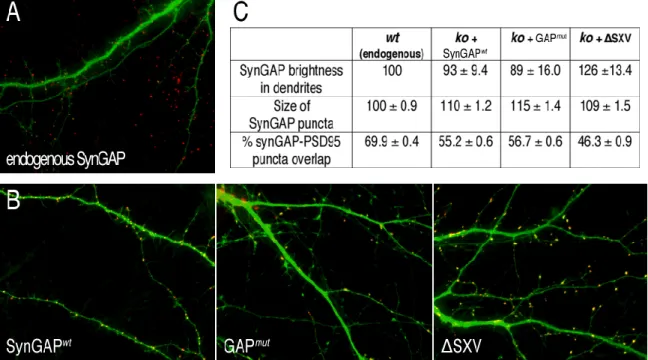
Neurons were fixed at 10 DIV and stained with anti-synGAP antibodies (red). C) Quantification of synGAP brightness in dendrites, synGAP puncta area, and percent synGAP puncta overlap with PSD-95 puncta. 10,474 synGAP puncta and 7,089 synGAP/PSD-95 overlapping puncta were measured on dendrites from 31 wt neurons, 7,980 synGAP puncta and 3,179 synGAP/PSD-95 overlapping puncta on dendrites from 32 synGAPwt-expressing conneurons. . ∆SXV. SynGAPko neurons were infected at 9 DIV with Sindbis viruses engineered to express GFP and synGAP as described in section 2.7.
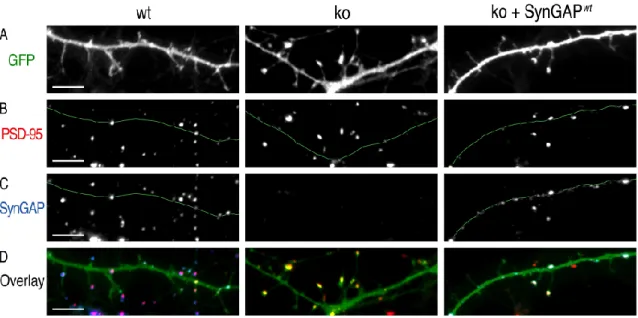
As indicated by the GFP images, the abnormal spine phenotype was rescued only in neurons where synGAPwt was expressed (B).
Rescue of the mutant phenotype by recombinant wild-type synGAP . 42
Transient expression of synGAP inkoneurons shifts the appearance of dendritic spines back to that ofwt. Interestingly, transient expression of synGAPwt did not reverse the effect of the ko mutation on the size and brightness of immunostained PSD-95 puncta (Fig. H). This result suggests that the formation of PSD-95 clusters occurred before the onset of significant synGAPwt expression on day 9.
We also found that expression of synGAPwt in ko neurons decreases the percentage of total PSD-95. The proportion of PSD-95-containing elongations shifted back to that of wt after expression of synGAPwt but not after expression of ∆SXV. In contrast, expression of GAPmut caused a slight shift of the percentage of PSD-95-containing extensions back toward wt that was not statistically significant (see G).
Finally, the brightness of PSD-95 puncta was not shifted to wt at all by expression of synGAPwt, GAPmut, or ∆SXV.
Mechanisms of spine maturation that are altered by synGAP deletion 49
However, reintroduction of the GAP domain mutant (GAPmut) had no effect on spine morphology and slightly slowed the movement of PSD-95 into spines. "?" in the backbone depicting GAPmut reintroduction shows that backbones lacking PSD-95 were relatively rare. One clue comes from the effect of the ∆SXV mutation on the movement of PSD-95 clusters in spines.
Absence of synGAP in ko neurons accelerates movement of PSD-95 into spine heads; reintroduction of synGAP or GAPmut into neurons at 9 DIV reverses this effect. In the absence of the t-T/SXV synGAP domain, we predict that more of this hypothetical protein binds to PSD-95 and its movement into spines is accelerated. On the other hand, we hypothesize that the t-T/SXV synGAP motif restricts PSD-95 recruitment to PSD and/or PSD-95 multimerization.
By Myc-tag 'pull-down' of the cell extract and subsequent FLAG-tag immunoblotting we can measure the amount of PSD-95 multimerization in the presence or absence of synGAP.

Role of the N-terminus of synGAP
Protein expression in synGAP ko neurons
Complete rescue of the co-phenotype by RasN17 may indicate that synGAP binding to PSD-95 serves to localize its GAP activity. Confirmation of the arginine-finger hypothesis for the GAP-stimulated GTP hydrolysis reaction of Ras. The postsynaptic density fraction of the rat brain contains a homologue of the Drosophila discs major tumor suppressor protein.
Structure of the SH3 guanylate kinase module from PSD-95 suggests a mechanism for regulated assembly of MAGUK scaffold proteins. Cyclin-dependent kinase 5 phosphorylates the N-terminal domain of the postsynaptic density protein PSD-95 in neurons. Regulation of the neuron-specific Ras GT-Pase activating protein, synGAP, by Ca2+/calmodulin-dependent protein kinase II.
Rapid induction of dendritic spine morphogenesis by transsynaptic activation of the ephrinB-EphB kalirin Rho-GEF receptor. Role of phosphoinositide 3-OH kinase in cell transformation and control of the actin cytoskeleton by Ras. On the other hand, synGAP expression is very low at birth and increases dramatically during the middle of the first week of development (the time when synapse formation begins) until adulthood.