THE NEWS EFFECT OF COVID-19 ON GLOBAL FINANCIAL MARKET VOLATILITY
Anasuya Haldar* and Narayan Sethi**
*Department of Humanities and Social Sciences, National Institute of Technology Rourkela, Odisha, India.
Email: [email protected]
**Department of Humanities and Social Sciences, National Institute of Technology Rourkela, Odisha, India.
Email: [email protected]
This study investigates whether the coronavirus (COVID-19) pandemic caused a contagion and negatively affected the stock market. Using data from the 10 worst-hit countries over the period from December 2019 to May 2020 and an EGARCH model, the study shows that market speculations lead to negative stock returns and higher stock market volatility. Further, estimates of both bivariate time-series regression and random-effects panel regression show significant effects of COVID-19 related media coverage on the stock market.
Article history:
Received : September 21, 2020 Revised : December 1, 2020 Accepted : December 8, 2020 Available Online : January 31, 2021 https://doi.org/10.21098/bemp.v24i0.1464
Keywords: COVID-19; Market volatility; Market uncertainty; Risk aversion; Contagion effect JEL Classifications: F40; I15; E1; E6.
ABSTRACT
I. INTRODUCTION
The COVID-19 virus that hit Wuhan in December 2019 became a pandemic and spread to different parts of the world affecting more than 1 million people and causing more than 60,000 deaths worldwide in about 100 days following its outbreak (Global Economic Prospects, 2020). On February 20, 2020, the World Health Organisation (WHO) declared COVID-19 as an emergency and afterwards a pandemic on 11th March 2020 (WHO Report, 2020). The sudden spread of the pandemic and the lack of health preparedness in most of the countries, triggered panic and fear among the people (Lyócsa and Molnár, 2020). More than 100 countries announced partial to complete lockdown by the end of March 2020 (Global Economic Prospects, 2020). With restricted mobility of people as well as goods and services within major cities and between countries, the economic situation became highly uncertain for businesses.
The media played an important role by making information available to the investors, whose actions directly affected stock returns and market volatility. In this study, we analyse the effect of media coverage of COVID-19 news on stock market return and volatility for the worst hit countries during the pandemic period. The entire period of study is divided into two phases: Phase I (December 2019 to February 2020) is when COVID-19 was limited to only China while Phase II (March 2020 to May 2020) is when it spread to Europe and the USA. We have two main objectives: first, to estimate the stock market returns and volatility for the countries most affected by the pandemic in both Phases I and II; and, second, to understand the effect of media coverage on stock market reaction.
The pandemic that comes closest in comparison to the scale and spread of COVID-19 is the 1918 Spanish flu. There are, however, major differences in the global economic backdrop of COVID-19 and the 1918 Spanish flu, which occurred almost a century ago. At that time, the world was not as globalised as it is today and people did not travel for work as much as they do now. Another important factor that makes the COVID-19 pandemic unprecedented is the media coverage of the day-to-day information related to it. Such information includes daily increase in the number of cases, the number of deaths, the number of people tested, the number of days in lockdown, and fiscal and monetary policies during the pandemic (Haroon and Rizvi, 2020a). People perceive pandemic related information differently in different countries depending on pre-existing conditions like healthcare preparedness for infectious diseases and current government policies in the face of the pandemic.
Goodell (2020) found, in a comparative study of past pandemics, that the COVID-19 pandemic’s effect on the economy is unprecedented. He also pointed out that “We should expect now that there will be a long-term impact on firm financing and firm costs of capital.” (p. 5). So, it is important to understand the implications of COVID-19 on the stock markets of the most affected countries.
Undoubtedly, media plays an important role here, because people’s perception of the current economic and health scenario as well as future expectations are shaped by the media, and has direct effect on stock market returns and volatility (Erdem, 2020; Bai et al., 2020; Ashraf, 2020; Alfaro et al., 2020; Lyócsa and Molnár, 2020).
This study brings to the forefront the effect of media coverage on stock market volatility. Increased stock volatility, in turn, increases expected risk premium and
hence affects the cost of capital of firms (Kantos, 2020). During the COVID-19 times, equity values fell for most of the stock indices, as people became risk averse and started selling their financial assets (Ashraf, 2020; Bai et al., 2020; Akhtaruzzaman et al., 2020) and, as a result, financial markets became highly unpredictable.
The degree of unpredictability varies from country to country, depending on their media coverage, healthcare preparedness for infectious diseases and their government fiscal policy (Das et al., 2020), monetary policy, pharmaceutical as well as non-pharmaceutical healthcare policies in the face of the pandemic (Global Economic Prospects, 2020). It is, therefore, important to understand how media coverage affects the stock market.
This study is novel and the first to consider the global health security index and the media coverage index as important determinants of stock market volatility. In this study, we have considered the 10 worst-hit countries as of 31st May 2020, based on their case-fatality ratios. The countries considered are Mexico, Peru, Indonesia, Brazil, the Philippines, Russia, Argentina, the US, South Africa, and India.
These countries have different pre-existing health conditions as well as different government and central bank responses to the pandemic. In all these countries, the government increased aid and implemented several policies to increase household and firm spending, while the central bank eased out financial resources. Now-a- days, the media makes such information available to the investors of all countries, which is crucial for their future expectations about the financial market.
We examine the news effect on stock markets by using a media coverage index, which we retrieved from RavenPack’s website, as a proxy for the news effect during the COVID-19 period. This is in line with previous studies that have also used media coverage as an important proxy for news effect (Rogone et al., 2020;
Haroon and Rizvi, 2020a; Subrhamanyam, 2019; Ding et al., 2019; Narayan, 2019, 2020a). We further estimate bivariate time-series regressions for each of the stock price indices using the ordinary least squares (OLS) technique. We find that media coverage of coronavirus news has an overall negative impact on the stock market.
We performed a robustness check by estimating a random-effects regression model with stock market return and volatility as the dependent variables, and coronavirus media coverage index (MCI), coronavirus panic index (CPI), coronavirus sentiment index (CSI), and global health security index (GHS) as independent variables. While MCI, CPI, and CSI are media related parameters, GHS represents the pre-existing health conditions of a country and is time- invariant. Also, by incorporating the interaction term MCI×GHS, we find that prior health preparedness moderates the negative effect of media coverage on the stock market. This finding is a useful contribution towards policymaking for countries that are worst hit by the pandemic. This suggests that during uncertain times like the pandemic, the level of health preparedness, proxied here by GHS helps in moderating the negative news related to the pandemic and this, in turn, reduces stock market volatility.
The remainder of the paper is divided into five sections including the present one. A review of literature on COVID-19 and market volatility is presented in Section II; data and methodology used in the study are discussed in Section III; Section IV presents the main findings and, finally, Section V presents the conclusion.
II. REVIEW OF LITERATURE
Stock markets are the most uncertain of all financial markets and are difficult to predict, even more so in times of crises (Wagner et al., 2020). Any form of crisis increases uncertainty in all markets and people react by reducing investment in risky assets further making the markets more bearish. This has been documented in many recent studies, which found that the COVID-19 pandemic has increased financial market volatility and reduced investment (Lyócsa and Molnár, 2020;
Narayan, Gong and Ahmed, 2020; Narayan, Devpura and Wang, 2020; Erdem, 2020; Bai et al., 2020, Ali et al., 2020; Ashraf, 2020; Goodell, 2020; Zaremba et al., 2020; Sansa, 2020; Dai et al., 2020; Sha and Sharma, 2020).
Apart from these studies, other recent studies on COVID-19 show that volatility has increased across all markets and economies during the pandemic. Salisu and Adediran (2020) found that the Equity Market Volatility-Infectious Diseases (EMV-ID) index is a good predictor of volatility in the energy market during the COVID-19 times. Sharma (2020) showed that the COVID-19 pandemic changed the commonality in volatility within the Asian region and that the commonality in volatility during the pandemic is more prominent in Singapore relative to other Asian economies. Fu and Shen (2020) found evidence that COVID-19 had a major negative impact on the performance of energy companies. Devpura and Narayan (2020) studied the changes in the oil price volatility over the pandemic period by using different measures of oil price volatility and concluded that volatility increased during the beginning of COVID-19 and that COVID-19 cases and deaths increased daily oil price volatility by 8% to 22%. Liu et al. (2020) found, by exploring the interaction of COVID-19, crude oil market, and stock market in the US using a time-varying parameter vector autoregression (TVP-VAR) model, that there is a negative link between crude oil returns and stock returns.
Huang and Zheng (2020) found that there has been a structural change in the relationship between crude oil futures price and investor sentiment from December 31, 2019 to February 25, 2020. Iyke (2020a) also examined the impact of the COVID-19 pandemic on US oil and gas producers and found that firms react to COVID-19 heterogeneously, and concluded that COVID-19 explains 28% of returns and 27% of return volatility. Narayan (2020a) showed that there is a threshold number of new COVID-19 infections beyond which COVID-19 puts greater pressure on oil prices. He demonstrated that, under higher oil price volatility, both COVID-19 cases and negative news on oil prices influence the prices. Ertuğrul et al. (2020) analysed the effect of the COVID-19 on the volatility of the diesel market in Turkey and found a positive association.
Apergis and Apergis (2020) used daily data on world COVID-19 cases and oil prices, to show that both helped to mitigate US political polarization. Narayan (2020b) suggested that COVID-19 has changed the resistance of the Yen/dollar exchange rate to external shocks. Narayan (2020c) showed, by using hourly exchange rate data for the currencies of Japan, Canada, Europe and the Britain, that exchange rates experienced intense bubble in the COVID-19 period, implying that markets became relatively more inefficient during this period. Iyke (2020b) showed that the information related to COVID-19 outbreak in the 25 most affected countries, can affect the forecasts of both the exchange rate return and volatility within a short period.
Mishra et al. (2020) investigated the impact of COVID-19 on the Indian financial market and found a negative stock returns for all the stock market indices during the COVID- 19 outbreak. Haroon and Rizvi (2020b) found, by using a sample of 23 emerging markets, that decreasing (increasing) number of confirmed coronavirus cases was associated with increasing (deteriorating) liquidity in the financial markets. They showed that flattening the curve of confirmed cases helps in improving investor confidence. They observed high volatility during government curfew periods.
Haldar and Sethi (2020) found that demographic factors and government policies are more important in determining the incidence of COVID-19 than socio- economic factors like GDP per capita and the human development index. Iyke (2020c) examined the impact of the pandemic on economic policy uncertainty (EPU) in China, India, Japan, Korea, and Singapore, which are five leading economies in Asia. He found that the pandemic has a positive and statistically significant impact on EPU in China and Korea. Phan and Narayan (2020) argued that, stock markets over-react when there is uncertainty like during the pandemic, but as more information becomes available, the market corrects itself.
Lyócsa and Molnár (2020) found a negative relationship between google searches and realised stock volatility of the S&P 500 index for the period from November 2019 to May 2020, by estimating a non-linear autoregressive model, where the market uncertainty was also found to increase with increase in coronavirus related search words. What makes COVID-19 different from previous pandemics, like the 1918 Spanish Flu, is its greater internet and media coverage.
While this is good for health awareness and general precaution, it is also true that it leads to more volatility in the stock market (Baker et al., 2020). Alfaro et al. (2020) concluded that the value of the US equity market declined in response to both the COVID-19 and SARS pandemic. The early outbreak of the coronavirus initially led to an increase in financial market risk in China (Al-Awadhi et al., 2020), which soon spread to Europe and US through financial contagion effect (Akhtaruzzaman et al. 2020).
Comparing the financial contagion effect of COVID-19 to past events, one parallel that can be drawn in recent times, is the analysis of the impact of terrorist events on the financial markets by Karolyi (2006). Although this is an entirely different cause, it is comparable to the COVID-19 crisis in terms of its impact on the local markets and changing public sentiments across the globe. Among all the infectious diseases and pandemics, the COVID-19 pandemic is found to have the highest stock market volatility (Baker et al., 2020). There have been past studies on the effects on share price and stock market volatility of the Hurricane Katrina of 2005 by Gangopadhyay et al. (2005), of the global financial crisis of 2007–2009 by Becchetti and Ciciretti (2011), and of the mine disasters by Kowalewski and Śpiewanowski (2020).
The need for economic risk management in the view of future pandemic has been also highlighted in many recent studies. There have been many instances in the past when disease outbreaks have been contained at the nascent stage. For example, the Nipah virus in Kerala, India was averted by the quick response from public health workers (Thomas et al., 2018). The Global Preparedness Monitoring Board (2019) forecasted in its September 2019 report that the world has little or
no preparation for an imminent danger of a pandemic. According to that report, the world has witnessed 1,483 epidemic events, which have been tracked in 172 countries during 2011-2018. Despite this fact, there are limited studies highlighting the role of pandemic preparedness in economic resilience to pandemics.
Because different countries have different health preparedness (Fan et al., 2018), government stringency policies, and societal factors like awareness and precautions to the pandemic, the effect of COVID-19 on financial market volatility is likely to be different for different countries. Zaremba et al. (2020) found that government non-pharmaceutical policy responses, like stringency of government policies, significantly increase equity market volatility. In a study by Dai et al.
(2020), a global EPU index was constructed for twenty major economies across the world by using the principal component analysis. This index was found to be positively correlated to the global financial market, indicating that stocks tend to be more volatile when the uncertainty in economic policy increases.
In recent studies, it was found by examining the firm-level data from China for March 2020, that the early outbreak of COVID-19 had an impact on global share prices and led to an increase in the global financial market risk (Al-Awadhi et al., 2020; Zhang et al., 2020). Erdem (2020) found, by using a fixed-effects regression of 75 countries from January to April 2020, that the pandemic has a significant negative effect on the stock market but this effect is weaker in more democratic nations. Bai et al. (2020) found the presence of long-term effects of infectious disease pandemics on the volatility of the US, Chinese, UK, and Japanese stock markets from January 2005 to April 2020, by using an extended form of the GARCH and GARCH-MIDAS models and an Infectious Disease Equity Market Volatility Tracker (EMV-ID).
Ali et al. (2020) investigated the reaction of financial markets globally as the epicentre of coronavirus moved from China to Europe and then to USA. They found that, while the epicentre of the pandemic, China, stabilized, the rest of the world experienced a downfall, especially in the later phase of the pandemic; even the relatively safer assets suffered as the pandemic moved into the United States.
Conlon and McGee (2020) also found that safe havens like Bitcoin do not have the ability to shield investors from the turbulence induced by the pandemic in traditional markets. In a study by Ashraf (2020) for 64 countries from January 22, 2020 to April 17, 2020, it was found that the number of confirmed COVID-19 cases has a greater negative effect on stock market returns than the number of COVID-19 deaths.
Sansa (2020) investigated the impact of COVID-19 on financial markets in China and the US from 1st March 2020 to 25th March 2020 and found a significant positive relationship between confirmed COVID-19 cases and both markets.
Akhtaruzzaman et al. (2020) showed empirically that for both China and the G7 countries, the conditional correlation coefficient between the stock returns of the financial firms have increased significantly during the COVID-19 period. This indicates the presence of a financial contagion effect due to COVID-19. Another firm level analysis by Mazur et al. (2020) showed that some sectors like natural gas, food, healthcare, and software recorded positive returns, whereas petroleum, real estate, entertainment, and hospitality sectors recorded negative returns during the pandemic.
None of the previous studies, however, considered the effect of prior health care preparedness of countries, while estimating the impact of media coverage on stock market returns and volatility. Our study aims to fill this gap in the literature by using the global health security index (GHS) as a proxy for health-preparedness in these countries. A summary of the literature is presented in Table 1.
Table 1.
Summary of the Recent Literature on COVID-19 and Financial Volatility
This table presents a summary of the recent literature on COVID-19 and financial volatility. GARCH denotes generalized autoregressive conditional heteroscedasticity; EGARCH denotes exponential GARCH and GARCH MIDAS denotes GARCH-mixed data sampling.
Authors Period and
Study Area Model Findings
Akhtaruzzaman
et al. (2020) 2020, Global Dynamic conditional Correlation
Dynamic conditional correlations (DCCs) between Chinese and G7 stock returns, financial and nonfinancial alike, increased significantly during the COVID–19 period.
Erdem (2020) 2020, 75
countries Panel fixed effects Significant negative effect of the pandemic on the stock market
Ali et al. (2020) 2020, Global GARCH Reaction in the stock market as the epicentre of pandemic moved from China to USA Bai et al. (2020)
January 2005 to April 2020; US, China, UK and
Japan
GARCH MIDAS
model Permanent effects on stock market volatility up to 24 months.
Ashraf (2020) Jan 22 to April 17, 2020; 64
countries Bivariate regression
Stock markets reacted more significantly to the number of cases as compared to the
number of deaths Mazur et al.
(2020) March 2020;
USA EGARCH Some sectors showed positive returns while others like real estate, entertainment and
hospitality showed negative returns Lycosa and
Molnar (2020) March 2020;
USA
Non-linear Autoregressive
model
Abnormal google searches lead to financial market volatility
Sansa (2020) 1st March to 25th March 2020;
China and USA Bivariate regression Significant positive relationship between COVID 19 case and stock markets Zaremba et al.
(2020) 2020; global Panel regression Non-pharmaceutical government policies significantly increase equity market
volatility.
III. DATA AND METHODOLOGY A. Data
In this study, we compile a panel dataset for the 10 worst hit countries by COVID-19 during December 2019 to May 2020. We construct the dataset on stock market indices (INDEX), GHS, MCI, CPI, and CSI. We use daily data for all these variables for the analysis. We use the case-fatality ratio (CFR) to select the worst hit countries. The rationale behind this is that CFR captures the failure of health
facilities, which in turn results in higher mortality for a given number of confirmed cases. In this analysis, the ‘worst-hit’ countries are the ones with the highest CFR during the study period. Specifically, these countries are Mexico, Peru, Indonesia, Brazil, the Philippines, Russia, Argentina, the US, South Africa, and India.
The daily data on the major stock market indices (INDEX) in these countries, were taken from the website of yahoo finance. The daily data on MCI, CPI, and CSI were obtained from RavenPack’s website (https://coronavirus.ravenpack.
com). We use MCI as a proxy for the news effect of COVID-19. This index is the percentage of all news sources that cover coronavirus related information. Recent studies (Rogone et al., 2020; Haroon and Rizvi, 2020a; Subrhamanyam, 2019;
Ding et al. 2019) used MCI to proxy for coronavirus news effect as well. The CPI index measures the percentage of news chatter that refers to panic or hysteria related to the virus. The CSI measures the level of sentiment associated with all other information mentioned in the news alongside the coronavirus. The index ranges from -100 (most negative sentiment) to 100 (most positive sentiment). The coronavirus panic index and sentiment index are taken as the other independent variables because sentiment or panic are important variables to explain stock market volatility (Iyke and Ho, 2021; Smales, 2017; Smales, 2014; Zhang et al., 2011; Huerta et al., 2011; Whaley, 2000). Hence, both CPI and CSI have been included in our regressions to avoid omitted variable bias.
To account for pre-existing health-preparedness of the studied countries, we compiled 2019 Global Health Security (GHS) Index, which is the most recent data available for all countries on the John Hopkins University’s website. The GHS index was developed by the Economic Intelligence Unit (EIU) in 2005 and is published annually since then by the Nuclear Threat Initiative (NTI) and the John Hopkins University (JHU). However, the GHS index remains time-invariant for the studied period and varies only across countries. The GHS index is based on 140 questions asked based on prevention, detection, and response related to pathogen related diseases, on the one hand, and the health system compliance with international norms and risk environment, on the other hand. In this study, the GHS index is used to proxy for health preparedness and capacity gaps of the countries, whose stock market volatility is investigated. The GHS index is used in the robustness analysis as one of the independent variables.
B. Methodology
B1. Estimating Stock Returns and Volatility
We calculate the stock returns from the data on stock price indices using Equation (1),
where, Pt and Pt-1 are the current and the previous day’s stock prices, respectively, and Rt is the current stock returns.
We estimate stock market volatility using exponential generalized autoregressive conditional heteroskedastic (EGARCH) model. However, before (1)
applying the EGARCH model, we check whether the stock indices satisfy at least one of the following preconditions for using GARCH models. First, there must be evidence of volatility clustering; that is, large changes are followed by large changes and small changes are followed by small changes. Second, there must be evidence of autoregressive conditional heteroscedasticity (ARCH) effects; that is, the variance of the error terms of the series is not only heteroscedastic, but is also affected by variances preceding it. And third, there must be evidence of leverage effect; that is, there is negative correlation between past returns and the volatility of future returns. This generally appears when there is some ‘bad’ news.
The EGARCH model is suitable for this kind of analysis where the effect of bad news causes more negative returns to stock markets than positive returns.1 This was given by Nelson (1991) and is another form of the GARCH model. The EGARCH model is given by Equation (2).
where denotes the conditional variance estimated based on any past relevant information; ωt denotes the conditional density function; α represents the GARCH effect; and β measures the perseverance in conditional volatility irrespective of market movements. The parameter γ measures the leverage effect.
Having calculated the daily stock returns and volatility, we compute the descriptive statistics, namely mean, standard deviation, minimum and maximum values, to account for the nature of fluctuations in stock returns and volatility.
B2. Estimating the Effect of Media Coverage on Stock Returns and Volatility
We estimate a bivariate static time-series regression model for each of the 10 countries, with stock returns and volatility as the dependent variables, and media coverage index as the independent variable. Further, we estimate this regression model for two different time phases, Phase I, which represents when the epidemic was limited to China (i.e., from December 2019 to February 2020), and Phase II, which represents when the epidemic turned into a pandemic and spread to Europe and the USA (i.e., from March 2020 to May 2020). The regressions are given by Equations (3) and (4). Dividing the study period is important in order to account for the financial contagion effect of COVID-19 in these two phases (see Akhtaruzzaman et al., 2020). Since China and the US are the major players in the global market, any shock to their financial markets will likely have repercussions for stock markets around the world. Therefore, it is important to divide the COVID-19 period into the epidemic (i.e., from December 2019 to February 2020) and the pandemic periods (i.e., from March 2020 to May 2020), in order to understand the effect on stock markets of COVID-19 in the economies studied.
1 The EGARCH model is suitable for estimating volatility in financial markets because it allows bad and good news to have asymmetric impacts on financial markets.
(2)
where, Rti and Vti represent, respectively, stock returns and volatility at time t for country i; MCIti is the media coverage index at time t for country i; and μti represents the time-specific error-term for country i. Since we have 10 countries, we run 10 sets of bivariate time-series regressions to estimate stock returns and volatility for each of these indices.
For robustness check, we estimate the multivariate panel regressions in (6) and (7) for the entire period of study, using the random-effects estimator, with returns and volatility as the dependent variables and MCI, CPI, CSI, and GHS as the independent variables. Since GHS is a time-invariant independent variable, we assume that our true model is a random-effects model. We assume that in our model, the country-specific effects, ∝i, are uncorrelated with the explanatory variables.
(3) (4)
where X is the vector of all explanatory variables.
This is further tested by using both the Hansen specification test and the Breusch–Pagan Lagrange Multiplier (LM) test. In our multivariate model, we also consider an additional interaction term, given by MCIit × GHSit, to account for the joint effect of media coverage and health preparedness on the stock market. The multivariate random-effects model is given by Equations (6) and (7).
(5)
where Rit and Vit are, respectively, stock returns and volatility for country i at time t. The explanatory variables are MCIit, CPIit, CSIit, and GHSit. The coefficient of the interaction term, MCIit × GHSit, shows the joint effect of media coverage and pre-existing healthcare preparedness of the countries on stock market returns and volatility.
IV. MAIN FINDINGS
In this section, we first present the results of volatility clustering, ARCH and leverage effects, and persistency of volatility shocks. These tests help understand the nature of volatility of the stock indices. Also, they serve as pre-conditions for applying GARCH models.
(6) (7)
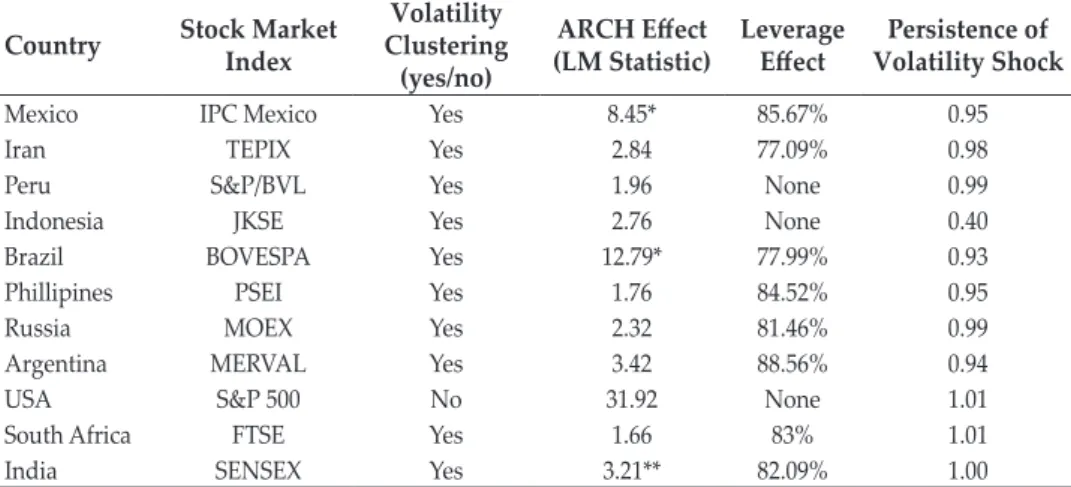
Table 2 shows a significant ARCH effect for the stock indices of Mexico, Brazil, and India, which indicates the presence of conditional volatility in the stock returns. This means that today’s shocks remain in the volatility of future shocks.
The leverage effect, indicating the percentage of effect of bad news on volatility, is high for the stock indices of all countries, except for the US, Peru, and Indonesia.
This means that all the other markets have high volatility in their stock indices in response to bad news or COVID-19 related information, in this case. Persistence of volatility shocks, which means the proportion of today’s shocks that remain in the volatility of future shocks, is high for all the countries. However, for the US, India, and South Africa, the persistence parameter is less than one, meaning the persistence of volatility stocks is unstable. The fluctuations in the stock indices and evidence of volatility clustering are also evident from Figure 1.
Table 2.
Description of the Stock Indices
This table reports test results of volatility clustering, ARCH and leverage effects, and persistency of volatility shocks for the stock indices of the studied countries. The heteroskedasticity test is performed based on the Lagrange multiplier (LM) test, which examines the null hypothesis of “no ARCH” effect. * and ** denote statistical significance at the 1% and 5% levels, respectively.
Country Stock Market Index
Volatility Clustering
(yes/no)
ARCH Effect
(LM Statistic) Leverage
Effect Persistence of Volatility Shock
Mexico IPC Mexico Yes 8.45* 85.67% 0.95
Iran TEPIX Yes 2.84 77.09% 0.98
Peru S&P/BVL Yes 1.96 None 0.99
Indonesia JKSE Yes 2.76 None 0.40
Brazil BOVESPA Yes 12.79* 77.99% 0.93
Phillipines PSEI Yes 1.76 84.52% 0.95
Russia MOEX Yes 2.32 81.46% 0.99
Argentina MERVAL Yes 3.42 88.56% 0.94
USA S&P 500 No 31.92 None 1.01
South Africa FTSE Yes 1.66 83% 1.01
India SENSEX Yes 3.21** 82.09% 1.00
Figure 1.
Stock Market Returns for Selected Indices
Figure 1 shows the stock returns of the selected indices over the pandemic period Mexico IPC
-0.1 -0.05 0 0.05
1/2/2020 1/23/2020 2/13/2020 3/5/2020 3/26/2020 4/16/2020 5/7/2020 5/28/2020 6/18/2020 7/9/2020 7/30/2020
Source: Yahoo finance
Source: Yahoo finance
Brazil BOVESPA
-0.2 -0.1 0 0.1 0.2
2/3/2020 2/17/2020 3/2/2020 3/16/2020 3/30/2020 4/13/2020 4/27/2020 5/11/2020 5/25/2020 6/8/2020 6/22/2020 7/6/2020 7/20/2020 8/3/2020
Figure 1.
Stock Market Returns for Selected Indices (Continued)
Source: Yahoo finance
Peru S&P/BVL
-0.15 -0.1 -0.05 0 0.05
1/3/2020 1/24/2020 2/14/2020 3/6/2020 3/27/2020 4/17/2020 5/8/2020 5/29/2020 6/19/2020 7/10/2020 7/31/2020
Source: Yahoo finance
Indonesia JKSE
-0.1 -0.05 0 0.05 0.1 0.15
1/3/2020 1/24/2020 2/14/2020 3/6/2020 3/27/2020 4/17/2020 5/8/2020 5/29/2020 6/19/2020 7/10/2020 7/31/2020
Figure 1.
Stock Market Returns for Selected Indices (Continued)
Source: Yahoo finance
Peru S&P/BVL
-0.15 -0.1 -0.05 0 0.05
1/3/2020 1/24/2020 2/14/2020 3/6/2020 3/27/2020 4/17/2020 5/8/2020 5/29/2020 6/19/2020 7/10/2020 7/31/2020
Source: Yahoo finance
Russia MOEX
-0.1 -0.05 0 0.05 0.1
1/3/2020 1/24/2020 2/14/2020 3/6/2020 3/27/2020 4/17/2020 5/8/2020 5/29/2020 6/19/2020 7/10/2020 7/31/2020
Figure 1.
Stock Market Returns for Selected Indices (Continued)
Source: Yahoo finance
Argentina MERVAL
-0.2 -0.1 0 0.1 0.2
1/2/2020 1/23/2020 2/13/2020 3/5/2020 3/26/2020 4/16/2020 5/7/2020 5/28/2020 6/18/2020 7/9/2020 7/30/2020
Source: Yahoo finance
S.Africa FTSE
-0.15 -0.1 -0.05 0 0.05 0.1 0.15
1/2/2020 1/23/2020 2/13/2020 3/5/2020 3/26/2020 4/16/2020 5/7/2020 5/28/2020 6/18/2020 7/9/2020 7/30/2020
Figure 1.
Stock Market Returns for Selected Indices (Continued)
Source: Yahoo finance
India BSE-SENSEX
-0.15 -0.1 -0.05 0 0.05 0.1 0.15
1/3/2020 1/24/2020 2/14/2020 3/6/2020 3/27/2020 4/17/2020 5/8/2020 5/29/2020 6/19/2020 7/10/2020 7/31/2020
Source: Yahoo finance
USA S&P 500
-1 -0.5 0 0.5
12/31/2019 1/21/2020 2/11/2020 3/3/2020 3/24/2020 4/14/2020 5/5/2020 5/26/2020 6/16/2020 7/7/2020 7/28/2020
In Table 3, we report the stock returns and EGARCH volatility estimates for the entire period of the study.
Table 3.
Returns and Volatility of Stock Indices
This table shows the daily returns and volatility of the stock indices for the overall period (i.e. from December 2019 to May 2020). The overall structure of returns and volatility for each of the indices is represented by the mean and standard deviation of returns and volatility. All measures are given in percentage form.
Daily Returns (%) Index Volatility (%)
Country Stock Market
Index Mean Std. dev. Mean Std. dev.
Mexico IPC Mexico -0.09 1.78 0.10 1.79
Iran TEPIX 0.26 4.02 0.27 4.03
Peru S&P/BVL -0.12 1.79 0.03 0.10
Indonesia JKSE -0.13 19.09 -0.14 19.15
Brazil BOVESPA 0.06 3.66 0.10 1.64
Phillipines PSEI 0.01 1.97 0.03 0.11
Russia MOEX 0.00 1.97 0.04 0.11
Argentina MERVAL 0.23 3.88 0.15 0.31
USA S&P 500 -0.58 8.14 0.04 26.88
South Africa FTSE -0.12 2.19 -0.13 2.20
India SENSEX -0.05 2.51 -0.04 2.52
Table 3 shows the returns and volatility for the full sample period. Low to negative average returns and higher volatility are observed for most of the indices, suggesting unfavourable investor sentiments and perceived uncertainty created by the COVID-19 outbreak in these countries. Negative average stock returns are observed in India, South Africa, the US, Indonesia, Peru, and Mexico, indicated by low standard deviation of stock returns, which further indicates that more values are close to the mean. The US also recorded negative mean returns on S&P 500, but high standard deviation of returns. Next, in Tables 4 and 5, we estimate the stock market returns and volatility for the two phases, i.e., Phase I and Phase II, representing two different time-periods of the spread of COVID-19.
Table 4.
Stock Market Returns and Volatility During Phase I (December 2019 – February 2020)
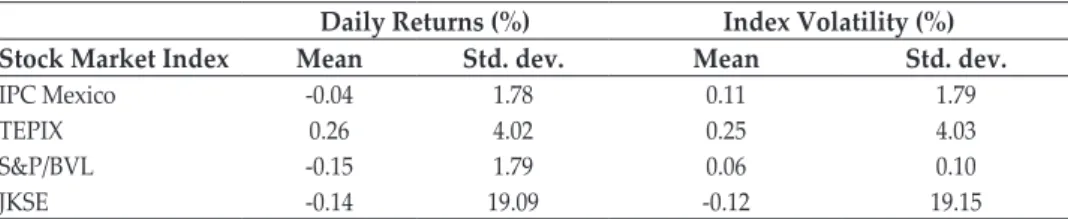
This table highlights the stock market returns and volatility during Phase I, when COVID-19 was an epidemic and limited to only China. The methodology used is EGARCH. All values are in percentages.
Daily Returns (%) Index Volatility (%)
Stock Market Index Mean Std. dev. Mean Std. dev.
IPC Mexico -0.04 1.78 0.11 1.79
TEPIX 0.26 4.02 0.25 4.03
S&P/BVL -0.15 1.79 0.06 0.10
JKSE -0.14 19.09 -0.12 19.15
Daily Returns (%) Index Volatility (%)
Stock Market Index Mean Std. dev. Mean Std. dev.
BOVESPA -0.06 3.66 0.10 1.64
PSEI -0.03 1.97 0.03 0.11
MOEX -0.02 1.97 0.04 0.11
MERVAL -0.23 3.88 0.15 0.31
S&P 500 -0.58 8.14 8.04 26.88
FTSE -0.10 2.19 -0.18 2.20
SENSEX -0.05 2.51 -0.02 2.52
Table 4.
Stock Market Returns and Volatility During Phase I (December 2019 – February 2020) (Continued)
Table 4 shows that all the indices experienced negative returns and high volatility during this period. The S&P 500 index experienced the highest average volatility during this phase. This may be attributed to higher media coverage and panic during the beginning of the epidemic, owing to rising uncertainty in other parts of the world, while COVID-19 was still limited to China (Aslam et al., 2020;
Depoux et al., 2020). Another possible reason for this negative return could be that most of these countries announced lockdown around the start of the pandemic phase, resulting in a shutdown of almost all the economic activities which in turn affected their markets.
Table 5.
Stock Market Returns and Volatility During Phase-II (March 2020 – May 2020)
This table highlights the stock market returns and volatility during phase II, when the COVID-19 became pandemic and spread to USA and Europe. The methodology used is EGARCH.
Daily Returns (%) Index Volatility (%)
Stock Market Index Mean Std. dev. Mean Std. dev.
IPC Mexico 0.12 19.15 1.11 1.79
TEPIX 0.10 1.63 1.25 4.03
S&P/BVL 0.03 0.11 2.06 0.10
JKSE 0.04 0.12 -3.12 19.15
BOVESPA 0.15 0.31 1.10 1.64
PSEI 0.11 1.79 2.11 1.79
MOEX 0.25 4.03 1.25 4.03
MERVAL 0.06 0.10 3.06 0.10
S&P 500 0.12 19.17 -1.12 19.15
FTSE 0.10 1.65 1.10 1.64
SENSEX 0.03 0.13 1.03 0.11
In Table 5, we present the mean daily returns and volatility for Phase II, which is the later part of the study period. During this period, the mean returns are low but not negative for all the indices, but volatility of asset returns remains high for all these indices. As discussed earlier, this may be attributed to the adjustment
in expectations related to the uncertainty induced by COVID-19. As time passed, investors received more positive information like news on COVID-19 vaccine tests, favourable recovery rates, etc., from various media sources (Sohrabi et al., 2020), which reduced the uncertainty related to COVID-19, and in turn boosted stock returns. However, the stock market still remains highly volatile for many of the indices, due to travel and lockdown restrictions in most countries. In the next step, we estimate the bivariate time-series regressions to evaluate the effect of media coverage on stock returns and stock volatility. These results are given in Table 6.
Table 6.
Bivariate Regression Results
This table shows the bivariate time series regression estimates obtained using OLS for each of the stock price indices, with stock returns and stock volatility as the dependant variables and media coverage index as the independent variable. * indicates significance at 1% level.
Stock Returns Stock Volatility
Stock Market Index Coeff. t-statistic Coeff. t-statistic
IPC Mexico -0.0017* -1.85 0.0010* -1.79
TEPIX -0.0016* -1.93 0.0011* -4.03
S&P/BVL -0.0012* -2.59 0.0030 -0.10
JKSE -0.0018* -1.54 0.0001* -9.15
BOVESPA -0.0017* -1.59 0.0002* -1.64
PSEI -0.0001* -1.45 0.0004 -0.11
MOEX -0.001* -2.05 0.0005 -0.10
MERVAL -0.001* -1.74 0.0007 -0.31
S&P 500 -0.001* -1.83 0.0014* -6.88
FTSE -0.003* -1.61 0.0012* -2.20
SENSEX -0.0005* -2.17 0.0021* -2.52
Table 6 shows that the returns to most of the stock market indices are negatively and significantly related to the COVID-19 information. In contrast, volatility for most of these securities is found to be positively related to COVID-19 information, implying that securities become more volatile with increasing media coverage of COVID-19 information.
A. Robustness Check
The robustness of our bivariate estimates can be established by extending the bivariate regression model to a multivariate random-effects panel regression setting. To do this, we regress returns and volatility on media coverage and other explanatory variables, viz. the panic, sentiment, and global health security indices, by pooling countries together over the sample period.
Table 7.
Random-effects Regression Results
This table shows the random-effects regression estimates obtained by pooling countries together over the sample period. The dependent variables are stock returns R and stock volatility V. The independent variables are MC, CPI, CSI and GHS. Models (1) and (3) do not have any interaction term, but Models (2) and (4) do. An interaction term, MC×GHS, is introduced in Models (2) and (4). The ‘rho’ estimate shows the proportion of variation explained by the country-specific fixed effect ui. The Hausman specification and the Breusch–Pagan LM test results show the appropriateness of the random-effects model. Finally, * indicates significance at 1% level.
Dependent Variable: Stock Returns (R)
Dependent Variable: Stock Volatility
(V)
(1) (2) (3) (4)
Intercept 0.07* -0.003* 0.005* 0.006*
(0.05) (-0.068) (2.946) (3.354)
MC -1.86* -2.600* 2.53* 5.47*
(0.76) (2.55) (2.76) (5.47)
CPI -1.57* -0.502 0.197 0.359
(3.23) (.864) (0.493) (0.670)
CSI -2.04* -0.097 0.890* 0.611*
(4.56) (1.133) (0.382) (0.857)
GHS 1.16 1.18* -2.33* -7.05*
(2.56) (2.36) (0.51) (0.63)
MC×GHS 0.12* 0.11*
(0.02) (0.01)
Sigma-u 0.3195 0.1522 1.036 0.152
Sigma-e 0.1463 0.1150 1.027 0.172
rho 0.9788 0.8150 0.9435 0.8246
Hansen test (Chi-square) 6191.43 6092.56
Breusch–Pagan LM test
(Chi-square) 5192.01* 5246.23*
In Table 7, we present the results of the random-effects regression model. The results suggest that countries with greater media coverage experience significant decline in returns, and significant increase in volatility in response to an increase in the growth of COVID-19 cases. Investors trading with countries having higher coronavirus related media coverage may be apprehensive of market reactions, and this may cause a decline in stock returns for these countries. Because of uncertainty, investors may overreact to the pandemic in countries with higher media coverage, and this has a negative effect on stock markets (returns fall, while volatility rises).
However, the interaction between MCI and GHS is found to positively affect stock returns, and this may be attributed to the more positive news related to health-preparedness along with other COVID-19 related news. The joint effect is found to moderate the negative impact of COVID-19 related information on the stock markets. Both the Hausman test and the Breusch–Pagan LM test show that random-effects model is the correct model for the analysis.
V. CONCLUSION AND POLICY IMPLICATIONS
This study examined the role of media coverage of the COVID-19 information on the stock market returns and volatility for the 10 worst hit countries. We divided the COVID-19 period into two phases based on the spread of the virus in order to examine its effect on stock returns and volatility during the 2 phases. The study found that stock market returns for most of the countries experienced low to negative returns and higher volatility at the onset of COVID-19. In the later phase of COVID-19, returns improved but volatility remained high. This may be attributed to reduced uncertainty related to the virus in the later phase. Volatility remained high in the later phase primarily due to lockdown restrictions in most of the countries studied.
When the coronavirus was limited to China, stock markets in all the countries considered experienced negative returns and high volatility. This may be attributed to the proactive role of the media in these countries. Our bivariate regression results showed a positive and significant relationship between media coverage of COVID-19 and stock market volatility, but a negative and significant relationship between media coverage and stock returns. This is consistent prior studies. However, when we interacted media coverage with health-preparedness, the coefficient of the interaction term was positive for stock returns and negative for stock volatility, indicating that the effect of health preparedness helped to mitigate the negative impact of media coverage related to COVID-19 on the stock market.
A recent study by Dash et al. (2020) also emphasised the need for government to invest more resources in the health sector for a more resilient economy. Along similar lines, the emphasis on healthcare preparedness in this study is an important contribution to the already burgeoning literature on COVID-19 and stock markets.
Government lockdown stringency can also be a contributing factor to the volatility of stock returns and can be tested as a determining factor in future research.
REFERENCES
Akhtaruzzaman, M., Boubaker, S., & Sensoy, A. (2020). Financial Contagion during COVID–19 Crisis. Finance Research Letters, 101604.
Al-Awadhi, A.M., Al-Saifi, K., Al-Awadhi, A., & Alhamadi, S. (2020). Death and Contagious Infectious Diseases: Impact of the COVID-19 Virus on Stock Market Returns. Journal of Behavioral and Experimental Finance, 100326.
Alfaro, L., Chari, A., Greenland, A.N., & Schott, P.K. (2020). Aggregate and Firm- Level Stock Returns during Pandemics, In Real Time (Working Paper No. w26950).
National Bureau of Economic Research.
Ali, M., Alam, N., & Rizvi, S.A.R. (2020). Coronavirus (COVID-19)–An Epidemic or Pandemic For Financial Markets. Journal of Behavioral and Experimental Finance, 100341.
Apergis, E., & Apergis, N. (2020). Can the COVID-19 Pandemic and Oil Prices Drive the US Partisan Conflict Index? Energy Research Letters, 1, 13144.
Ashraf, B.N. (2020). Stock markets’ reaction to COVID-19: Cases or Fatalities?
Research in International Business and Finance, 101249.
Aslam, F., Awan, T. M., Syed, J. H., Kashif, A., & Parveen, M. (2020). Sentiments and Emotions Evoked by News Headlines of Coronavirus Disease (COVID-19) Outbreak. Humanities and Social Sciences Communications, 7, 1-9.
Bai, L., Wei, Y., Wei, G., Li, X., & Zhang, S. (2020). Infectious Disease Pandemic and Permanent Volatility of International Stock Markets: A Long-Term Perspective. Finance research letters, 101709.
Baker, S.R., Bloom, N., Davis, S.J., Kost, K.J., Sammon, M. C., & Viratyosin, T.
(2020). The unprecedented stock market impact of COVID-19 (Working Paper No.
w26945). National Bureau of Economic Research.
Becchetti, L., & Ciciretti, R. (2011). Stock Market Reaction to the Global Financial Crisis: Testing For The Lehman Brothers’event. Giornale degli Economisti e Annali di Economia, 3-58.
Conlon, T., & McGee, R. (2020). Safe Haven or Risky Hazard? Bitcoin during the COVID-19 Bear Market. Finance Research Letters, 101607.
Dai, P. F., Xiong, X., & Zhou, W. X. (2020). A Global Economic Policy Uncertainty Index from Principal Component Analysis. Finance Research Letters, 101686.
Das, A., Dash, D. P., & Sethi, N. (2020). Innovation, Corruption, and Economic Growth in Emerging Asia. Buletin Ekonomi Moneter Dan Perbankan, 23, 347-364.
Dash, D. P., Sethi, N., & Dash, A. K. (2021). Infectious Disease, Human Capital, and the BRICS Economy in the Time of COVID-19. MethodsX, 8, 101202.
Depoux, A., Martin, S., Karafillakis, E., Preet, R., Wilder-Smith, A., & Larson, H.
(2020). The Pandemic of Social Media Panic Travels Faster Than The COVID-19 Outbreak. Journal of Travel Medicine, 27.
Devpura, N., & Narayan, P.K. (2020). Hourly Oil Price Volatility: The Role of COVID-19. Energy Research Letters, 13683. https://doi.org/10.46557/001c.13683 Ding R., Zhou H., & Li Y. (2019) Social Media, Financial Reporting Opacity, and
Return Comovement: Evidence from Seeking Alpha. J. Financial Mark. 50, 100511.
Erdem, O. (2020). Freedom and Stock Market Performance during Covid-19 Outbreak. Finance Research Letters, 101671.
Ertuğrul, H.M., Güngör, B.O., & Soytaş, U. (2020). The Effect of the COVID-19 Outbreak on the Turkish Diesel Consumption Volatility Dynamics. Energy Research Letters, 1, 17496. https://doi.org/10.46557/001c.17496
Fan, V.Y., Jamison, D.T., & Summers, L.H. (2018). Pandemic Risk: How Large are The Expected Losses? Bulletin of the World Health Organization, 96, 129.
Fu, M., & Shen, H. (2020). COVID-19 and Corporate Performance in The Energy Industry. Energy Research Letters, 1, 12967. https://doi.org/10.46557/001c.12967 Gangopadhyay, P., Haley, J. D., & Zhang, L. (2010). An Examination of Share
Price Behavior Surrounding the 2005 Hurricanes Katrina and Rita. Journal of Insurance Issues, 132-151.
Global Economic Prospects (2020). June 2020. World Bank Group, Washington DC.
Goodell, J.W. (2020). COVID-19 and Finance: Agendas for Future Research. Finance Research Letters, 101512.
Haldar, A., & Sethi, N. (2020). The Effect of Country-Level Factors and Government Intervention on The Incidence of COVID-19. Asian Economics Letters, 1, 17804.
https://doi.org/10.46557/001c.17804
Haroon, O., & Rizvi, S.A.R. (2020a). COVID-19: Media Coverage and Financial Markets Behavior—A Sectoral Inquiry. Journal of Behavioural and Experimental Finance, 100343.
Haroon, O., & Rizvi, S.A.R. (2020b), Flatten the Curve and Stock Market Liquidity - An Inquiry Into Emerging Economies. Emerging Markets Finance and Trade, 56(10).
Huang, W., & Zheng, Y. (2020). COVID-19: Structural Changes in The Relationship Between Investor Sentiment and Crude Oil Futures Price. Energy Research Letters, 1(2), 13685. https://doi.org/10.46557/001c.13685
Huerta, D., Perez-Liston, D., & Jackson, D. (2011) The Impact of Tarp Bailouts on Stock Market Volatility and Investor Fear Bank. Finance Rev., 3, 45-54.
Iyke, B.N. & Ho, S.Y. (2021). Investor Attention on COVID-19 and African Stock Returns. MethodsX, 8, 101195.
Iyke, B.N. (2020a). COVID-19: The Reaction of US Oil and Gas Producers to the Pandemic. Energy Research Letters, 1, 13912. https://doi.org/10.46557/001c.13912 Iyke, B.N. (2020b) The Disease Outbreak Channel of Exchange Rate Return
Predictability: Evidence from COVID-19. Emerging Markets Finance and Trade, 56, 2277-2297.
Iyke, B.N. (2020c). Economic Policy Uncertainty in Times of COVID-19 Pandemic.
Asian Economics Letters, 1, 17665. https://doi.org/10.46557/001c.17665
Iyke, B.N., & Ho, S.Y. (2020). Consumption and Exchange Rate Uncertainty:
Evidence from Selected Asian countries. The World Economy, 43(9), 2437-2462.
Kantos, C. (2020). How the Pandemic Taught Us to Turn Smart Beta into Real Alpha. Journal of Asset Management, 21, 581-590.
Karolyi, G. A. (2006). The Consequences of Terrorism for Financial Markets: What Do We Know? Available at SSRN 904398.
Kowalewski, O., & Śpiewanowski, P. (2020). Stock Market Response to Potash Mine Disasters. Journal of Commodity Markets, 100124.
Liu, L., Wang, E.Z., & Lee, C.C. (2020). Impact of the COVID-19 Pandemic on The Crude Oil and Stock Markets In The US: A Time-Varying Analysis. Energy Research Letters, 1, 13154. https://doi.org/10.46557/001c.13154
Lyócsa, Š., & Molnár, P. (2020). Stock Market Oscillations during The Corona Crash: The Role of Fear and Uncertainty. Finance Research Letters, 36, 101707.
Mazur, M., Dang, M., & Vega, M. (2020). COVID-19 and the March 2020 Stock Market Crash. Evidence from S&P1500. Finance Research Letters, 101690.
Mishra, A.K., Rath, B.N., & Dash, A.K., (2020) Does the Indian Financial Market Nosedive Because of the COVID-19 Outbreak, in Comparison to After Demonetization and the GST? Emerging Markets Finance and Trade, 56, 2162- 2180.
Narayan, P.K. (2020a). Oil Price News and COVID-19—Is There Any Connection? Energy Research Letters, 1, 13176. https://doi.org/10.46557/001c.13176 Narayan, P. K. (2020b). Has COVID-19 Changed Exchange Rate Resistance to
Shocks. Asian Economics Letters, 1, 17389. https://doi.org/10.46557/001c.17389 Narayan, P. K. (2020c). Did Bubble Activity Intensify during COVID-19. Asian
Economics Letters, 1, 17654. https://doi.org/10.46557/001c.17654
Narayan, P.K., Devpura, N., & Wang, H., 2020. Japanese Currency and Stock Market—What Happened During the COVID-19 Pandemic? Economic Analysis and Policy, 68, 191-198.
Narayan, P.K., Gong, Q., &Ahmed, H.J.A., (2020) Is there a Pattern in How COVID-19 Has Affected Australia’s Stock Returns? Applied Economics Letters, https://doi.org/10.1080/13504851.2020.1861190.
Nelson, D. B. (1991). Conditional Heteroskedasticity in Asset Returns: A New Approach. Econometrica: Journal of the Econometric Society, 347-370.
Phan, D.H.B., & Narayan, P.K., (2020) Country Responses and The Reaction of The Stock Market to COVID-19—a Preliminary Exposition. Emerging Markets Finance and Trade; 56, 2138-2150.
Rognone, L., Hyde, S., & Zhang, S. S. (2020). News Sentiment in The Cryptocurrency Market: An Empirical Comparison With Forex. International Review of Financial Analysis, 69, 101462.
Salisu, A., & Adediran, I. (2020). Uncertainty Due to Infectious Diseases and Energy Market Volatility. Energy Research Letters, 1, 14185. https://doi.
org/10.46557/001c.14185
Sansa, N. A. (2020). The Impact of the COVID-19 on the Financial Markets:
Evidence from China and USA. Electronic Research Journal of Social Sciences and Humanities, 2.
Sha, Y., & Sharma, S.S., (2020) Research on Pandemics Special Issue of the Journal Emerging Markets Finance and Trade, 56, 2133-2137.
Sharma, S. S. (2020). A note on the Asian market volatility during the COVID-19 pandemic. Asian Economics Letters, 1, 17661. https://doi.org/10.46557/001c.17661 Smales, L.A. (2014). News Sentiment and the Investor Fear Gauge. Finance Research
Letters, 11, 122-130.
Smales, L.A. (2017). The Importance of Fear: Investor Sentiment and Stock Market Returns. Applied Economics, 49, 3395-3421.
Sohrabi, C., Alsafi, Z., O’Neill, N., Khan, M., Kerwan, A., Al-JabirR. (2020). World Health Organization Declares Global Emergency: A Review of The 2019 Novel Coronavirus (COVID-19). Int. J. Surg. 76, 71–76.
Subrhamanyam, A. (2019) Big data in finance: Evidence and challenges. Borsa Istanbul Rev. 19,283–287.
Thomas, B., Chandran, P., Lilabi, M. P., George, B., Sivakumar, C. P., Jayadev, V. K.,
& Hafeez, N. (2019). Nipah Virus Infection in Kozhikode, Kerala, South India, in 2018: Epidemiology of An Outbreak of An Emerging Disease. Indian Journal of Community Medicine: Official Publication of Indian Association of Preventive &
Social Medicine, 44, 383.
Wagner, A. F. (2020). What the Stock Market Tells Us About The Post-COVID-19 World. Nature Human Behaviour, 4, 440-440.
Whaley, R. E. (2000). The Investor Fear Gauge. The Journal of Portfolio Management, 26, 12-17.
World Health Organization. (2020). Coronavirus disease 2019 (COVID-19). Situation Report, 82. World Health Organization
Zaremba, A., Aharon, D. Y., Demir, E., Kizys, R., & Zawadka, D. (2021). COVID-19, Government Policy Responses, and Stock Market Liquidity Around The World: A Note. Research in International Business and Finance, 56, 101359.
Zhang, D., Hu, M., & Ji, Q. (2020). Financial Markets under The Global Pandemic of COVID-19. Finance Research Letters, 101528.
Zhang, X., Fuehres, H., & Gloor, P. A. (2011). Predicting Stock Market Indicators Through Twitter “I Hope It Is Not As Bad As I Fear”. Procedia-Social and Behavioral Sciences, 26, 55-62.
This page is intentionally left blank