Development of Electrical Hazard and Probability (ELHAP) Tool Related to Equipment and System Failure
by
Mohd Rosli bin Kamarudclin
Dissertation submitted in partial fulfillment of the requirements for the
Bachelor of Engineering (Hons) (Chemical Engineering)
JANUARY 2009
Universiti Teknologi PETRONAS Bandar Seri Iskandar
31750 Tronoh Perak Darul Ridzuan
CERTIFICATION OF APPROVAL
Development of Electrical Hazard and Probability (ELHAP) Tool Related to Equipment and System Failure
Approved by,
by
Mohd Rosli bin Kamaruddin
A project dissertation submitted to the Chemical Engineering Programme Universiti Teknologi PETRONAS in partial fulfihnent of the requirement for the
BACHELOR OF ENGINEERING (Hons) (CHEMICAL ENGINEERING)
(A.P Dr. Azmi Mohd. Shariff)
UNIVERSITI TEKNOLOGI PETRONAS TRONOH, PERAK
January 2009
CERTIFICATION OF ORIGINALITY
This is to certify that I am responsible for the work submitted in this project, that the original work is my own except as specified in the references and acknowledgements, and that the original work contained herein have not been undertaken or done by unspecified sources or persons.
MOHD ROSLI BIN KAMARUDDIN
ABSTRACT
Electrical safety in the industrial process plant plays an important role to ensure overall safety of the chemical plant, but most of the time this subject has been largely ignored leading to major accidents in the plant. Due to this reason, many researchers find that it is important to understand completely the electrical system to avoid any accident in the plant. Hazard and Operability (HAZOP) analysis tool is widely used as qualitative tool to identify potential hazards that can cause major accidents in the plant, while the Fault Tree Analysis (FTA) method is widely used to estimate the probability of occurrences of the hazards. However, they have never been implemented vigorously to identify potential hazards due to electrical equipment and system failure. Thus, the main objective of this project is to provide a framework for systematic investigation of the problems in process plant due to electrical equipment and system failure. This project consists of analysis that is done to complement the need for detailed study of the electrical hazard. The analysis will include both qualitative HAZOP analysis approach to identify the possible hazards and a quantitative FTA assessment to rank the hazardous event accordingly for direct implementation in industrial case study. The tools developed will provide a detail review of chemical plant safety focusing on electrical equipments and system design.
At the end of the study, the analysis will help to provide suggestion to improve the design, installation, operation and maintenance procedures in order to optimize the safety and operability in the plant.
ACKNOWLEDGEMENT
First and foremost I would like to praise Allah S.W.T The Most Gracious, The Most Merciful for blessing me with the gift of knowledge and health from day one until the completion of the project.
My utmost gratitude goes to my supervisor, A.P Dr. Azmi M. Shariff. He has given precious advice and ideas in completing this project throughout the two semesters.
His encouragements and willingness to provide constructive criticism and suggestions are very much appreciated.
I would like to take this opportunity to thank Mr. M. Tazli Azizan, the Final Year Project (FYP) Coordinator for January 2009 for his efforts in making sure that the commencement of FYP is successful. In addition, I would like to express my gratitude to Mr. Zulkifli bin Ibrahim from PETRONAS Fertilizer Kedah Sdn. Bhd., and Dr. Moulay Rachid Babaa as the evaluators for my fmal oral presentation.
Most important of all, my deepest appreciation goes to my family for their undying love and motivation in seeing me successfully pulls off another great chapter in my life as a student in UTP. Last but not least, I would like to thank my fellow friends for their continuous support and advice in completing this project.
Thank: you.
TABLE OF CONTENTS
LIST OF FIGURES ... ix
LIST OF ABBREVIATIONS ... x
CHAPTER 1 ffiTRODUCTION ... ! 1.1 BACKGROUND OF STUDY ... 1
1.2 PROBLEM STATEMENT ... 2
1.3 OBJECTIVES AND SCOPE OF STUDY ... 3
CHAPTER 2 LITERATURE REVIEW ... 4
2.1 SAFETY ANALYSIS ... .4
2.2 ELECTRICAL HAZARD ... 5
2.3 EFFECTS OF ELECTRIC CURRENT ... 6
2.4 QUALITATIVE METIIOD ... 6
2.4.1 HAZOP analysis ... 7
2.5 QUANTITATIVE METIIOD ... 8
2.5.1 Fault tree analysis method ... 9
2.5.2 Basic Fault Tree Symbols ... 10
2.5.3 Limitation ofFTA ... 10
2.5.4 Failure rate ... 11
2.5.5 Failure probability ... 12
2.6 CURRENT TOOLS AVAILABLE ... 13
CHAPTER 3 METHODOLOGY ... 14
3.1 ELHAP PROCEDURES ... 14
3.2 TOOLS ... 15
3.3 IMPLEMENTATION ... 15
3.4 SAFETY TEAM ... 17
3.5 PROCEDURES ... 17
3.6 FAULT TREE ANALYSIS (FTA) METHOD ... 25
3.6.1 FTA Procedures ... 25
3.6.2 Probability Calculation ... 26
3 .6.3 Boolean algebra ... 27
CHAPTER 4 RESU[;T AND DISCUSSION ... 29
4.1 INDUSTRIAL CASE STUDY ... 29
4.2 LPP HIGH VOLTAGE GAS TURBINE SYNCHRONIZATION
STEPS ... 30
4.2.1 Gas turbine system ... 30
4.2.2 Safety clearances from live conductors ... 30
4.2.3 Isolation step ... 31
4.2.4 Synchronization steps ... 31
4.2.4.1 Pre Condition ... 31
4.2.4.2 Switching Steps ... 32
4.2.5 ELHAP Analysis ... 32
4.2.6 FTA Method ... 35
4.3 PFKSB llOV ALTERNATING CURRENT UNINTERRUPTffiLE POWER SUPPLY (AC UPS) ... 38
4.3.1 ELHAP Analysis ... 39
4.3.2 FTAAnalysis ... 39
4.4 COMPARISON WITH OTHER TOOLS ... 43
CHAPTER 5 CONCLUSION AND RECOMMENDATION ... .45
5.1 CONCLUSION ... 45
5.2 RECOMMENDATION ... 45
REFERENCES ... 46
APPENDIX A General Relationship Between The Amount Of Current Received And The Reaction ... 48
APPENDIX B Definition Of Related Terms ... 49
APPENDIX C General Rules Of Boolean Algebra ... 53
APPENDIX D Selected Failure Rate Data ... 54
APPENDIX E Single Line Diagram Of Lumut Power Plant (l) ... 57
Single Line Diagram Of Lumut Power Plant (li) ... 58
APPENDIX F Single Line Diagram Of Gas Turbine ... 59
APPENDIX G Single Line Diagram Of Ac Ups OfPtk ... 60
APPENDIXH General Requirements For Ac Ups System ... 61
LIST OF TABLES
Table 1: The standard current guide words used ... 8
Table 2: Suggested table for ELHAP study ... 22
Table 3: Example of analysis using suggested procedures ... 24
Table 4: Minimum clearance from exposed conductor for different voltage ... 30
Table 5: ELHAP analysis for gas turbine synchronization system ... 33
Table 6: ELHAP analysis for the AC UPS system ... .40
Table 7: Side by side comparison between ELHAP and other methods ... .43
LIST OF FIGURES
Figure 1: Basic concept of ELHAP ... 2
Figure 2: A Fault Tree Analysis diagram ... 9
Figure 3: Primary event symbols used in FTA ... 10
Figure 4: Gate symbols used in FTA ... 10
Figure 5: Implementation of ELHAP in system design, operation and maintenance procedures for new system design and on-going plant operation ... 16
Figure 6: Suggested procedure for ELHAP ... 20
Figure 7: FTA analysis for the electrical shock hazard in the gas turbine system ... 36
Figure 8: FTA analysis for the explosion hazard in the gas turbine system ... 37
Figure 9: Typical arrangement of AC UPS system ... 38
Figure 10: FTA analysis for the electrical shock hazard at AC UPS System ... 41
Figure 11: FTA analysis for the system failure at AC UPS system ... .42
AC ALARP ETA ELHAP F&EI FTA HAZOP ICI IFAL OREDA OSHA
LIST OF ABBREVIATIONS
Alternating current
As low as reasonably practicable Event Tree Analysis
Electrical Hazard and Probability Fire and Explosion Index
Fault Tree Analysis Hazard and Operability Imperial Chemical Industry
Instaneous Fractional Annual Loss Offshore Reliabilty Database
Occupational Safety and Health Administration MPPD Maximum Probable Property Damage
P&ID Piping and Instrumentation Diagram PETRONAS Petroliam National Berhad
PFKSB PHA PTS
SLD UPS
PETRONAS Fertilizer Kedah Sendirian Berhad Process Hazard Analysis
PETRONAS Technical Standard Single Line Diagram
Uninterruptible Power Supply
CHAPTER I INTRODUCTION
1.1 BACKGROUND OF STUDY
Electrical safety is very critical for any electrical system and equipment operating in the hazardous area such as in the power plant and chemical plant. Hazard and Operability (HAZOP) and Fault Tree Analysis (FTA) tools are the basic components in developing the tool to perform the electrical hazard analysis in this project. The abbreviation for the tool developed will be called ELHAP assessment in the entire report. ELHAP is derived from "Electrical Hazard and Probability" phrase because the tool not only identifies all of possible hazards, but it provides probability for major hazards. In addition, "hap" here also means fortune or luck, in which if it is combined with the "electricaf' term at the front syllable, it can be interpreted as bringing luck or fortune to the electrical system or to the plant in general since electrical safety analysis is a very crucial element for safe operation in chemical plant.
Detailed study is required to do thorough analysis of the problems due to electrical system and equipment failure. All of the components in the electrical system need to be identified and analyzed from the Piping and Instrumentation Diagram (P&ID) or Single Line Diagram (SLD) of the specific plant. Similar approach to HAZOP method will be used to identify all possible causes of the problems in which a series of guidewords will be introduced as a systematic approach for further analysis. Once the causes are recorded, the safety team involves will list all of the consequences and any recommendation deemed appropriate. During the analysis, if the consequence is very siguificant in which it involves considerable amount of loss, or major harm to the personnel, FTA tool will be implemented to calculate the probability in order to
predict the likelihood of occurrences of the hazard. If the hazard has very high probability, then the recommended actions should be taken into consideration irrespective of cost or changes it will make. Hazard with higher probability must be prioritized to optimize the safety. It is aimed that the tools developed will be used as a practical and systematic framework to analyze and minimize the potential hazards due to electrical equipments and system failure, to ultimately optimize the safety and operability in the plant by improving the system design, installation, operation and maintenance procedures. This is to comply with the safety analysis purpose which is to reduce the risks as low as reasonably practicable (ALARP) in any workplace.
1.2 PROBLEM STATEMENT
HAZOP analysis tool is widely used as qualitative tool to identify potential hazards that can cause major accidents in the plant. However, this tool has never been implemented vigorously to identify potential hazards due to electrical equipment and system failure. In this project, FT A method will be implemented as an additional component along with the HAZOP analysis as the basic component and it will be used as a quantitative tool to rank the hazardous events accordingly. The combination of both methods will provide a newly developed systematic tool to make sure that it is more structured, appropriate and efficient for direct implementation in industrial case study. It is not the intention of this project to duplicate the current tools but it is intended to provide alternative tools for the safety analysis and to complement with the current available tools.
Quantitative Qualitative Method
+
Method(HAZOP) (FTA)
~--- ---~ V'
Eledrical Hazard and Probability
(ELHAP)
Mitigation Action
1.3 OBJECTIVES AND SCOPE OF STUDY The main objectives of this research work are:
• To develop qualitative review or assessment of the problems due to electrical equipment and system failure in the plant by using HAZOP methodology approach
• To develop quantitative analysis tool based on FTA to rank the hazardous events
• To test the framework and tool developed using industrial case study
The scope of work for this project is mainly to provide a new framework for systematic identification and analysis of electrical hazards in the process plant due to electrical equipments and system failure. The framework or tool developed will be directly implemented in the industrial application to test for its efficiency and suitability. The project is considered significantly valuable due to the following reasons:
i. There is very limited detailed research that has been done on the same subject (electrical safety) so far. HAZOP approach is considered as one of the most complete guide for safety analysis but it mainly covers process units in general rather than auxiliary plant such as power generators.
ii. Combination of HAZOP and FT A approaches will provide a more detailed safety analysis. Many researchers only focus their researches on how to automate usage of HAZOP and FTA tools separately instead of combining them in a new single tool.
iii. The tool developed will help to provide stringent decision on actions that involve high cost or major changes to the design due to safety issues since it not only analyzes the potential hazards, but it gives probability for hazards with higher level of risk.
CHAPTER2
LITERATURE REVIEW
2.1 SAFETY ANALYSIS
Process hazard analysis (PHA) ensures equipment safety and identifies the possible hazards that may arise as a result of equipment malfunctions and deviations of process variables (temperature, pressure, etc) from normal operation, and it uses various different techniques such as fault tree analysis (FTA), event tree analysis (ETA), what-if analysis, and Hazard and Operability (HAZOP) analysis (1].
A system can be considered safe if it is free from accidents and unacceptable loss.
Hazard in the system is a state or condition of the system that can, in the presence of a stimulus from the environment, lead to an accident or loss. Environment here refers to location or surroundings where the system operates. M. Berry (1998) stated that in order to make sure that a system is safe, the most important key are the identification of hazards and an analysis of what to do about the hazards (2].
In some cases, the cause of a hazard can be identified, and then it can be controlled or eliminated. For some other cases, often it is impossible to predict in advance all possible causes of all possible hazards. Thus, it is important to gather as much information as possible about a particular system to hope that this information allows detection of the causes of all hazards before they lead to accidents (2].
Currently a number of analysis techniques are used for safety analysis. The used analysis techniques can be grouped into quantitative techniques and qualitative techniques. Qualitative techniques compare and classify safety based on experience of the team that analyzes the hazard, while the quantitative techniques compare and classify safety based on calculation results using mathematical models.
According to Rouvroye et al.(2002), all techniques can be used to analyze the safety of industrial processes but the results will be different from each other due to different analysis techniques that start with different actions, end with different actions and follow different path in between start and finish. The authors suggested that the analysis technique that covers the most aspects relevant to the specific situation is used to produce the best result [3].
Thus it is very important to provide a detailed study specifically designed for electrical system to cover more aspects related to electrical safety.
2.2 ELECTRICAL HAZARD
Electricity has been long recognized as a serious workplace hazard, exposmg employees to electrical shock, electrocution, burns, fues, and explosions [4].
Electrical injury is caused by current passing through the body. The damage and injury to the body are proportional to the amount of current through the body and the current density [ 5].
Successful accident prevention relies to a large extent on knowledge about the causes of accidents. The causes of electrical fatalities at work, according to Williamson et al.(l998) can be classified into four major factors which are:
1. Environmental events: events or conditions resulting from the location of the accident; these conditions could not have been changed at that point in time (e.g., low lighting, wet floor or cramped conditions).
ii. Equipment events: events resulting from breakage or malfunction of machinery or tools that occur at that point in time.
iii. Medical events: events resulting from the current state of physical well-being (e.g., heart attack or diabetic or epileptic episode).
iv. Behavioral events: events resulting directly from human involvement (e.g., leaning too far into the path of machinery, touching an electrically charged
object, etc.). [6]
It is very important to identifY and analyze the possible hazard in the process plant that can be caused by all of the above factors including the equipment events, in this case due to electrical equipment and system failure to make sure that the plant operation is as safe as reasonably practicable (ALARP).
2.3 EFFECTS OF ELECTRIC CURRENT
An electric shock can result in anything from slight tingling sensation to immediate cardiac arrest. The severity depends on the following factors:
i. The amount of current flowing through the body ii. The current's path through the body
iii. The length of time the body remains in the circuit iv. The current's frequency
Burns are the most common shock-related injury. An electrical shock can result in an electrical burn, arc burn, thermal contact burn, or a combination of burns. Electrical burns occur when electric current flowing through tissues or bone, generating heat that cause tissue damage. Arc or flash burn results from high temperature caused by an electric arc or explosion near the body. Thermal contact burns occur when the skin touches hot surfaces of overheated electric conductors, conduits, or other energized equipments [4).
Appendix A provides more details of general relationship between the amount of current received and the reaction to the body when current flows from the hand to foot in the basis of 1 second reaction time.
2.4 QUALITATIVE METHOD
Qualitative method is a type of hazard analysis that implements the experience and expertise in particular subject to analyze the hazards. There are a number of approaches that can be used to qualitatively analyze the hazard and one of them is to use hazard and operability method.
Hazard and operability study is a methodology for identifying and dealing with potential problems in industrial processes, particularly those which would create a hazardous situation or a severe impairment of the process. It is commonly known as HAZOP. It is said to be the most widely used method of hazard analysis in the process industries, notably the chemical, petrochemical and nuclear industries.
2.4.1 HAZOP analysis
In this project, HAZOP will be used as a basic qualitative tool to identify the possible hazard by means of achieving specified design intentions of a particular plant. The design intentions here refer to the specific purposes of designing the plant.
HAZOP involves a team of experts to do the analysis in which it allows the members to brainstorm their opinions using their experience from within their specific fields of expertise. This method applies to processes either existing or planned for which the design information is available. The HAZOP team will need to identify the possible significant deviations that can affect each of the intention by referring to the P&ID of the plant, as well as to determine the related causes and consequences.
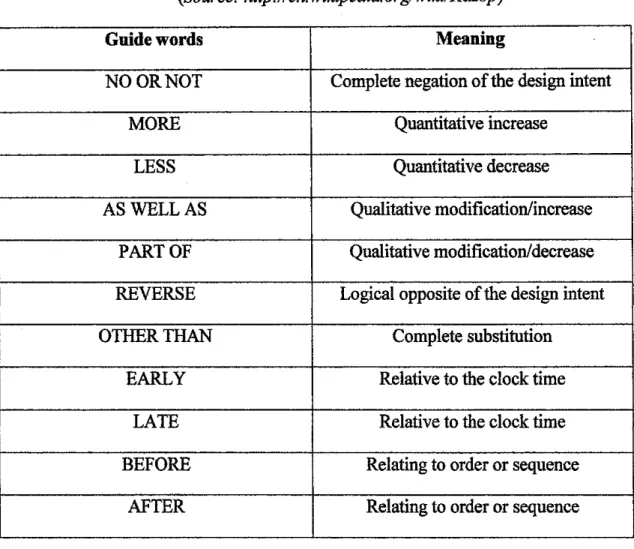
This procedure requires certain standard that need to be followed, which is to use a series of guidewords provided combining with the parameters that can cause deviations to each of the design intention. The combination of guidewords and the parameters will provide the cause of the possible deviations, and later they will be extended further to identify the consequences of the deviations. The deviations must have certain significance or consequences for them to be accepted as possible hazards. In this project, this is where quantitative FTA method will be integrated with HAZOP method to rank the possible hazards accordingly to make sure that high level risk is being prioritized. The current standard guide words used in HAZOP tools are as shown in Table 1.
Table 1: The standard current guide words used (Source: http://en. wikipedia. orglwiki/Hazop)
Guide words Meaning
NO OR NOT Complete negation of the design intent
MORE Quantitative increase
LESS Quantitative decrease
ASWELLAS Qualitative modification/increase
PART OF Qualitative modification/ decrease REVERSE Logical opposite of the design intent
OTHER THAN Complete substitution
EARLY Relative to the clock time
LATE Relative to the clock time
BEFORE Relating to order or sequence
AFTER Relating to order or sequence
To make sure that specific focus is made to hazard related to electrical equipments and system failure, a series of physical parameters will be suggested. If the combinations between guide words and the physical parameters are meaningful or have certain siguificance, they are considered as potential deviations. Once the causes and consequences of each potential hazard have been determined and established, the system or operation being studied can be modified to improve its safety. 1n this project, certain recommendations will be provided along with specific causes of deviations to make sure that the plant safety can be optimized.
2.5 QUANTITATIVE METHOD
Quantitative method uses calculation results using mathematical models to assess the risk of identified possible hazards. This method is important to rank each of the possible hazards according to the level of risk it contains, and to what extent it is
significant to be taken into consideration. The risk level here may depend on the likelihood of occurrence of the hazards, how often they occur (frequency), and how large are the impacts or consequences of the entire events (injuries or fatalities). Two most widely used methods in determining the risk level of the hazards are Fault Tree Analysis (FTA) and Event Tree Analysis (ETA).
2.5.1 Fault tree analysis method
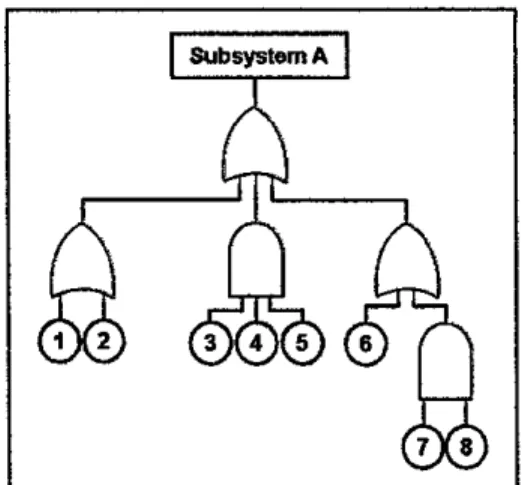
Fault Tree Analysis or FTA method is used widely as a tool for quantitative risk assessments. It attempts to model and analyze failure processes of engineering systems. FTA is composed oflogic diagrams that display the state of the system and is constructed using graphical design techniques to analyze top-level event that leads to possible hazards in term of sub-events, followed by lower order events, which eventually leads to individual events that have caused the top-level event. The basic elements of a fault tree may be classed as (1) the top event, (2) primary (basic) events, (3) intermediate events and ( 4) logic gates. The top event is normally some undesired event. Typical top events are flanunable or toxic releases, fires, explosion and failures of various kinds. Primary (basic) events are events that require no further development. Intermediate events are the events in the tree between the top event and the primary events at the bottom of the tree. Logic gates define the logic relating the inputs to the outputs. The two principal gates are the AND gate and the OR gate. The output of an AND gate exists only if all the input exist. The output of an OR gate exists provided at least one of the input exists [7).
Figure 2: A Fault Tree Analysis diagram
(Source: http://en. wikipedia. org/wiki/lmage:F ault _jree.png)
2.5.2 Basic Fault Tree Symbols
Figure 3 shows the basic symbols of the events used in FTA method, while Figure 4 show the basic gate symbols used in the method.
Primary Event Symbols
0
Basic EventQ
ConditioningEvent0
UndevelopedEventQ
ExtemalEventFigure 3: Primary event symbols used in FTA (Source: http://en. wikipedia.orgl)
Gate Symbols
0 AND
{~j
ORu
Exclusive OR,w Priority AND
0
'Inhibit
Figure 4: Gate symbols used in FT A(Source://http://en. wikipedia.orgl)
2.5.3 Limitation of FTA
Although obtaining the exact top event probability of the FTA is one of the most important aims in any analysis, it is a difficult problem for a reasonably large scale system with complex structure such as a chemical plant. According to S. Yanagi et al.(2008), the complex representation of FT A diagram for such plant are caused by several type of dynamic behaviors that exist in the analysis such as sequence
dependency [8]. The limitation of reliability of FTA method in modeling the dynamic systems has also been discussed by Bucci et al. (2008) [9].
Markov modeling is an advance technique that can be used for dynamic system and time dependant failures but many engineers do not feel comfortable with Markov modeling and its fundamental mathematical background [10]. This project however does not consider dynamic properties of the system which will end up making the analysis more complex than it should be. In addition, electrical equipment and system failures usually do not significantly involves dynamic behaviors.
FTA can be used because it explicitly expresses how equipment failures and system failures can lead to potential hazards in a graphical representation that is easy to understand. It identifies major risk contributors and combinations of primary failures (and human errors) that lead to an undesirable incident. In particular, it quantifies benefits associated with process safe guards and compares risk-reduction measures quantitatively in terms of safety. It is a structured methodology and well documented, ready to modify according to system changes [10].
2.5.4 Failure rate
In order to calculate the probability or failure distribution of top events, probabilities or failure distributions of all basic events are required. Dearth of failure rate data and the large uncertainty associated with the data is a considerable problem in the application of FTA. With data collection and exchange efforts from both the government agencies and industry, this problem is slowly being ameliorated [10].
Failure rates depend on various factors including the function of the equipment, the definition of failures, the process conditions, and the maintenance plan. The ideal situation for a reliability study is to have sufficient plant data from identical equipment from the same process. However, in many cases, in-house data are not always available. For new plants, there are essentially no historical failure rate data.
In those cases, generic data from external sources must be used [10].
There are various sources for failure rate database such as The Data Acquisition Working Party of the Mechanical Reliability Committee of the Institution of
Mechanical Engineers in the United Kingdom, Guidelines for Process Equipment Reliability Data with Data Tables by American Institute of Chemical Engineers, and Offshore Reliability Data Bank (OREDA) (1984, 1988, 1997, and 2002) [10] [11]
[12]. A comprehensive compilation of failure rate and event data can also be found in Loss Prevention in the Process Industries Volume 3 (Lees, 1996) (13].
FTA in this project will use available Failure Rate Data of components and processes in the basic events from the above mentioned sources to estimate the probability of the top event.
2.5.5 Failure probability
The Failure Rate Data shows the average component failure over a period of time.
This is called the failure rate and it is represented by J.l with units of faults/time. The units used are usually failures per 106 hours. The probability the component will not fail during the time interval (0, t) is given by a Poisson distribution [14].
R(t) = e·~t
(2.1)
R = Reliability
J.l =Failure rate (assumed constant), as t--> oo the reliability goes to 0
The complement of the reliability is called the failure probability, P and is given by
(2.2) P = Probability
J.l =Failure rate (assumed constant), as t--> oo the reliability goes to 1
The failure probability is the value that is used in the probability calculation for every event. The sources of failure rate data available depend on user. It may be obtained from external -sources such as the literature and data banks. Alternatively they may be collected within the works.
2.6 CURRENT TOOLS AVAILABLE
There are established indices such as the Dow Fire and Explosion Index (F&EI), the Mond Index, and the Instantaneous Fractional Annual Loss (IFAL) Index which can be used for systematically identifying hazards and providing a method of ranking priorities.
The Dow F&EI is the most widely used hazard index. It was originally developed by the Dow Chemical Company in 1964 to assist in the selection of fire protection methods. The analysis divides a plant into separate process units and assigns indices based on material properties, process conditions, areas of exposure, and other damage factors to derive the base maximum probable property damage (MPPD).
Loss control credits are then applied to adjust MPPD to calculate actual MPPD. The guide has been updated several times but still only covers process units rather than auxiliary plant such as power generators [10).
The Mond Index was developed by Imperial Chemical Industry (ICI) for the chemical industry, after the Flixborough disaster. The hazard is assessed in a similar way to the Dow F&EI index but introduces additional considerations. Initial assessments of fire, explosion and toxicity are carried out for each process unit.
Offsetting factors for prevention and protection measures are then assigned and combined with initial indices. Finally, an overall risk rating is derived from individual fue, explosion, and toxicity indices. It provides a more comprehensive treatment of hazards from materials, reactious and toxicity [10).
The IF AL index was originally developed for insurance assessment purpose by the Insurance Technical Bureau. It requires dividing the plant into blocks, and the contribution of each major item of process equipment is determined according to process factors, engineering factors, and management factors. Frequency and size of potential emissions and chance of ignition are used to determine damage [10).
CHAPTER3 METHODOLOGY
3.1 ELHAP PROCEDURES
Electrical Hazard and Probability (ELHAP) assessment consists of two main parts which are:
1. Hazard Identification (Qualitative Method): using similar approach to Hazard and Operability (HAZOP) analysis which uses guidewords in performing the analysis.
ii. Hazard Ranking (Quantitative Method): using Fault Tree Analysis (FTA) probability calculation method to rank the hazard according to the level of risk it possesses.
In order to integrate the two methods together, HAZOP and FTA approach must be synchronized, thus hazards are identified by using keywords and guidewords starting from the top event, similar to FTA analysis. In standard HAZOP method, guidewords is used to initiate causes of sub events from the deviation of parameters that will lead to the top event, but in the ELHAP, the top event is identified as the starting point. This to make sure that it is easier to calculate the probability of each identified hazard during the hazard ranking procedure later.
Special keywords and guidewords are introduced since original HAZOP guidewords are not suitable to be used to identify hazards starting from the top event. In the analysis, only top event that contributes to acceptable amount of risk is being ranked accordingly. This is to make sure that the assessment is as practical as possible.
Details of the methodology are discussed further in the following sections.
3.2 TOOLS
3.2.1 Software Package
Usage of the following software is required ifELHAP is going to be implemented in an automated application form in the future:
i. Microsoft Excel: Software to develop table for the basic HAZOP analysis, and to rank the hazardous event accordingly using FT A tool.
ii. Visual Basic Application: Software that will be used to link the Microsoft Excel to the specific P&ID or SLD of the plant.
3.3 IMPLEMENTATION
It is important that the tool developed, ELHAP can be implemented in the real industrial cases. Safety consideration is very important in both design stage and also for on-going operation, thus the tool developed is aimed to be used for both situations. For this purpose, the following materials are required:
1. Process description
2. Process flow sheet in the form of Single Line Diagram (SLD) 3. Equipment and instrument specifications
4. Layout drawing 5. Operating procedures 6. Maintenance procedures
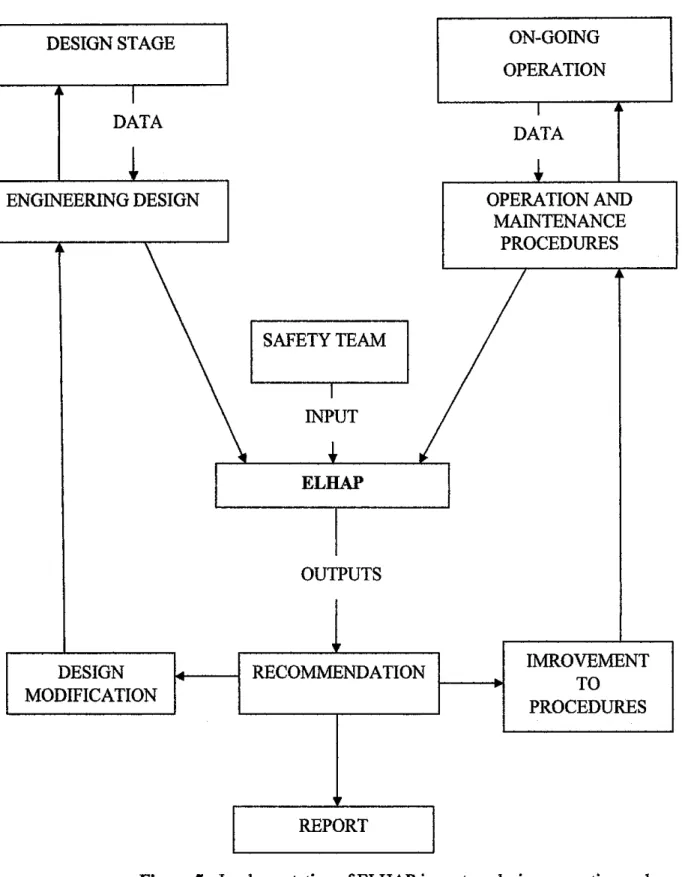
Figure 5 shows the suggested implementation inputs and outputs of the ELHAP. At the end of the study, ELHAP will provide suggestion to improve the system design, operation and maintenance procedures to optimize the safety and operability in the overall plant.
DESIGN STAGE ON-GOING OPERATION I
DATA I
DATA
! +
ENGINEERING DESIGN OPERATION AND
MAINTENANCE PROCEDURES
I
SAFETY TEAM II
INPUT
+
ELHAP
OUTPUTS
DESIGN RECOMMENDATION IMROVEMENT
MODIFICATION TO
PROCEDURES
REPORT
Figure 5: Implementation ofELHAP in system design, operation and maintenance procedures for new system design and on- going plant operation.
3.4 SAFETY TEAM
For an effective analysis, ELHAP requires involvement of group of experts in safety and electrical system since it is a team approach tool similar to HAZOP analysis. The following members are the suggested persons to form a team for the analysis:
I. Team leader ii. Safety Officer
iii. Process plant operators
iv. Electrical maintenance engineer v. Electrical design engineer vi. Electrical technical manager
Vll. Others as required
3.5 PROCEDURES
Based on the HAZOP approach which introduces parameters and guidewords and also the FTA concept, the following method is the suggested framework for ELHAP study:
i. Specific component of interest is specified in the process and instrumentation diagram (P&ID) of the process plant. The single line diagram (SLD) is usually used to focus on specific design intent of the electrical operation.
ii. Possible hazards are indentified to determine the type of possible hazards related to the specified component in general. The following are the possible hazard keywords suggested for each of the component:
• Electrical shock
• Fire
• Explosion
• Physical Threat
• Toxicity
• System Failure
iii. Exposure situation is determined according to the specified hazard keyword to identify the general condition/situation of the hazards. For each type of hazard, the following exposure situation is suggested:
• Electrical shock - direct contact, indirect contact
• Fire -normal, chain reaction, lightning
• Explosion- chemical, mechanical, electrical
• Physical Threat- individual, surroundings
• Toxicity- chemical, biological, physical
• System Failure- no power, low power, malfunction
iv. Exposure elements in the form of guidewords are applied in this stage to analyze the causes of the problems. Guidewords suggested consists of the following keywords related to the operation of the electrical equipments:
• IDENTIFY
• OPERATE
• CONTROL
• DISPLAY
• MAINTAIN
• FUNCTION
v. Deviation from normal operation is determined according to the selected guidewords. For each of the operation parameter, the following deviation is suggested:
• IDENTIFY- Fail to identify, false identification
• OPERATE- Fail to operate, fail to open, fail to close, fail to isolate
• CONTROL- Fail to control, false control
• DISPLAY- Fail to display, false display
• MAINTAIN -Failto maintain
• FUNCTION- Fail to function
v1. Detailed causes of the hazards are determined according to the specified deviation.
vii. Consequences of the hazards are determined.
viii. If the consequences are significant, FT A probability calculation method is used to rank the hazards to make sure the highest risk hazard can be prioritized followed by the second highest, etc.
ix. Suitable recommendations will be suggested for further actions.
The procedure suggested above is simplified in the flow chart as shown in Figure 6.
The detail definition for each of the tenns (hazard keywords, exposure situation, guide words, etc) used in the procedure above can be found in the Appendix B.
I
STARTl
!
SELECT COMPONENT/SLD
!
IDENTIFY HAZARD KEYWORDS
~
IDENTIFY
EXPOSURE SITUATIONS
l
I I
DETERMINE Apply
DEVIATIONS
•
GUIDEWORDS~.
IDENTIFY CAUSES
!
PREDICT CONSEQUENCES
Major YES
Accidents?
..
PERFORMFTA
NO
..
RECOMMEND HAZARD
ACTIONS RANKING
!
RECORD
~.
REPEAT FOR ALL EXPOSURE SITUATIONS
l
REPEAT FOR ALL HAZARD KEYWORDS
•
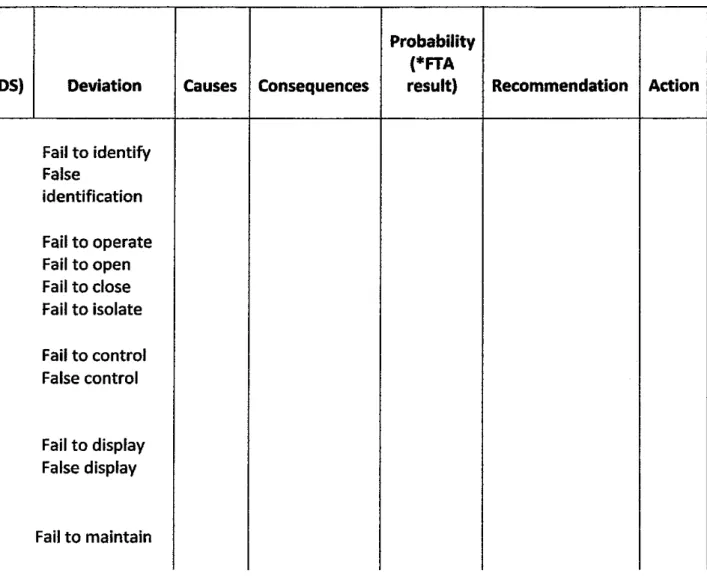
The infonnation gathered during the procedure above can be recorded in a table as suggested in Table 2. The Fault Tree Analysis will be perfonned only if the consequences are very significant in which it gives major impact to the system design or plant operation. It will be discussed further in the following Section 3.6.
Table 2: Suggested table for ELHAP study
Exposure Probability
Hazard Exposure Elements (*FTA
Item Keyword Situation (GUIDEWORDS) Deviation Causes Consequences result) Recommendation Action Electrical
Shock Direct contact IDENTIFY Fail to identify False
Indirect contact identification
Fire Normal OPERATE Fail to operate
Chain reaction Fail to open
lightning Fail to close
Fail to isolate Explosion Chemical
Mechanical CONTROl Fail to control
Electrical False control
Physical
Threat Individual DISPLAY Fail to display
Surroundings False display
Toxicity Chemical
Biological MAINTAIN Fail to maintain Physical
System No power FUNCTION Fail to function Failure Low power
Malfunction
*FTA result is in the form of probability of occurrences of each of the hazardous event ranging from 0 to 1.0. As the probability increases, the level of risk the hazard possesses increases.
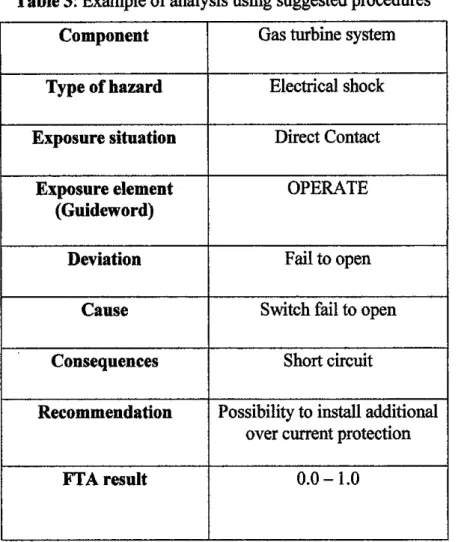
A simple example of the ELHAP analysis using the procedure as described in the Section 3.5 is as shown in Table 3 below. In this analysis, a component of the electrical system, in this case a gas turbine system is chosen as the subject.
Table 3: Example of analysis using suggested procedures
Component Gas turbine system
Type of hazard Electrical shock Exposure situation Direct Contact
Exposure element OPERATE
(Guideword)
Deviation Fail to open
Cause Switch fail to open
Consequences Short circuit
Recommendation Possibility to install additional over current protection
FTA result 0.0-1.0
3.6 FAULT TREE ANALYSIS (FTA)METHOD
3.6.1 FTA Procedures
In the ELHAP analysis, Fault Tree Analysis (FTA) method will be implemented to rank the hazardous events if the events possess significant consequences and they can be considered as major events. The significant consequences here may include:
i. Events which are considered very dangerous to the personnel operating the machines or equipments during the operation where they may cause major injuries or in the worst case scenario; fatality to the personnel.
ii. Events which contribute to considerable amount of loss to the plant operation, or to the company in general in term of money, or other resources.
Hazard ranking is required to rearrange all of the events with very significant consequences according to their probability and eventually to prioritize the event at which its consequences are more significant among all other events. The following are suggested procedures to rank the hazardous events accordingly based on FTA method:
iii. The top event or the hazardous event which is identified from the previous methodology is determined
iv. Possible faults or causes that must occur for the top event to occur are listed by branching down the top event to the smaller sub-events.
v. During this branching procedure, sequential, parallel or combinations of sub- events are considered to make the analysis as accurate as possible. This can be done by using standard fault tree symbols. In this project, only "AND" and
"OR" gates are used since they are widely used to represent the causes for each of the event.
vi. Boolean algebra is used to quantify fault tree with event probabilities in order to determine the top event probability.
vii. Event with highest probability ranks first, and it must be prioritized when actions are being taken to mitigate the hazard.
3.6.2 Probability Calculation
Before proceeding with the top event probability, the probability value of each of the basic event is calculated by using the following equation:
(3.1)
P = Probability
ll = Failure rate (assumed constant), as t -> oo the reliability goes to 1 ( faults/1 06 h)
t =time (106 h)
[14]
As discussed before in the Section 2.5.4, the failure rate data can be determined either from manufacturer or from failure rata data handbooks. Failure rate data collected from various established sources for some selected electrical equipments together with their respective values of probability can be found in Appendix D.
3.6.3 Boolean algebra
Once the Fault Tree diagram has been developed, Boolean equations can be derived to evaluate the probability estimates for the sub-events. Combination of the sub- events probabilities will give the probability for top event. In this project, focuses will be made on "OR" and "AND" gates. The probabilities of the sub-events involving "OR" gates simply acts in additive manners while the probability of the sub-events involving AND gates will act in multiplicative manner. The basic formula for "OR" and "AND" gate cases are as follow:
p
P=Pl xP2 (3.2)
PI P2 p
I
p = 1-(1-Pl)(l-P2) (3.3)Pl P2
For more complex tree diagram, in the case an event is connected to its causal events by an AND gate, the probability of its occurrence is given by the relationship:
n
P=TI P(Ei) i = 1
(3.4)
For a case where all the events are connected to an event via an OR gate, the probability of the event is given by the relationship:
Where
n
P=TI [1-P(Ei)]
i = 1 (3.5)
P =the probability of occurrence of the event innnediately above the AND or OR gate
P (Ei) =probability of occurrence of events immediately below the AND or OR gate
n = the number of events immediately below the OR gate
n
=the symbol for multiplication(15]
The complete guide for Boolean algebra for Fault Tree Analysis can be referred to in Appendix C. In this guide, formulas to determine probability involving combinations of both "AND" and "OR" gates in various situations are shown.
CHAPTER4
RESULT AND DISCUSSION
4.1 INDUSTRIAL CASE STUDY
Implementation in industrial case study is very important to make sure that the framework developed is not just theoretically sound but it is also practical for real life applications. The location for the main industrial case study has been chosen to be at the Lumut Power Plant (LPP) in Lumut, Perak. The reason for selection of Lumut Power Plant as the location for industrial case study is because:
1. Lumut Power Plant is located nearby, thus it is easier for the research to be done at anytime during the commencement of the semester.
ii. The focus of this study is specifically more onto electrical system, thus it is great if it is done directly at the electrical power system before doing direct implementation at electrical system in process plant.
Based on the procedures discussed in Chapter 3, an industrial case study will be implemented at Lumut Power Plant. For this purpose, the single line diagrams for the whole plant and gas turbine have been obtained from the power plant. Please refer to Appendix E for the single line diagram of the whole plant.
Additional case study was done for the 11 OV Alternate Current Uninterruptible Power Supply (AC UPS) at PETRONAS Fertilizer Kedah Sendirian Berhad (PFKSB) to further test the suitability of the ELHAP assessment. Please refer to Appendix G for the single line diagrams of the AC UPS system.
4.2 LPP ffiGH VOLTAGE GAS TURBINE SYNCHRONIZATION STEPS
4.2.1 Gas turbine system
Gas turbine system is one part of the power plant system in Lumut Power Plant.
Please refer to Appendix F for the gas turbine single line diagram. A gas turbine also known as combustion turbine is a rotary engine that extracts energy from a flow of combustion gas. It has an upstream compressor coupled to a downstream turbine, and a combustion chamber in-between.
According to Lumut Power Plant safety guidelines, high voltage apparatus include any equipment and conductors which are normally operated at a voltage of 15.75 kV and above. High voltage synchronization steps involve a series of high voltage switching. High voltage switching is defined as operation of high voltage switchgears, isolators or other methods of making or breaking a circuit. If a high voltage circuit can be energized or reenergized by means of low voltage equipment, such energizing or reenergizing shall be regarded as high voltage switching [16].
4.2.2 Safety clearan£es from live £onductors
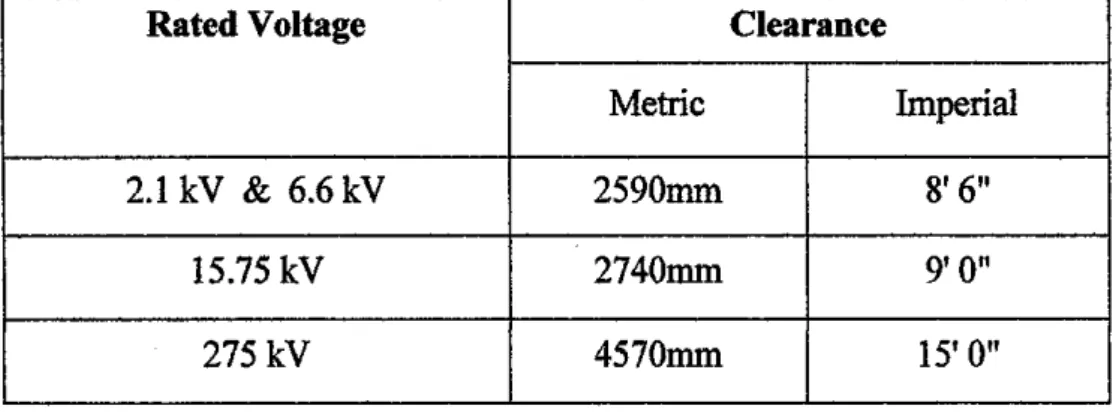
When work is to be carried out in the vicinity of any exposed high voltage conductor which is or can be made live, the section which is made dead for work to be carried out shall be defined as far as possible by the use of approved barriers or approved roping arrangements. The minimum clearance from such exposed conductor to ground level or platform or access way shall be as given in the Table 4 below:
Table 4: Minimum clearance from exposed conductor for different voltage
Rated Voltage Clearance
Metric Imperial
2.1 kV & 6.6 kV 2590mm 8'6"
15.75 kV 2740mm 9'0"
275kV 4570mm 15'0"
4.2.3 Isolation step
The following are the isolation steps that need to be obeyed before the synchronization steps or other testing take place:
a) Equipment shall be made dead by opening the appropriate circuit breakers and Isolators links.
b) Isolation shall be obtained by opening Isolators or links, or racking out circuit breakers or removing fuses. Where appropriate, air isolation together with positive action to ensure that the closing mechanism is inoperative, will be acceptable instead.
c) Neutral point connections which may be subject to a rise of potential shall be as in paragraph (a) above if deemed required by the electrical competent person
d) Possible back feeds from the Low Voltage sides of power transformers, voltage transformers or auxiliary transformers shall be removed by isolating the Low' Voltage sides of the transformers, as in paragraph (a) and/or (b) above.
4.2.4 Synchronization steps
Based on the guidelines given, the high voltage gas turbine synchronization steps involve pre-condition step and high voltage switching step as follow:
4.2.4.1 Pre Condition
i. Equipment in open status- S38,S30,S34,W36,W30,W34,S48,S40,S44 ii. M3 De-energized
iii. R3 Energized GT3l,GT32,GT33,Ayer Tawar 4 iv. GT31 back feed via R3-M96-M90-M93
4.2.4.2 Switching Steps
1. GT31 is running and already synchronized through R3 at operating watt via circuit breaker.
ii. Open M90 by DCS command and GT31 stay idle iii. Open M90 > Open M96 > Close M94
rv. Black sync M90 via M94 to dead M3 bus> Completed
v. Open M90 by power plant> Close W36 > Close W34 > Close W30 energized M3 with TNB power
vi. HV sync M90 through M94 to M3 vii. Complete HV CB sync
4.2.5 ELHAP Analysis
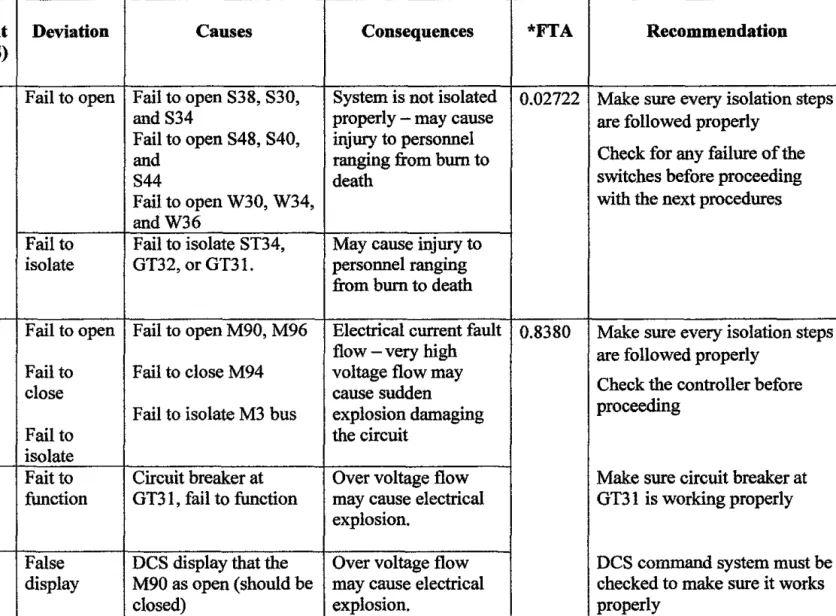
Based on the procedures developed in Section 3.5, the following table, Table 5 can be constructed for the gas turbine system. This table has been developed according to the suggested hazard keywords, exposure situations, guidewords, and associated deviations as shown in Table 2. Three major hazards are identified in this case study.
The FT A results in the Table 5 are obtained using previously explained method in Section 3.6. The details of the FTA analysis for both hazards are as shown in
Figure 7 and Figure 8, respectively.
Table 5: ELHAP analysis for gas turbine synchronization system
Type of Exposure Exposure element Deviation Causes Consequences *FTA Recommendation hazard situation (GUIDEWORDS)
Electrical Direct OPERATE Fail to open Fail to open S38, S30, System is not isolated 0.02722 Make sure every isolation steps
shock contact and S34 properly - may cause are followed properly
Fail to open S48, S40, injury to personnel
Check for any failure of the
and ranging from burn to
S44 death switches before proceeding
Fail to open W30, W34, with the next procedures
and W36
Fail to Fail to isolate ST34, May cause injury to isolate GT32, or GT31. personnel ranging
from burn to death
Explosion Electrical OPERATE Fail to open Fail to open M90, M96 Electrical current fault 0.8380 Make sure every isolation steps flow -very high are followed properly
Fail to Fail to close M94 voltage flow may
Check the controller before
close cause sudden
Fail to isolate M3 bus explosion damaging proceeding
Fail to the circuit
isolate
FUNCTION Fait to Circuit breaker at Over voltage flow Make sure circuit breaker at function GT31, fail to function may cause electrical GT31 is working properly
explosion.
DISPLAY False DCS display that the Over voltage flow DCS command system must be
display M90 as open (should be may cause electrical checked to make sure it works
closed) explosion. properly
System No power MAINTAIN Fail to Fail to maintain all Gas turbine Make sure to maintain
Failure maintain required power supply synchronization steps adequate power supply from
from TNB power cannot be completed TNB power generation station generation station
Low MAINTAIN Fail to Fail to maintain Gas turbine Make sure to maintain
power maintain adequate power supply synchronization steps adequate power supply from
from TNB power cannot be completed TNB power generation station
- - - - - - - _generation station ---- - -
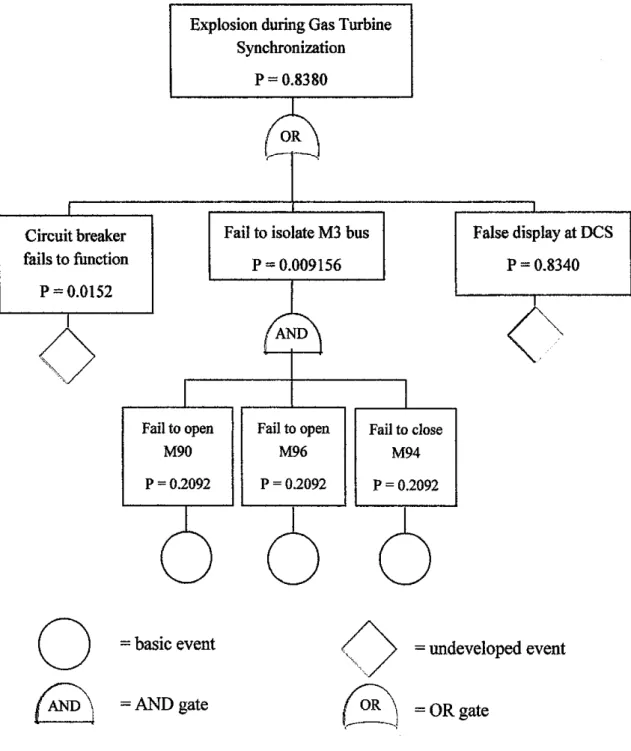
4.2.6 FTA Method
The fault tree analysis diagram can be developed to track all of the sub-events or faults that may contribute to occurrences of the major hazard identified in the gas turbine system. The failure rate data of the basic events and its associated probability offailure are taken from Appendix D. The Fault Tree Analysis is conducted only for event that produces acceptable amount of risks or consequences, in this case, the electrical shock and explosion. Fault Tree Analysis diagrams for electrical shock and explosion hazard in gas turbine are as shown in Figure 7 and Figure 8, respectively.
Figure 7 show that the probability of electrical shock in the gas turbine system is calculated to be 0.02722; while Figure 8 shows that the probability of the explosion in the gas turbine system is 0.8380. It shows that the probability of explosion in the gas turbine system is very high, and the recommended action must be taken into consideration more seriously before starting any operation related to the gas turbine system.
1il to open S38 '=0.2092
Electrical Shock during Gas Turbine Synchronization
Fail to isolate ST34 p = 0.009156
Fail to open S30 p = 0.2092
Fail to open S34 p = 0.2092
Fail to open W30 p = 0.2092
0
= basic eventB
=AND gateP=0.02722
Fail to isolate GT31 p = 0.009156
Fail to open W34 p =0.2092
6
8
Fail to open S38 P= 0.2092
Fail to open W36 P=0.2092
6
=OR gate
Fail to isolate GT32 P= 0.009156
Fail to open S30
p = 0.2092
Fail to open S34
p = 0.2092
Figure 7: FTA analysis for the electrical shock hazard in the gas turbine system
Explosion during Gas Turbine Synchronization
P= 0.8380
Circuit breaker fails to function
Fail to isolate M3 bus P=0.009156
False display at DCS P=0.8340 P=O.Ol52
0
0
@
Fail to open M90 p =0.2092
= basic event
=AND gate
Fail to open M96 p = 0.2092
Fail to close M94 p = 0.2092
0
= undeveloped event.
~
=OR gateFigure 8: FTA analysis for the explosion hazard in the gas turbine system
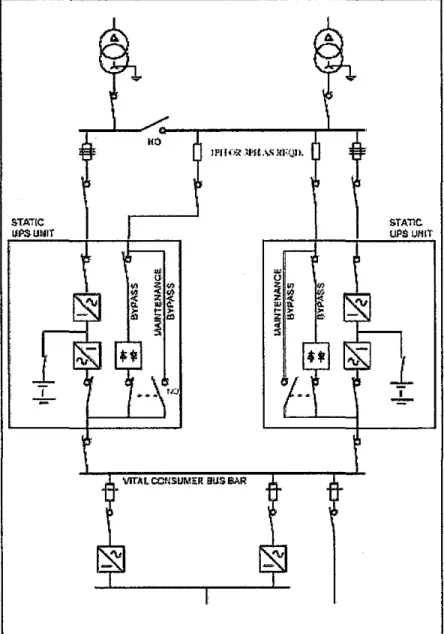
4.3 PFKSB llOV ALTERNATING CURRENT UNINTERRUPTIDLE POWER SUPPLY (AC UPS)
llOV AC UPS units comprises of rectifier, inverter, by-pass system and stand-by battery for the installation. The following Figure 9 shows typical arrangement layout- Parallel Operation extract of AC UPS from PETRONAS Technical Standard (PTS). Detail drawing is as shown in Appendix G. General design consideration and operating conditions for the AC UPS system are shown in Appendix H.
STATlC
uPSuwrr
VITAL CCNSUM?::R
l!'IICJ:l' _tJ•U.\.'ii RFQH.
1. IF REQUIRED. TRidiSFORVERS 'TO e.E lNC\..tJOED IN BYP.ISS Cl~CUITS.
2 . .l<J..L SWITCHES Cl.OSEO UHLESS S'l'ATEOOT~ERWS£..
Figure 9: Typical arrangement of AC UPS system
STATIC
4.3.1 ELHAP Analysis
The following Table 6 shows ELHAP Assessment for the Alternating Current Uninterruptible Power Supply (AC UPS) at PFKSB. The major hazard identified during the operation of the AC UPS is electrical shock during maintenance procedures and system failure during the operation.
4.3.2 FTA Analysis
For this case study, both events contributes to considerable amount of risk since electrical shock may cause injury (or death) to personnel, while system failure may cause shutting down of operation, which will consequently affect the overall plant operation. This may cause considerable amount of losses to the company since the plant need to be operated continuously most of the time to cater for the product demand. The fault tree (FTA) analysis for the AC UPS system is as show in Figure 10 and Figure 11 respectively. The failure rate data of the basic events and its associated probability of failure are taken from Appendix D. The FTA results show that the recommended steps that may reduce or eliminate the system failure event must be prioritized due to its higher probability of occurrences than the electrical shock hazard.
The higher the probability of occurrences for a particular top event or hazard in the system, the higher it ranks among the hazards identified. By doing the probability calculation, hazard with high likelihood to occur can be prioritized, followed by less risky hazards. If the system design or the operating and maintenance procedures are to be improved, more focus must be given to the improvement related to prevention of hazard with highest probability first.
Table 6: ELHAP analysis for the AC UPS system
Type of Exposure Exposure element Deviation Causes Consequences FTA Recommendation
hazard situation (GUIDEWORDS)
Electrical Direct OPERATE Fail to open Fail to open switch at System is not isolated 0.08593 Make sure every isolation steps
shock contact maintenance by pass properly- may cause for maintenance procedures are
line injury to personnel followed properly
ranging from burn to
Check for any failure of the Fail to open switch at death
static by-pass line switches before proceeding
May cause injury to with the next procedures Fail to Fail to isolate Static
isolate UPS unit 1, and Static personnel ranging
UPS unit2 from burn to death
System Malfunction FUNCTION Fail to Rectifier, inverter fail to System fail to operate 0.3002 Make sure to use equipments
Failure function function properly may result in that follow the standards, check
shutting down of for equipment failure regularly.
Fuse fail to function operation
No/Low MAINTAIN Fail to Fail to maintain System fail to operate Make sure to maintain
power maintain adequate power supply properly may result in adequate power supply from
from the AC input shutting down of AC input
operation
FUNCTION Fail to Backup Ni-Cd Battery Make sure the battery fulfills
'
operate fail to function/ standard requirement, check the
disconnected batt~ regularly
Electrical Shock during maintenance at AC UPS
Fail to isolate Static UPS Unit 1
P=0.04393
Fail to open switch at maintenance bypass
line I
Fail to open switch at static bypass line I
p = 0.2092 P=0.2092
0
=basic event(ANDj
=AND gatep = 0.08593
Fail to isolate Static UPS Unit 2
P=0.04393
Fail to open switch at maintenance bypass
line 2 P=0.2092
Fail to open switch at static bypass line 2
p =0.2092
Figure 10: FTA analysis for the electrical shock hazard at AC UPS System
Rectifier fails to
function P=0.0093
/
System Failure at AC UPS System
p = 0.3002
Fail to supply adequate power
P= 0.002405
OR
Fuse fails to function P= 0.0055
No power output from AC input
Battery fail to operate/disconnected
P=0.0219 p =0.0022
6
Inverter fails to function p = 0.2223
0
= basic event(>
= undeveloped eventB
=AND gate~
=OR gateFigure 11: FT A analysis for tbe system failure at AC UPS system
4.4 COMPARISON WITH OTHER TOOLS
There are established indices which can be used for systematically identifying hazards and providing a method of ranking priorities in a chemical plant. Three most widely used indices are the Dow Fire and Explosion Index (F&EI), the Mond Index, and the Instantaneous Fractional Annual Loss (IFAL) Index (10]. The following Table 7 shows the side by side