perkasa sarawak timber industry development corporation
october-december 2010 quarterly newsletter
Technological advancement had resulted in the transformation of wood residues into a new economic activity
nothing goes to
waste
STIDCwebsite:
www.sarawaktimber.org.my
SARAWAK TIMBER INDUSTRY DEVELOPMENT CORPORATION (STIDC) Wisma Sumber Alam, Jalan Stadium, Petra Jaya,
93050 Kuching,
P.O.Box 194, 93702 Kuching, Sarawak, Malaysia.
Tel: 6082-473000 Fax: 6082-442691 E-mail: [email protected]
PERKASA quarterly newsletter is published by Sarawak Timber Industry Development Corporation (STIDC). All rights reserved. No part of this publication may be reproduced in any form without prior consent of the Publisher.
The title “PERKASA”, its logo and contents remain the property of the Publisher. Opinions expressed by advertiser are not necessarily of the Publisher or Editor ADVISOR Datu Haji Sarudu Haji Hoklai General Manager
CHIEF EDITOR Tuan Haji Hashim Haji Bojet Deputy General Manager
EDITOR Sharifah Norolah Binti Wan Ahmad Corporate Affairs Manager
WRITER Norman Botes Noma MARKET PERFORMANCE / TRADE STATISTICS Ermi Fariza Rambli EDITORIAL TEAM
Editorial
03 2010 another eventful year for STIDC
News
04 Excellent Service Award 05 Integrity Day
08 TMR Continued To Shine
09 STIDC Asspires To Win 5S Competition 10 1 Million Ha. Of Planted Forest By 2020 11 Keen Interest In Tanjung Manis Halal Hub 13 Carbon Footprint
Feature
06 Nothing Goes To Waste
Market Performance
15 January to September 2010
Trade Statistics, Sarawak
18 January to September 2010 | January to September 2009
contents
editorial
2
010 is another eventful year for STIDC. This year’s chapter began with the coming of Datu Haji Sarudu Haji Hoklai as our new general manager. With his 30 years experience in the civil service, we are fortunate to have him at the helm in playing our role as the leader and catalyst of the timber industry in Sarawak.As usual in March and April, we
participated in international events namely The Malaysian International Furniture Fair 2010 and the Export Furniture Exhibition 2010 in Kuala Lumpur as well as The Dubai Wood show 2010. Our participation in these shows among others aimed to keep abreast with the current trends in furniture designing and to further explore market opportunities.
We also never failed to observe the annual World Forestry Day to remind ourselves of the importance of forests in our lives.
Officiated by our Chairman and Minister of Planning and Resource Management II and Minister of Public Utilities, the Honorable Datuk Amar Haji Awang Tengah Ali Hassan, this year’s celebration was held on 28th April in Lawas Division with a theme “Love The Forest-Sustained Heritage”.
In the effort to inform the industry on the latest market developments, we had also organized several Timber Industry Updates.
Four papers were presented namely
“Sarawak-Chain-of-Custody”, “Online Customer Satisfactory Survey”, “Procedure of Importing Logs and Sawn-Timber” and
“Electronic Industrial Production Return (e-IPR)”. This was followed by a briefing on Anti-Dumping of Malaysian Plywood which covered topics on “Anti-Dumping Action”, “Trade Remedies Under WTO”
and “Anti-Dumping Cases”.
In July, STIDC also participated in Sarawak Investment Symposium in London and the Inaugural Global Islamic Branding and Marketing Forum in Oxford. Its participation was timely and augurs well with the state government’s aspiration to develop Tanjung Manis Halal Hub. This halal hub is a component of Sarawak Corridor of Renewable Energy (SCORE) in which STIDC plays an important role in providing the infrastructure besides overseeing the overall implementation of this project and ensuring its success.
Towards the end of the year, two important events took place namely the Integrity Day and 5S Compliance Audit.
While the former was aimed at imparting good values among the staff, the later was held to acculturate 5S (Sort, Set in Order, Shine, Standardize and Sustain) concept at workplaces.
EXCELLENT
SERVICE AWARD
Recipients should become role model
He elaborated that the civil service is becoming more challenging and warrants total commitment among the workers in enhancing the delivery system and in meeting the customers’ demand. This could be achieved by undertaking the task timely and meticulously and be ready to go extra miles to attain world-class delivery system.
“Ever since I took over the helm of STIDC I noticed that the staff are always proactive in enhancing the delivery system for customers’ satisfaction. Besides, they are receptive to changes. Subsequently, STIDC had successfully improved its services via ICT application such as e-Permit, e-Regnet, e-Grading and e-IPR. This had benefited STIDC and the timber industry through effective two-way communication” Datu Haji Sarudu said.
A
joint excellent service award 2009 presentation ceremony was held for the Ministry of Planning and Resource Management and STIDC on 2nd December 2010. Held at a leading hotel in Kuching, Sarawak, the auspicious ceremony was graced by the Honourable Datuk Amar Haji Awang Tengah Ali Hassan, Minister of Planning and Resource Management II cum Minister of Public Utilities and STIDC Chairman.In his welcoming address, STIDC General Manager, Datu Haji Sarudu said the award reflected the government’s recognition and appreciation of the staff outstanding performance. He hoped that the recipients would become the role model among their colleagues and emphasized that the award should inspire and motivate them to enhance their performance.
SUMMARY
UÊÊ ÝViiÌÊ-iÀÛViÊÜ>À`ÊÀiyiVÌi`Ê the government’s recognition and appreciation of the staff outstanding performance.
UÊ ÌÊÃÊ «i`ÊÌ >ÌÊÌ iÊÀiV«iÌÃÊ would become the role model among their colleagues.
UÊ ÛÊÃiÀÛViÊÃÊLiV}ÊÀiÊ challenging and warrants total commitment among the workers in enhancing the delivery system and in meeting the customers’ demand.
“The Government views performance seriously. As such,
the staff must strive to enhance their performance and productivity
continuously. May the excellent service award be the impetus for everyone to be more competitive,
creative and innovative in the effort to achieve world-class civil
service”.
- Datu Haji Sarudu Haji Hoklai, STIDC General Manager -
t The award receipients posing with the Honourable Datuk Amar Haji Awang Tengah (9th right). Also seen are STIDC board member and Ministry of Planning and Resource Management Parmanent Secretary, Datu Wan Alwi Bin Dato’ Sri Wan Hashim (8th right), STIDC General Manager, Datu Haji Sarudu (7th left) and STIDC Deputy General Manager, Tuan Haji Hashim Haji Bojet (6th left).
INTEGRITY DAY
Integrity is the key to customers’ satisfaction
I
ntegrity is the key to customers’satisfaction. It warrants serious attention from across the board of all sectors.
Guiding by this principle, STIDC is taking a holistic approach in ensuring that its services are up to customers’ expectation.
Integrity Day is observed annually to remind the staff on the importance of integrity in executing their daily duties and responsibilities. This year’s Integrity Day was held on 4th October 2010 at Wisma Sumber Alam, Kuching, Sarawak.
The event was graced by the Honorable Datuk Amar Haji Awang Tengah Ali Hassan, Minister of Planning and Resource Management II cum Minister of Public Utilities and STIDC Chairman.
According to the Minister, STIDC initiative in organizing the annual Integrity Day is in line with the government’s effort in promoting integrity among the workforce.
It is also in harmony with the “People First Performance Now” concept.
Towards that end, The Corporation had initiated a concrete master plan to enhance its delivery system. Subsequently, some of its core activities had been computerised such as e-Permit, e-Regnet, e-IPR, and e-Grading. This has led to significant improvement in terms of decision making, information sharing as well as in meeting customers’ needs.
SUMMARY
UÊÊ Ìi}ÀÌÞÊÃÊÌ iÊiÞÊÌÊVÕÃÌiÀÃ½Ê satisfaction.
UÊ -/ÊÌ>ÌÛiÊÊÀ}>â}ÊÌ iÊ annual Integrity Day is in line with the government’s effort in promoting integrity among the workforce.
UÊ -/Ê >`ÊÌ>Ìi`Ê>ÊVVÀiÌiÊ>ÃÌiÀÊ plan to enhance its delivery system.
“With strong leadership and commitment among the staff, I am confident that STIDC would continue to enhance its delivery
system in accordance with customers’ needs. STIDC has a good track record, thus I believe it
will do better in future”
- The Honorable Datuk Amar Haji Awang Tengah Ali Hassan, Minister of
Planning and Resource Management II cum Minister of Public Utilities and STIDC
Chairman - t The Honourable Datuk Amar Haji Awang Tengah (left) taking a close look at the timber samples displayed at the exhibition.
t STIDC General Manager, Datu Haji Sarudu (2nd left) briefing the Hanourable Datuk Amar Haji Awang Tengah (left) on the Tanjung Manis Halal Hub Master Plan during his visit to the exhibition in conjunction with the Integrity Day.
STIDC being the leader and catalyst of the timber industry in Sarawak is committed to ensuring good governance in this sector. This could be realized by innovating procedures and work processes as well as by encouraging receptiveness to changes in order to remain relevant.
Good governance is undoubtedly critical in developing excellence culture. It is therefore vital for every organization including STIDC to appreciate this concept so as to instill noble value among the workforce to become good citizens. This will benefit not only the organization but also the country as a whole.
It is hoped that everyone would continue to put this concept into practice to project positive image of an organization as well as to gain greater customers’ confidence.
G
one are the days when wood residues were thrown as waste.Technological advancement had resulted in the transformation of wood residues which used to be the cause for environmental concern into a new economic activity.
In Sarawak woodchips production is among the new economic activities using wood residues. Woodchips are small pieces of wood which have been created by running wood through a shredder, breaking it into uniformly sized chips.
The precise size of woodchips varies depending on the type of wood and the wood chipper used to create the chips.
Usually woodchips are created as a by- product of timber processing, with small branches, off cuttings and other debris
NOTHING GOES TO WASTE
Technological advancement had resulted in the transformation of wood residues into a new economic activity
being run through a wood chipper to make woodchips as a way of compacting tree waste. Woodchips can also be made from larger pieces of wood, assuming that those pieces of wood have no other uses.
One common use for wood chips is as a ground cover. A thick layer of woodchips will keep weeds from breaking through and help to retain the soil. Woodchips are often used in playgrounds, where gravel would be harsh in the event of falls and grass would be unlikely to last long. Some gardeners also use woodchips as mulch, spreading chips out between their plants to keep grass and weeds down to give the garden a smooth, uniform look.
Many woodchips wind up being pulped for paper and sometimes they are used to fuel furnaces, boilers, and electrical generation
t Pellets are among the by- products of woodchips.
equipment at sawmills. Specialty woodchips made from woods like hickory and oak may be sold in kitchen supply stores for people to use in smoking, grilling, and barbecuing.
These aromatic woodchips can be soaked in water and tossed on the fire where they will smolder slowly, releasing scented smoke which infuses the food being cooked over the fire.
For the purpose of landscaping or gardening woodchips can be obtained from a garden supply store, either in sacks or truckloads. In some regions, cities dispense woodchips by request, although the city’s chips may be inferior to commercially produced versions, since they are usually made from old scrap wood which comes from city maintenance projects. Specialty woodchips for cooking can be found in various markets and suppliers of cooking utensils, and they can also be ordered from companies which specialize in grilling and smoking equipment.
Presently, there are six wood chip companies in Sarawak namely Tanjung Manis Resources Sendirian Berhad, Daiken Sarawak Sendirian Berhad, Mega Scope Berhad, Moduboard Sendirian Berhad, Prospect Effective Sendirian Berhad and Champion Dynasty Sendirian Berhad.
These companies produced 203,500 tones of wood chips in 2009 while the production volume from January to October 2010 was 287,500 tones.
While Tanjung Manis Resources Sendirian Berhad caters for the Japanese market, the remainder companies serve the local wood-based companies who use woodchips for manufacturing particleboard, blockboard and MDF.
Besides complementing the related industries, these woodchip companies play an important role in realizing the government’s objective to optimize the utilization of forest resources. This is also in support of the government’s initiative to inculcate a sense of environmental friendliness among industry players.
SUMMARY
UÊ Ê->À>Ü>ÊÜ`V «ÃÊ production is among the new economic activities using wood residues.
UÊ 7`V «ÊV«>iÃÊ play an important role in realizing the government’s objective to optimize the utilization of forest resources.
-PBEJOHPGXPPEDIJQTJOQSPHSFTTt
"DMPTFWJFXPGXPPEDIJQTt
3BXNBUFSJBMTGPSXPPEDIJQTNBOVGBDUVSJOHt
t 5.3.BOBHJOH%JSFDUPSMr. Ling Chong Kiong (4th right) receiving the Sarawak State Entrepreneurial of the Year Award 2010 from Datuk Patinggi Tan Sri Dr.
George Chan Hong Nam (2nd right)
continued to generate significant income and contributed towards the overall development of the State’s wood-based industry.
The success of TMR has been a
challenging but rewarding journey. With rapid growth it continued to gained momentum in the international market.
It has also won several awards such as the Export Excellent Award from 2005 to 2007 and Star Company in Malaysia Independence Award 1957 programme in 2009. TMR continued to shine and received the Sarawak State Entrepreneurial of the Year Awards 2010 from Datuk Patinggi Tan Sri Dr. George Chan Hong Nam, Deputy Chief Minister I cum Minister of Industrial Development and Minister of Tourism and Heritage, Sarawak on 12th November 2010.
TMR CONTINUED TO SHINE
Received Sarawak State Entrepreneurial of the Year Awards 2010
TMR business activities are in support of the government’s efforts to minimize environmental impact from the wood- based activities particularly along the Rajang River. Guiding by this principle, TMR is now venturing into the business of sawdust recycling for making charcoal briquette and wood pallet for bio-mass fuel consumption.
In addition, TMR has been involved in Acacia Tree-Planting Community Programme. Acacia seedlings were provided to the nearby villages such as Belawai, Jerijeh and Rejang.
In 2008, TMR obtained a license for Planted Forest to be established into forest plantation using fast growing and high yielding tree species such as Acacia and Kelampayang. These tree species have short rotation cycles of eight to ten years which would alleviate TMR’s dependency on natural forests and ensure sustainable forest management system.
SUMMARY
UÊ /,ÊVÌÕi`ÊÌÊ}iiÀ>ÌiÊ significant income and contributed towards the overall development of the State’s wood-based industry.
UÊ /,ÊVÌÕi`ÊÌÊÃ iÊ>`Ê received the Sarawak State Entrepreneurial of the Year Awards 2010.
UÊ /,ÊLÕÃiÃÃÊ>VÌÛÌiÃÊ>ÀiÊÊ support of the government’s efforts to minimize environmental impact.
T
anjong Manis Resources Sendirian Berhad (TMR), a subsidiary of STIDC was established in 1995 with the manufacturing of mixed-light-hard (MLH) and Acacia woodchips as its core business activities. While MLH woodchips are raw materials for making medium-density fiberboard (MDF), Acacia woodchips on the other hand are raw materials for the pulp and paper. The woodchips factory is situated at Tanjung Manis New Township taking advantage of the abundant supply of raw materials there.Over the years TMR has become one of the largest woodchips exporters in Malaysia. In 2004, it expanded its business to Acacia woodchips manufacturing for the Japanese pulp and paper industry. Being one of the major wood products exporters in Malaysia, it
STIDC ASSPIRES TO WIN 5S
COMPETITION
S
TIDC tireless efforts in adopting the 5S concept paid off when it passed the 5S Compliance Audit for the third consecutive year. The audit was conducted by The Malaysia Productivity Corporation (MPC) on 12th November 2010.5S Concept refers to a quality management system based on five Japanese words for “Seiri” (Sort), “Seiton”
(Set in order), “Seiso” (Shine), “Seiketsu”
(Standardize) and “Shitsuke” (Sustain).
It aims to promote systematic, clean and safe workplace in order to enhance performance, efficiency and productivity.
This is achieved by reducing defects, waste, delays, and injuries, thereby contributing to cost effectiveness and quality enhancement.
While commending the staff for their commitment in ensuring the success of the compliance audit, STIDC General Manager, Datu Haji Sarudu hoped that they would continue to adopt 5S concept as a culture.
This is in preparation for a national 5S competition for all organizations with 5S certification in both the public and private
Adopt 5S concept as a culture
sectors. The competition will be organized by MPC. Towards that end, Datu Haji Sarudu urged the staff to do their best in order to win the competition.
To acquire a deeper insight into 5S concept, STIDC had also participated in the State-level Quality Environment (5S) Convention in Kuching, Sarawak recently. The convention emphasized on transforming work culture through innovative and quality environment practices to enhance delivery of products and services. This augurs well with the aspiration to win the 5S competition.
SUMMARY
UÊ -/ÊÌÀiiÃÃÊivvÀÌÃÊÊ>`«Ì}Ê the 5S concept paid off when it passed the 5S Compliance Audit for the third consecutive year.
UÊ -/ÊiiÀ>Ê>>}iÀÊ «i`Ê that the staff would continue to adopt 5S concept as a culture.
UÊ -Ì>ÌiiÛiÊ+Õ>ÌÞÊÛÀiÌÊ (5S) Convention augurs well with STIDC’s aspiration to win the 5S competition.
t STIDC General Manager, Datu Haji Sarudu (right) receiving the 5S Certificate from MPC Senior Consultant, Mr.
Izani Bin Ishak (left) while STIDC Deputy General Manager, Tuan Haji Hashim Haji Bojet (centre) looks on.
t STIDC General Manager, Datu Haji Sarudu (right) visiting the STIDC exhibition booth in conjuction with the State-level Quality Environment (5S) Convention.
1 MILLION HA. OF
PLANTED FOREST BY 2020 To ensure sustainable supply
of raw materials for local processing as well as to minimise over dependency on natural forests
T
he excellence culture adopted by The Ministry of Planning and Resource Management and STIDC had contributed positively to Sarawak’s timber industry said the Honourable Datuk Amar Haji Awang Tengah Ali Hassan, Minister of Planning and Resource Management cum Minister of Public Utilities and STIDC Chairman. According to him, this was evident when the export revenue of timber and timber products grew by 15.6 percent to RM5.5 billion from January to September 2010 compared with RM4.75 billion during the corresponding period last year. The growth was attributed to increase in demand from the traditional markets like Japan, China, Taiwan, India, the USA and the Middle East.Meanwhile, the 2010 export revenue of timber and timber products is projected at RM7 billion if the demand remained stable until the end of the year. In view of this, the government will continue to take proactive steps to address current issues on trade rules and regulations, export procedures and product standards to further strengthen the markets globally.
On forest resources, the minister said the government aims to establish one million hectares of planted forests by 2020 with emphasis on fast growing tree species. This is to ensure sustainable supply of raw materials for local processing as well as to minimise over dependency on natural forests. The planted forest has an annual capacity of 15 million cubic meters.
In line with this, the government is actively promoting direct investment among the local and foreign companies to invest in the related industries such as pulp and paper, furniture, fibreboard and woodchips.
“As a result of sustainable forest management, the timber industry in Sarawak continues to enjoy
sustainable supply of raw materials from natural forests. In addition, this industry continues to be the
mainstay of the state’s economy”
- The Honourable Datuk Amar Haji Awang Tengah Ali Hassa, Ministry of Planning and Resource Management cum Minister of
Public Utilities and STIDC chairman -
SUMMARY
UÊÊ Ý«ÀÌÊÀiÛiÕiÊvÊÌLiÀÊ>`ÊÌLiÀÊ«À`ÕVÌÃÊ}ÀiÜÊ by 15.6 percent to RM5.5 billion from January to September 2010 compared with RM4.75 billion during the corresponding period last year.
UÊ Óä£äÊiÝ«ÀÌÊÀiÛiÕiÊvÊÌLiÀÊ>`ÊÌLiÀÊ«À`ÕVÌÃÊ is projected at RM7 billion.
UÊ ÛiÀiÌÊ>ÃÊÌÊiÃÌ>LÃ ÊiÊÊ iVÌ>ÀiÃÊ of planted forests by 2020 with emphasis on fast growing tree species.
t 0OFPGUIFGPSFTUQMBOUBUJPOTJO4BSBXBL
t 5SFFTFFEMJOHTBUBOVSTFSZ
KEEN INTEREST IN TANJUNG MANIS
HALAL HUB
Asean member countries showed keen interest to establish business networking and to come to Tanjung Manis to acquire first hand information on Tanjung Manis Halal Hub
S
TIDC is a state government agency tasked to oversee the overall development of Tanjung Manis Halal Hub. Parallel with this, the Corporation is concerting its efforts in ensuring the success of this project. On 20th - 24th October 2010, it participated in the 7th China-Asean Expo (CAEXPO 2010) in Nanning, Guangzi Zhuang, China together with Pertanza Sendirian Berhad.Pertanza Sendirian Berhad is among the local investing companies operating in this Halal Hub.
Dubbed as the largest international trade fair held in China, CAEXPO was an initiative of the People’s Government of Guangxi Shuang Autonomous Province.
It was credited as an effective platform to promote China-Asean cooperation in the areas of trade, investment and tourism in the light of the China-Asean Free Trade
Agreement which came into effect on 1st January 2010.
The five-day expo served as a platform to further promote Sarawak and Tanjung Manis Halal Hub on global stage particularly China and other Asean countries taking advantage of the immensed investment opportunities in Sarawak Corridor of Renewable Energy (SCORE). Tanjung Manis is among the five new growth nodes to be further developed under SCORE with emphasis on halal hub development.
Through this expo, feedback were also received on food quality, processing, import and export procedures and labeling particularly those related with China and Asean member countries.
STIDC had made full use of this platform to provide information on investment opportunities in Tanjung Manis Halal Hub
Tanjung Manis. The paper featured the background, facilities and infrastructures, participating agencies and organisations, economic and business opportunities, issues and challenges as well as the prospect of Tanjung Manis Halal Hub.
The 77,000 hectares halal hub is poised to lure at least RM9 billion worth of investments and create not less than 10,000 employment opportunities besides other spin-off benefits such as service related businesses. Hence, the development of this hub will surely bring significant positive impacts and improve the socio- economic well-being of the people in this area and Sarawak as a whole. This is in tandem with the increasing demand for halal products from both Muslim and non- Muslim markets globally.
The availability of communication and transport network in this township as well as the development of Tanjung Manis Halal Park is in line with the government’s objective to make Tanjung Manis the country’s halal hub of choice. Besides promoting the use of green technology and renewable energy, this Halal Park emphasizes on bio-technology and continuous Research and Development particularly in aquaculture.
This will pave the way for more local and foreign direct investments.
This halal hub will support among others, the aquaculture, poultry and egg production, livestock and meat production, fruit gardens, animal feed mills, eel farming industry as well as chlorella plant and tilapia hatchery.
Undoubtedly, this will help to boost the development of the neighboring areas.
SUMMARY
UÊ "ÛiÀÜ i}ÊÀiëÃiÊÜiÀiÊ received from the member countries to establish business networking and to come to Tanjung Manis in the near future to acquire first hand information on Tanjung Manis Halal Hub.
UÊ / iÊÇÇ]äääÊ iVÌ>ÀiÃÊ >>Ê ÕLÊÃÊ poised to lure at least RM9 billion worth of investments and create not less than 10,000 employment opportunities besides other spin- off benefits such as service related businesses.
UÊ / iÊ>Û>>LÌÞÊvÊVÕV>ÌÊ and transport network in this township as well as the development of Tanjung Manis Halal Park is in line with the government’s objective to make Tanjung Manis the country’s halal hub of choice.
in order to entice foreign investors to invest in this Halal Hub. Similarly, Pertanza Sendirian Berhad had fully utilized this avenue to promote its products such as Omega 3 Fish Crackers and Omega 3 BBQ Fish.
Overwhelming response were received from the member countries particularly China who showed keen interest to establish business networking with Pertanza Sendirian Berhad. Several Chinese investors had also indicated their interest to come to Tanjung Manis in the near future to acquire first hand information on Tanjung Manis Halal Hub.
As a whole, this expo had provided the participants with great exposure particularly in terms of customers’ needs and desires. It also provided the golden opportunities for participating countries to expand their business networking.
Besides promoting Tanjung Manis Halal Hub in CAEXPO 2010, STIDC had also participated in the Malaysian Halal Certification Awareness Seminar 2010.
The state level seminar was held on 25th November 2010 in Kuching, Sarawak.
STIDC Deputy General Manager, Tuan Haji Hashim Haji Bojet presented a paper on Investment and Business Opportunities in
t 0WFSXIFMNJOHSFTQPOTFSFDFJWFEGPS0NFHB'JTI$SBDLFST BOE0NFHB##2'JTI
CARBON
FOOTPRINT
Industry players must always comply with the dynamic product requirements imposed by consuming countries
S
arawak has developed and emerged as a major hub for plywood industry in Malaysia.Presently, there are 43 plywood mills in Sarawak producing diverse products such as general, floor, concrete, structural, marine, laminated veneer lumber, coated and decorative plywood. The annual production capacity now stands at 2.8 million cubic meters while the total direct employment opportunities generated by this sector is about 30,000.
In 2009, plywood contributed RM3.3 billion or 50% out of Sarawak’s total export earnings from timber and timber products. Japan being the largest consumer imported about 1.2 million cubic meters to RM1.6 billion or 46% of the total export volume. The other major markets were Korea (21%), Taiwan (9%), Yemen (5%), Hong Kong (3%), the Middle East, the USA, the Philippines and Europe.
The industry export performance for the first half of 2010 had shown an encouraging recovery with the total export volume improved by 24% from 1.18 million cubic meters in 2009 to 1.24 million cubic meters in 2010. Similarly, the export value had increased by 34% from RM1.46 billion in 2009 to 1.95 billion in 2010.
These statistics revealed that the plywood industry in Sarawak is a highly export orientated sector due to small domestic market. Therefore, it is imperative to remain at the competitive edge so as to sustain global market share. Towards that end, the industry players must always comply with the dynamic product requirements imposed by consuming countries.
Japan is currently conducting a carbon footprint on its wood-based sector. Once completed, it is expected that Japan would consider promoting carbon footprint labeling for timber products used in their market. In view of this, Ministry of Planning and Resource Management, Sarawak had requested STIDC to initiate this carbon footprint study for the timber industry in Sarawak. Initially, the study will focus on determining the carbon footprint of the plywood based on gate- to-gate concept. This study is conducted in collaboration with SIRIM, Sarawak Forestry Corporation Sendirian Berhad and Sarawak Timber Association. In this respect, direct involvement of the industry players is crucial by providing accurate input. STIDC will also form a Review Committee with relevant government agencies and industry representatives to give opinions and comments on the study report before a final document is produced.
CONGRATULATIONS
FAREWELL Heartiest Congratulation to:
Haji Wan Ahmad Lutfi Wan Zainal Abidin Mr. Jeman Udin
Mr. Jaddil @ Zaidel Ibrahim
For being awarded the Pingat Perkhidmatan Bakti (Perak) (PPB)
Mdm. Fatimawati binti Abang Abdul Latif Mdm. Salbiah Bolhassan
Mr. Abdul Japar bin Mohammed Mr. Alin bin Aleng
For being awarded the Pingat Perkhidmatan Terpuji (Gangsa) (PPT)
in conjuction with the 89
thbirthday of Head of State, His Excellency Tun Datuk Patinggi Abang Haji Muhammad Salahuddin on
16
thOctober 2010.
Farewell and good luck to Mr. Kuwa @ Matilee bin Rebi and Hajah Dayang
Maimunah binti Muzi who were on mandatory retirement after serving STIDC for
28 years and 37 years respectively.
Wishing you every success in your future endeavors.
The plywood industry stands to gain from this study in terms of:
1. Quantify average carbon
equivalent to produce plywood in Sarawak;
2. Industry benchmarking on carbon footprint;
3. Capacity building for the industry on carbon footprint;
4. Promoting “green image” of the industry; and 5. Continuous improvement in plywood production
technology.
It is therefore vital for the industry to give its fullest cooperation in ensuring the success of this study for mutual benefit.
Carbon footprint refers to:
UÊ 7i} Ìi`ÊÃÕÊvÊ}ÀiiÊ ÕÃiÊ}>ÃiÃÊ®Ê emissions and GHG removals of a process, a system of processes or a product system, that include carbon dioxide, methane, nitrous oxide and CFCs, summed up as CO2 equivalent.
UÊ ÃÃÃÊ«À`ÕVi`Ê`ÀiVÌÞÊÀÊ`ÀiVÌÞÊÛiÀÊ the life cycle of a product, material or service i.e. from cradle to grave including use phase in association with human activities.
Why Carbon Footprint (CFC)?
UÊ >ÀLÊvÌ«ÀÌÊ>LiÃÊ«ÀÛ`iÃÊÛÃÕ>â>ÌÊ encouraging companies to advertise to consumers their efforts to combat global warming, and educate consumers at the same time on CO2 emission
UÊ *ÀÌiÊÀi`ÕVÌÊvÊVÀ«À>ÌiÊ"2 emission throughout the supply chain
UÊ VVÕÀ>ÌiÊi>ÃÕÀiiÌÊvÊ"2 will support mechanisms or schemes that encourage reduction or compensation for CO2 emission such as CDM and Offsets.
SUMMARY
UÊ ->À>Ü>Ê >ÃÊ`iÛi«i`Ê>`ÊiiÀ}i`Ê>ÃÊ>Ê>ÀÊ hub for plywood industry in Malaysia.
UÊ ÊÓää]Ê«ÞÜ`ÊVÌÀLÕÌi`Ê,ΰÎÊLÊ or 50% out of Sarawak’s total export earnings from timber and timber products.
UÊ `ÕÃÌÀÞÊ«>ÞiÀÃÊÕÃÌÊ>Ü>ÞÃÊV«ÞÊÜÌ ÊÌ iÊ dynamic product requirements imposed by consuming countries.
market
performance
The demand from major market were picking up steadily such as plywood, logs and sawntimber by RM 3 billion, RM 1.5 billion and RM 0.6 billion respectively.
These contributed to 53%, 27% and 11%
to the total exported value of logs and timber products from the State for the first three quarter of 2010.
Logs
Volume of logs exported in January to September 2010 increased by 16% to 3 million m3 from 2.6 million m3 and the value also increased by 17% to RM 1.5 billion from RM 1.3 billion compared to the corresponding period 2009.
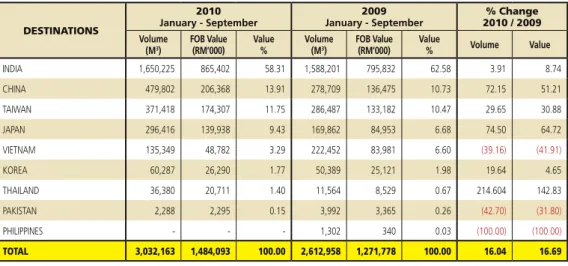
India maintained its position as the major purchaser of the State’s logs at 1.7 million m3 valued at RM 865 million followed by China (479,802 m3 valued at RM 206 million), Taiwan (371,418 m3 valued at RM 174 million) and Japan (296,416 m3 valued at RM 140 million).
Export of logs to India for the first three quarters 2010 up by 4% to 1.7 million m3 from 1.6 million m3 in comparison to the corresponding period of 2009 followed by China (72%), Taiwan (30%) and Japan (75%).
The major buyer of logs like India, China, Japan and Taiwan constituted 93% of the total export volume and contributed 90%
to the total export value of logs for the first nine months 2010. ( Table 2 )
Sawntimber
Volume of sawn timber exported in January to September 2010 increased by 15% to 650,760m3 from 566,485 m3 and the value also increased by 15%
to RM 596 million from RM 519 million compared to that of similar period in 2009.
Export Value of Logs and Timber Products
C
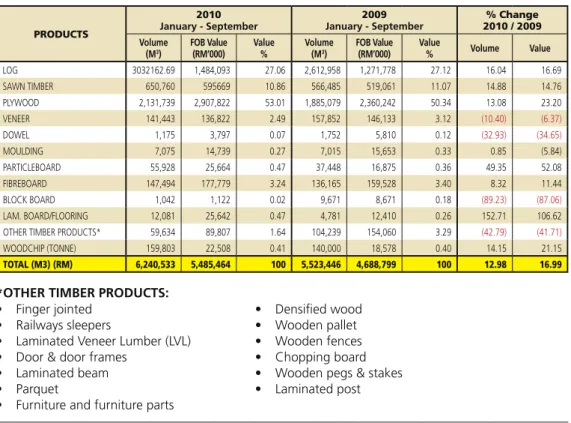
umulative exports value for January to September of the year reported to be increased by 17% at RM 5.5 billion against that of RM 4.7 billion for the corresponding period in 2009. There were increased in values of logs (17%), sawntimber (15%), plywood (23%), particleboard (52%), fibreboard (11%), laminated board (107%) and woodchips (21%). In spite of the overall increase in export value, there were a decreased in values of veneer (6%), dowel (35%), moulding (6%), blockboard (87%) and other timber products (42%).January to September 2010
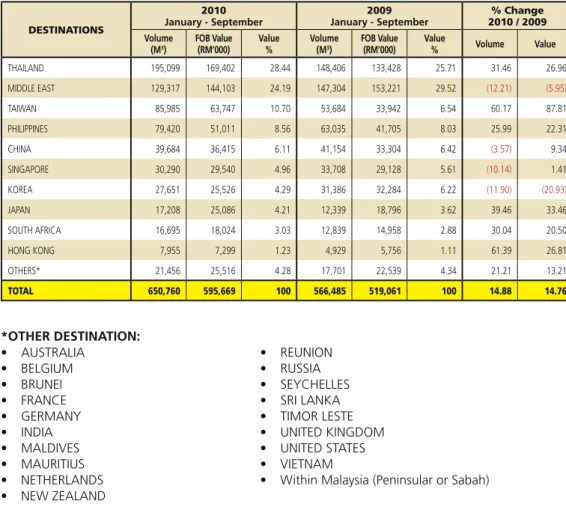
Thailand remained the major importer of the State’s sawntimber, by purchasing 195,099 m3 of the overall volume exported valued at RM 169 million followed by Middle East (129,317 m3 valued at RM 144 million) , Taiwan (85,985 m3 valued at RM 64 million) and Philippines (79,420 m3 valued at RM 51 million).
Export of sawn timber to Thailand in 2010 increased by 31% to 195,099 m3 from 148,406 m3 in comparison to the corresponding period of 2009, followed by Taiwan (60%) and Philippines (26%).
However export volume of sawntimber to Middle East decreased by 12%.
The major buyers of sawn timber like Thailand, Middle East, Taiwan and Philippines constituted 72% of the total export volume and contributed 70% to the total export value of logs for the first two months 2010. ( Table 3 )
Plywood
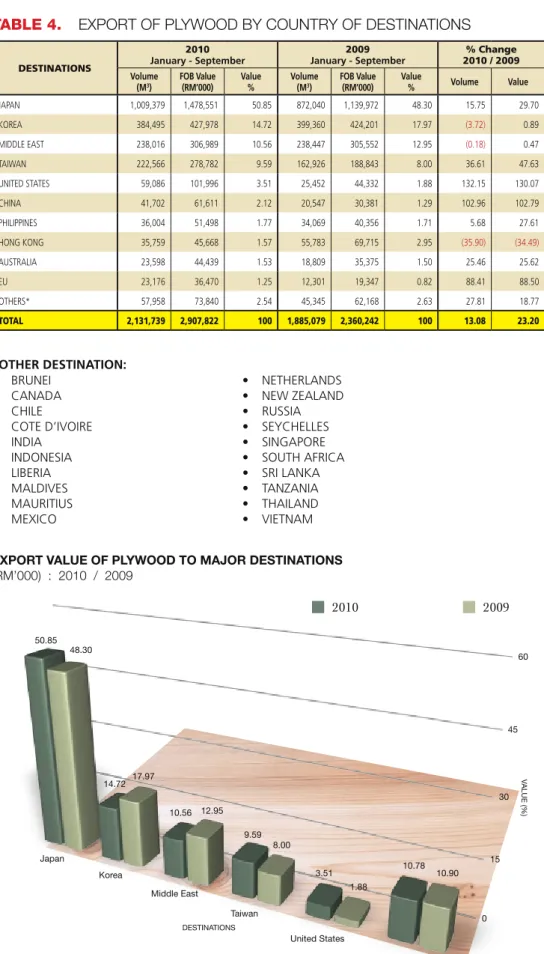
Plywood exported for the first three quarters of 2010 at 2.1 million m3 was 13% higher than that of 1.9 million m3 exported for the corresponding period in 2009. Its export value was increased by 23% to RM 3 billion from RM 2.4 billion compared to the same period in 2009.
Japan remains the major importer of the State’s plywood with the purchase of 1 million m3 or 51% of the volume exported valued at RM 1.5 billion followed by Korea (384,495 m3 valued at RM 428 million), Middle East (238,016 m3 valued at RM 307 million) and Taiwan (222,566 m3 valued at RM 279 million).
Export of plywood to Japan in 2010 increased by 16% to 1 million m3 from 0.9 million m3 in comparison to the corresponding period of 2009. Volume of plywood exported to Taiwan also increased by 37% to 222,566 m3 from 162,926 m3.
However export of plywood to Korea and Middle East decreased by 4% and 0.18%
respectively.
Export of plywood to Japan, Korea, Middle East and Taiwan constituted 86% of the overall exported volumes and contributed 87% to the overall revenues from the product for the first three quarters of 2010. ( Table 4 )
0UIFSUJNCFSQSPEVDUT
Other timber products includes veneer, dowel, moulding, particle board, fibreboard, block board, laminated board, woodchip and other timber products
(mention in Table 1). Value of export of these products was at RM 498 million accounted for 9% of the overall value of logs and timber products exported during the first half of 2010.
There was respective increased in volumes of moulding (1%), particleboard (50%), fibreboard (8%), laminated board
(153%) and woodchips (14%). However, there was a marked decrease for veneer (10%), dowel (33%) and blockboard (89%) for the first three quarters of 2010 compared to the corresponding period in 2009. ( Table 5 & 6 )
'VUVSF0VUMPPL
By the end of September 2010, the average unit prices of timber products such as logs, plywood, veneer,
particleboard, fibreboard and woodchips remain stable whereas blockboard was quite encouraging. They were respectively higher in the unit price of block board (20%) followed by plywood (9%), woodchips ( 6%) , veneer (4%), fibreboard (3%) particleboard (2%) and logs (1%) for January to September 2010 compared to the previous year. However unit price of sawntimber was lower by 0.1% then followed by dowel (3%), moulding (8%) and laminated board (18%) for the first three quarter of 2010 compared to that similar period in 2009.
Sarawak’s log suppliers are unwilling to commit to orders from importer due to the “tight” supply situation which has also resulted in higher log price. The average
prices for tropical logs have gone up by more than 10% from a year ago.
The shortfall in log supply was attributed largely to the abnormal wet weather which had adversely affected logging activities between May and July. (Source : The Star)
The other reason for the log shortage could be the impoundment of the Bakun hydroelectric dam that might have lowered the level of the Rejang River and its tributaries which have been used to transport logs from the major logging areas in Sarawak. As a result, the transport of logs for processing mills and exports has been disrupted. (Source: ITTO)
In addition, according to a report, which Japan Plywood Manufactures Association compiled based on the Finance Ministry’s
“Trade Statistics”, Japan’s plywood import in September 2010 increased for the sixth consecutive month with 267,889 m3 (up 9.1%) from the same month in year earlier). However, the supply trend at Malaysia, the biggest supplier, lost its momentum because the production showed down due to the shortage of logs. (Source: Japan Lumber Journal)
In spite of the current situation, the state registered an increase of 15.6 per cent for the export of timber products, which translates into RM5.60 billion for the first three quarters of 2010, as compared to RM4.75 billion in the same period last year. Ministry of Planning and Resource Management, Datuk Amar Awang Tengah Ali Hassan said that apart from that, the State’s main wood product exports such as log, plywood and sawn timber, for the first three quarter of 2010 had increased 20% from RM4.15 billion in 2009 to RM4.98 billion, compared to the same period in 2009. The upward surge is mainly due to the increase in demand by traditional markets such as Japan, China, Taiwan, India, United States and Middle East countries.
In line with the positive demand, the government had taken proactive measures to tackle issues in relation to procedures of exporting goods and product standards, in an effort to strengthen the international market level.
(Source: Borneo Post)
Export receipt from our timber industry is expected to hit RM 7 billion this year if the demand of timber products remain stable until year end.
PRODUCTS
2010
January - September 2009
January - September % Change
2010 / 2009 Volume
(M3) FOB Value (RM’000) Value
% Volume
(M3) FOB Value (RM’000) Value
% Volume Value
LOG 3032162.69 1,484,093 27.06 2,612,958 1,271,778 27.12 16.04 16.69
SAWN TIMBER 650,760 595669 10.86 566,485 519,061 11.07 14.88 14.76
PLYWOOD 2,131,739 2,907,822 53.01 1,885,079 2,360,242 50.34 13.08 23.20
VENEER 141,443 136,822 2.49 157,852 146,133 3.12 (10.40) (6.37)
DOWEL 1,175 3,797 0.07 1,752 5,810 0.12 (32.93) (34.65)
MOULDING 7,075 14,739 0.27 7,015 15,653 0.33 0.85 (5.84)
PARTICLEBOARD 55,928 25,664 0.47 37,448 16,875 0.36 49.35 52.08
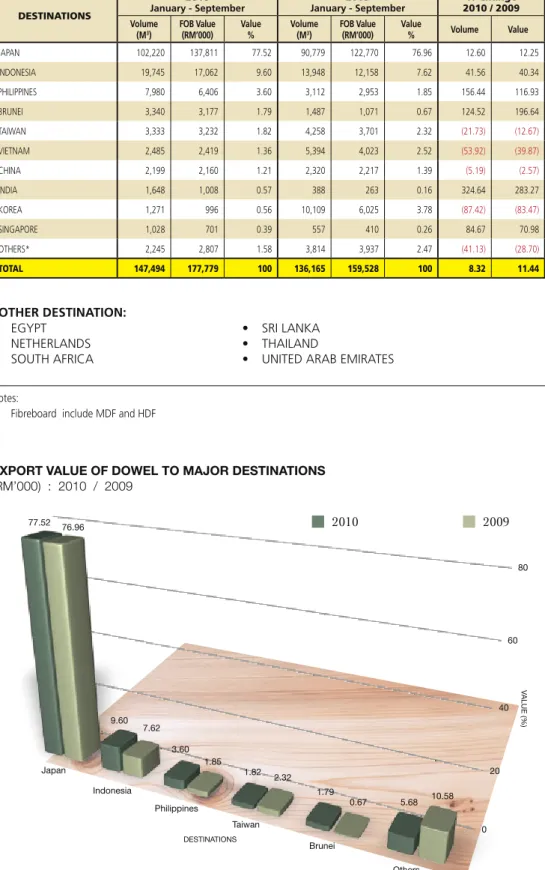
FIBREBOARD 147,494 177,779 3.24 136,165 159,528 3.40 8.32 11.44
BLOCK BOARD 1,042 1,122 0.02 9,671 8,671 0.18 (89.23) (87.06)
LAM. BOARD/FLOORING 12,081 25,642 0.47 4,781 12,410 0.26 152.71 106.62
OTHER TIMBER PRODUCTS* 59,634 89,807 1.64 104,239 154,060 3.29 (42.79) (41.71)
WOODCHIP (TONNE) 159,803 22,508 0.41 140,000 18,578 0.40 14.15 21.15
TOTAL (M3) (RM) 6,240,533 5,485,464 100 5,523,446 4,688,799 100 12.98 16.99
tradestatistics
sarawak
TABLE 1. &9103546.."3:0'5*.#&3"/%5*.#&3130%6$54'30.
SARAWAK
EXPORT VALUE OF MAJOR TIMBER & TIMBER PRODUCTS '30.4"3"8", 3.
UÊ Finger jointed UÊ Railways sleepers
UÊ Laminated Veneer Lumber (LVL) UÊ Door & door frames
UÊ Laminated beam UÊ Parquet
UÊ Furniture and furniture parts
UÊ Densified wood UÊ Wooden pallet UÊ Wooden fences UÊ Chopping board UÊ Wooden pegs & stakes UÊ Laminated post
*OTHER TIMBER PRODUCTS:
Notes:
UÊ Fibreboard include MDF and HDF
UÊ Total of volume (m3) does not includes woodchips (tonne)
UÊ Total does not include application/permit to transport goods within the Federation [Customs Decleration Form No.3 (CDF3)]
DESTINATIONS
2010
January - September 2009
January - September % Change
2010 / 2009 Volume
(M3) FOB Value (RM’000) Value
% Volume
(M3) FOB Value (RM’000) Value
% Volume Value
INDIA 1,650,225 865,402 58.31 1,588,201 795,832 62.58 3.91 8.74
CHINA 479,802 206,368 13.91 278,709 136,475 10.73 72.15 51.21
TAIWAN 371,418 174,307 11.75 286,487 133,182 10.47 29.65 30.88
JAPAN 296,416 139,938 9.43 169,862 84,953 6.68 74.50 64.72
VIETNAM 135,349 48,782 3.29 222,452 83,981 6.60 (39.16) (41.91)
KOREA 60,287 26,290 1.77 50,389 25,121 1.98 19.64 4.65
THAILAND 36,380 20,711 1.40 11,564 8,529 0.67 214.604 142.83
PAKISTAN 2,288 2,295 0.15 3,992 3,365 0.26 (42.70) (31.80)
PHILIPPINES - - - 1,302 340 0.03 (100.00) (100.00)
TOTAL 3,032,163 1,484,093 100.00 2,612,958 1,271,778 100.00 16.04 16.69
TABLE 2. &910350'-0(#:$06/53:0'%&45*/"5*0/4
EXPORT VALUE OF LOG TO MAJOR DESTINATIONS 3.
DESTINATIONS
2010
January - September 2009
January - September % Change
2010 / 2009 Volume
(M3) FOB Value (RM’000) Value
% Volume
(M3) FOB Value (RM’000) Value
% Volume Value
THAILAND 195,099 169,402 28.44 148,406 133,428 25.71 31.46 26.96
MIDDLE EAST 129,317 144,103 24.19 147,304 153,221 29.52 (12.21) (5.95)
TAIWAN 85,985 63,747 10.70 53,684 33,942 6.54 60.17 87.81
PHILIPPINES 79,420 51,011 8.56 63,035 41,705 8.03 25.99 22.31
CHINA 39,684 36,415 6.11 41,154 33,304 6.42 (3.57) 9.34
SINGAPORE 30,290 29,540 4.96 33,708 29,128 5.61 (10.14) 1.41
KOREA 27,651 25,526 4.29 31,386 32,284 6.22 (11.90) (20.93)
JAPAN 17,208 25,086 4.21 12,339 18,796 3.62 39.46 33.46
SOUTH AFRICA 16,695 18,024 3.03 12,839 14,958 2.88 30.04 20.50
HONG KONG 7,955 7,299 1.23 4,929 5,756 1.11 61.39 26.81
OTHERS* 21,456 25,516 4.28 17,701 22,539 4.34 21.21 13.21
TOTAL 650,760 595,669 100 566,485 519,061 100 14.88 14.76
TABLE 3. &910350'4"8/5*.#&3#:$06/53:0'%&45*/"5*0/4
EXPORT VALUE OF SAWN TIMBER TO MAJOR DESTINATIONS 3.
UÊ AUSTRALIA UÊ BELGIUM UÊ BRUNEI UÊ FRANCE UÊ GERMANY UÊ INDIA UÊ MALDIVES UÊ MAURITIUS UÊ NETHERLANDS UÊ NEW ZEALAND
UÊ REUNION UÊ RUSSIA UÊ SEYCHELLES UÊ SRI LANKA UÊ TIMOR LESTE UÊ UNITED KINGDOM UÊ UNITED STATES UÊ VIETNAM
UÊ Within Malaysia (Peninsular or Sabah)
*OTHER DESTINATION:
DESTINATIONS
January - September2010 2009
January - September % Change
2010 / 2009 Volume
(M3) FOB Value (RM’000) Value
% Volume
(M3) FOB Value (RM’000) Value
% Volume Value
JAPAN 1,009,379 1,478,551 50.85 872,040 1,139,972 48.30 15.75 29.70
KOREA 384,495 427,978 14.72 399,360 424,201 17.97 (3.72) 0.89
MIDDLE EAST 238,016 306,989 10.56 238,447 305,552 12.95 (0.18) 0.47
TAIWAN 222,566 278,782 9.59 162,926 188,843 8.00 36.61 47.63
UNITED STATES 59,086 101,996 3.51 25,452 44,332 1.88 132.15 130.07
CHINA 41,702 61,611 2.12 20,547 30,381 1.29 102.96 102.79
PHILIPPINES 36,004 51,498 1.77 34,069 40,356 1.71 5.68 27.61
HONG KONG 35,759 45,668 1.57 55,783 69,715 2.95 (35.90) (34.49)
AUSTRALIA 23,598 44,439 1.53 18,809 35,375 1.50 25.46 25.62
EU 23,176 36,470 1.25 12,301 19,347 0.82 88.41 88.50
OTHERS* 57,958 73,840 2.54 45,345 62,168 2.63 27.81 18.77
TOTAL 2,131,739 2,907,822 100 1,885,079 2,360,242 100 13.08 23.20
TABLE 4. &910350'1-:800%#:$06/53:0'%&45*/"5*0/4
EXPORT VALUE OF PLYWOOD TO MAJOR DESTINATIONS 3.
UÊ BRUNEI UÊ CANADA UÊ CHILE UÊ COTE D’IVOIRE UÊ INDIA UÊ INDONESIA UÊ LIBERIA UÊ MALDIVES UÊ MAURITIUS UÊ MEXICO
UÊ NETHERLANDS UÊ NEW ZEALAND UÊ RUSSIA UÊ SEYCHELLES UÊ SINGAPORE UÊ SOUTH AFRICA UÊ SRI LANKA UÊ TANZANIA UÊ THAILAND UÊ VIETNAM
*OTHER DESTINATION:
DESTINATIONS
January - September2010 2009
January - September % Change
2010 / 2009 Volume
(M3) FOB Value (RM’000) Value
% Volume
(M3) FOB Value (RM’000) Value
% Volume Value
TAIWAN 63,951 58,734 42.93 62,719 60,056 41.10 1.96 (2.20)
KOREA 37,966 33,872 24.76 53,332 42,246 28.91 (28.81) (19.82)
CHINA 20,443 16,800 12.28 19,361 13,938 9.54 5.59 20.53
PHILIPPINES 9,511 11,249 8.22 15,146 18,609 12.73 (37.21) (39.55)
JAPAN 5,984 9,385 6.86 4,485 7,210 4.93 33.43 30.17
THAILAND 2,542 1,598 1.17 908 873 0.60 179.98 83.05
AUSTRALIA 920 5,056 3.70 167 1,618 1.11 451.96 212.48
SINGAPORE 95 70 0.05 80 57 0.04 18.91 22.81
SRI LANKA 31 58 0.04 - - - 100.00 100.00
VIETNAM - - - 1,208 978 0.67 (100.00) (100.00)
OTHERS* - - - 446 548 0.38 (100.00) (100.00)
TOTAL 141,443 136,822 100 157,852 146,133 100 (10.40) (6.37)
TABLE 5. &910350'7&/&&3#:$06/53:0'%&45*/"5*0/4
EXPORT VALUE OF VENEER TO MAJOR DESTINATIONS 3.
UÊ CHILE UÊ INDONESIA
*OTHER DESTINATION:
DESTINATIONS
January - September2010 2009
January - September % Change
2010 / 2009 Volume
(M3) FOB Value (RM’000) Value
% Volume
(M3) FOB Value (RM’000) Value
% Volume Value
UNITED STATES 527 1,890 49.78 714 2,233 38.43 (26.21) (15.36)
AUSTRALIA 174 374 9.85 373 994 17.11 (53.47) (62.37)
UNITED KINGDOM 104 440 11.59 98 337 5.80 6.19 30.56
SOUTH AFRICA 73 214 5.64 107 340 5.85 (31.80) (37.06)
INDIA 53 185 4.87 75 226 3.89 (29.68) (18.14)
JAPAN 48 166 4.37 222 920 15.83 (78.27) (81.96)
SAUDI ARABIA 47 15 0.40 - - - 100.00 100.00
TAIWAN 40 62 1.63 10 16 0.28 286.44 287.50
GERMANY 34 153 4.03 36 138 2.38 (4.86) 10.87
SWITZERLAND 32 130 3.42 51 231 3.98 (36.43) (43.72)
OTHERS* 43 168 4.42 66 375 6.45 (35.18) (55.20)
TOTAL 1,175 3,797 100 1,752 5,810 100 (32.93) (34.65)
TABLE 6. &910350'%08&-#:$06/53:0'%&45*/"5*0/4
EXPORT VALUE OF DOWEL TO MAJOR DESTINATIONS 3.
UÊ BELGIUM UÊ CANADA UÊ DENMARK
UÊ NETHERLANDS UÊ NORWAY UÊ SPAIN
*OTHER DESTINATION:
DESTINATIONS
January - September2010 2009
January - September % Change
2010 / 2009 Volume
(M3) FOB Value (RM’000) Value
% Volume
(M3) FOB Value (RM’000) Value
% Volume Value
KOREA 2,579 4,444 30.15 1,937 3,371 21.54 33.10 31.83
AUSTRALIA 1,566 3,958 26.85 2,224 4,484 28.65 (29.56) (11.73)
JAPAN 1,111 2,010 13.64 539 1,066 6.81 106.07 88.56
TAIWAN 309 805 5.46 175 357 2.28 76.11 125.49
CANADA 271 779 5.29 87 297 1.90 210.21 162.29
UNITED KINGDOM 215 507 3.44 273 713 4.56 (21.19) (28.89)
GERMANY 206 565 3.83 404 1,389 8.87 (49.08) (59.32)
UNITED STATES 156 529 3.59 848 2,574 16.44 (81.60) (79.45)
CHINA 113 178 1.21 50 59 0.38 125.64 201.69
BELGIUM 113 181 1.23 - - - 100.00 100.00
OTHERS* 436 783 5.31 477 1,343 8.58 (8.55) (41.70)
TOTAL 7,075 14,739 100 7,015 15,653 100 0.85 (5.84)
TABLE 7. &910350'.06-%*/(#:$06/53:0'%&45*/"5*0/4
EXPORT VALUE OF MOULDING TO MAJOR DESTINATIONS 3.
UÊ BANGLADESH UÊ DENMARK UÊ IRAQ UÊ ITALY UÊ JORDAN UÊ MALDIVES UÊ MAURITIUS UÊ NETHERLANDS
UÊ POLAND UÊ SEYCHELLES UÊ SINGAPORE UÊ SOUTH AFRICA UÊ SRI LANKA UÊ TURKEY
UÊ UNITED ARAB EMIRATES
*OTHER DESTINATION:
DESTINATIONS
January - September2010 2009
January - September % Change
2010 / 2009 Volume
(M3) FOB Value (RM’000) Value
% Volume
(M3) FOB Value (RM’000) Value
% Volume Value
JAPAN 102,220 137,811 77.52 90,779 122,770 76.96 12.60 12.25
INDONESIA 19,745 17,062 9.60 13,948 12,158 7.62 41.56 40.34
PHILIPPINES 7,980 6,406 3.60 3,112 2,953 1.85 156.44 116.93
BRUNEI 3,340 3,177 1.79 1,487 1,071 0.67 124.52 196.64
TAIWAN 3,333 3,232 1.82 4,258 3,701 2.32 (21.73) (12.67)
VIETNAM 2,485 2,419 1.36 5,394 4,023 2.52 (53.92) (39.87)
CHINA 2,199 2,160 1.21 2,320 2,217 1.39 (5.19) (2.57)
INDIA 1,648 1,008 0.57 388 263 0.16 324.64 283.27
KOREA 1,271 996 0.56 10,109 6,025 3.78 (87.42) (83.47)
SINGAPORE 1,028 701 0.39 557 410 0.26 84.67 70.98
OTHERS* 2,245 2,807 1.58 3,814 3,937 2.47 (41.13) (28.70)
TOTAL 147,494 177,779 100 136,165 159,528 100 8.32 11.44
TABLE 8. &910350''*#3�"3%#:$06/53:0'%&45*/"5*0/4
EXPORT VALUE OF DOWEL TO MAJOR DESTINATIONS 3.
UÊ EGYPT UÊ NETHERLANDS UÊ SOUTH AFRICA
UÊ SRI LANKA UÊ THAILAND
UÊ UNITED ARAB EMIRATES
*OTHER DESTINATION:
Notes:
UÊ Fibreboard include MDF and HDF
DESTINATIONS
January - September2010 2009
January - September % Change
2010 / 2009 Volume
(M3) FOB Value (RM’000) Value
% Volume
(M3) FOB Value (RM’000) Value
% Volume Value
INDONESIA 27,757 12,871 50.15 17,044 7,811 46.29 62.85 64.78
PHILIPPINES 8,659 4,264 16.61 3,023 1,361 8.07 186.46 213.30
VIETNAM 5,471 2,485 9.68 5,669 2,319 13.74 (3.50) 7.16
INDIA 3,433 1,380 5.38 1,182 507 3.00 190.42 172.19
BANGLADESH 2,883 855 3.33 1,027 418 2.48 180.61 104.55
CHINA 2,285