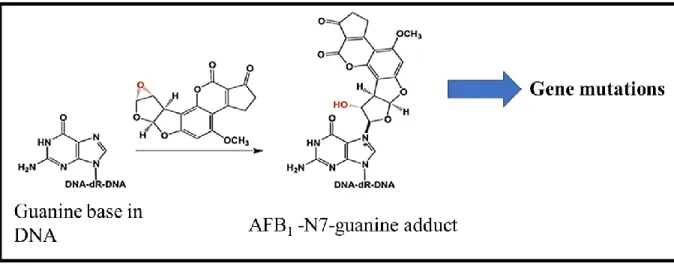
Figure 2.6: The reactive metabolite AFBO can react with guanine bases on the N7 atom in DNA. 35 Figure 3.8: The principle of the annexin V assay in the detection of apoptotic and necrotic cells (prepared by author).
INTRODUCTION
BACKGROUND
PROBLEM STATEMENT
AIM OF THE STUDY
HYPOTHESIS
OBJECTIVES OF THE STUDY
LITERATURE REVIEW
MYCOTOXINS
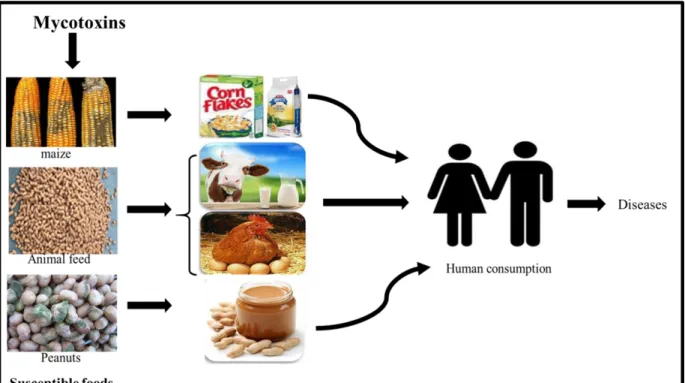
The genera Aspergillus, Fusarium, Penicillium and Alternaria are considered the most mycotoxin-producing fungi (da Rocha et al., 2014, Carvajal- Moreno, 2015). The main route of exposure to mycotoxins in humans is through the ingestion of contaminated plant and animal products, including food derived from these products such as cheese, milk and meat (Figure 2.1) (da Rocha et al., 2014, Alshannaq and Yu, 2017).
AFLATOXINS
- Physical and chemical properties of aflatoxins
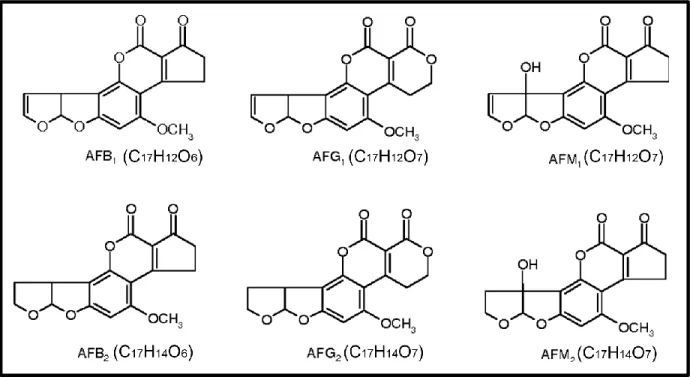
- Types of aflatoxins
The plague occurred in the early 1960s and was characterized by the death of turkey fowl in England after consuming a peanut meal originating from Brazil and Africa (Alshannaq and Yu, 2017). Aflatoxins are unstable under UV light in the presence of oxygen and extreme pH levels (<3 or >10).
AFLATOXIN B 1
- Structure
- Metabolism
- Biochemical effects of AFBO
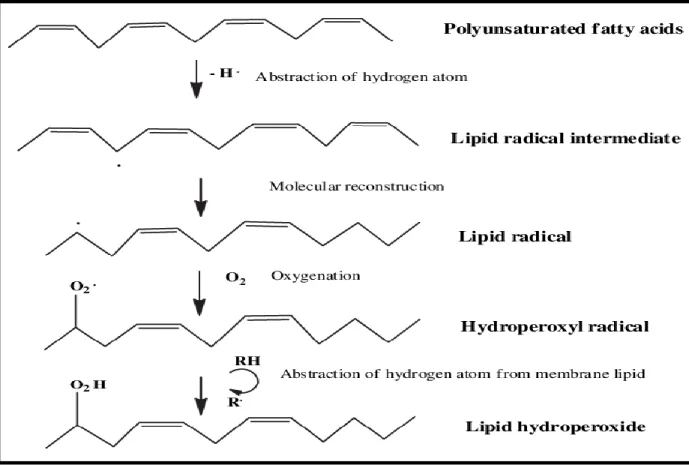
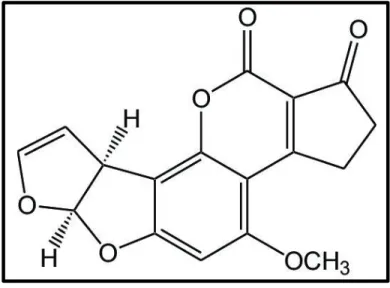
Aflatoxin B1 (C17H12O6) has a difuro-coumaro-cyclopentenone structure fused with a lactone ring of the coumarin structure with oxygen (O2) in positions 1, 4 and 11 (Marchese et al., 2018). Lipid peroxidation can result in the formation of many oxidation products, including malondialdehyde (MDA), lipid hydroperoxides (LOOH), propanal, and 4-hydroxynonenal (4-HNE) (Ayala et al., 2014).
OXIDATIVE STRESS
- Production of free radicals
- Antioxidant response
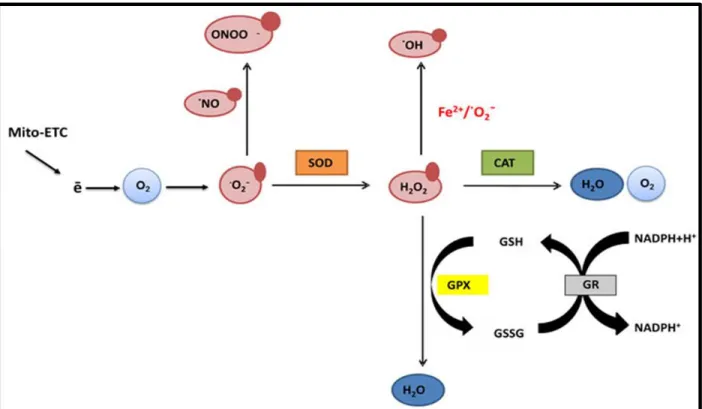
Hydrogen peroxide can be converted to water by catalase or GPx enzymes and inducible changes or variability in their expression. Furthermore, the accumulation of AFB1 and its metabolites in the body, especially AFBO, depletes GSH which is an important antioxidant that prevents cellular damage caused by ROS (Carvajal-Moreno, 2015). Consequently, GSH depletion is due to the formation of high amounts of epoxides and ROS in the body resulting in oxidative stress.
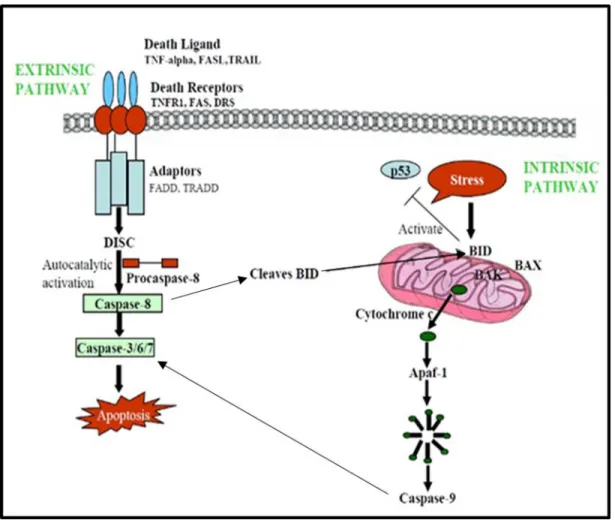
MECHANISMS OF CELL DEATH
- Apoptosis
- Necrosis
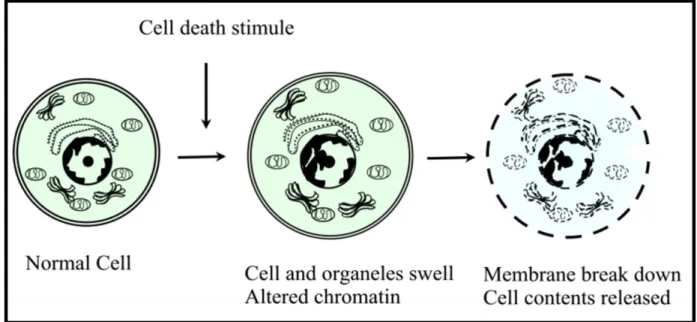
19 reported that AFB1 could induce apoptosis in hepatocytes, bone marrow, lung cells, or human bronchial epithelial cells (Chen et al., 2016). Morphological features of necrosis include cell membrane swelling, chromatin condensation, and abnormal DNA degradation (Figure 2.12) (Escobar et al., 2015). The necrotic process occurs in the absence of phagocytosis, and its final phase is mainly characterized by the loss of cell membrane integrity (Escobar et al., 2015).
EFFECTS OF AFB 1
- Multiple organs and cell lines
Although AFB1 mainly targets the liver, it was recently reported to cause myocardial toxicity in rats. 2017) revealed that AFB1 consumption by rats led to mitochondrial membrane disruption and cristae disorganization, indicative of mitochondrial damage (Ge et al., 2017). Myocardial apoptosis was found to be significantly higher after AFB1 treatment compared to the control, as the activities of caspase 3, Bax and BCl2 were upregulated in the cardiac tissue. Due to the lipophilicity of AFB1, its distribution in the blood and its excretion by the kidneys, the kidney may also be sensitive to its toxic effects.
TOXIC EFFECTS ON THE KIDNEY
- Kidney structure and function
- The Human embryonic kidney (Hek293) cell line
- Effects of AFB 1 on the kidney
In addition, the imposed load increases their requirements for nutrients, oxygen and energy (Moosa et al., 2015). Different parts of the nephron are exposed to aflatoxins before they are excreted, so AFB1 and its metabolites can lead to nephrotoxicity (Coulombe Jr, 1994, Sharma et al., 2011, Bbosa et al., 2013a). In cultured kidney cell lines, AFB1 was implicated in the induction of aggregated and condensed chromatin, mitochondrial degeneration, and loss of microvilli (Bbosa et al., 2013a).
MATERIALS AND METHODS
MATERIALS
CELL CULTURE
- Background
- Protocol
A vial of cryopreserved Hek293 cells was thawed at 37˚C and resuspended in a 25 cm3 flask, in 10 ml complete culture medium (CCM) consisting of Dulbecco's Modified Eagle's Medium (DMEM) supplemented with 10% fetal bovine serum. beef broth (FCS), 1% L-glutamine, 1% penicillin streptomycin fungizone, and 1.25 mM HEPES. After 4 hours the CCM was discarded, the flask was filled with 5 ml of CCM and incubated overnight (5% CO2, 37oC). Cells were maintained and monitored, CCM was changed frequently until cells reached confluence.
PREPARATION OF THE TREATMENTS
MTT ASSAY
- Background
- Protocol
26 Figure 3.1 : Reduction of yellow tetrazole salt to purple formazan by metabolically active cells (Prepared by the author). The MTT salt solution was replaced with 100 μl of the solubilizing agent dimethyl sulfoxide (DMSO) for 1 hour at 37oC to dissolve the formazan crystals. The absorbance of the samples was determined using Bio-Tek µQuant plate reader (USA) at a wavelength of 570 nm and reference wavelength of 690 nm.
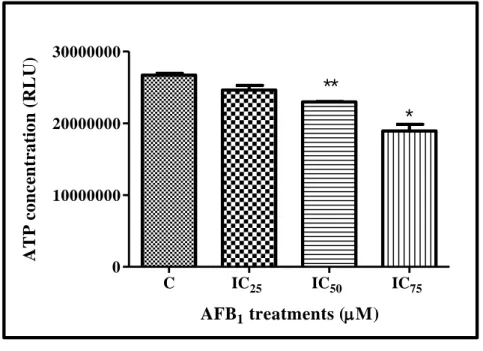
ATP ASSAY
- Background
- Protocol
Cells were then treated with 300 µl concentrations of AFB1 (IC25, IC50, IC75) in duplicate for 24 hours, untreated cells serving as control. After treatment, the treatment medium was discarded and the cells were gently washed 1x with 300 µl of 0.1 M PBS. The wells were filled with 50 µl of 0.1 M PBS and 25 µl of Cell Titre-Glo® ATP reagent was added to each well.
TBARS ASSAY
- Background
- Protocol
29 Figure 3.3 : The principle of the TBARS test showing that thiobarbituric acid (TBA) reacts with MDA in the presence of heat or acid to produce a colored product proportional to lipid peroxidation levels in samples (Prepared by author). The tubes were vortexed briefly and the mixture in each tube was acidified by adding 200 µl of 1 M HCl. The samples were allowed to cool to room temperature and 1500 µl of butanol was added to each tube.
NITRIC OXIDE SYNTHASE (NOS) ASSAY
- Background
- Protocol
The absorbances were read using a Bio-Tek µQuant plate reader at a wavelength of 540 nm and a reference wavelength of 690 nm.
GSH ASSAY
- Background
- Protocol
After fixation, 24 h treatments with different concentrations of AFB1 were performed in duplicate and the plate was incubated at 37 °C in a humidified incubator containing 5% CO2. The treatment medium was then removed and the wells were filled with 50 µl of 0.1 M PBS. Then, 25 µl of 1x GSH-Glo reagent was added to each well and the plate was incubated at room temperature away from light.
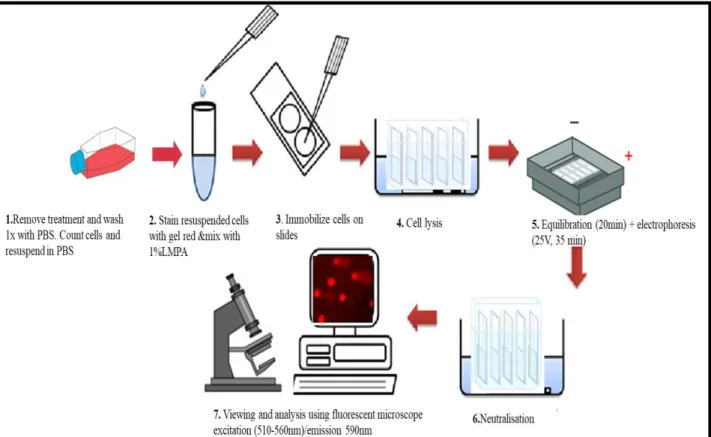
THE SINGLE CELL GEL ELECTROPHORESIS (SCGE) ASSAY
- Background
- Protocol
Luminance was measured using the Modulus™ microplate luminometer (Turner Bio-Systems, Sunnyvale, California, USA) and data were presented as RLU. However, when DNA is damaged, the damaged DNA strands unwind and electrophoretically migrate from the nucleus into the agarose suspension due to the attraction of the negatively charged DNA towards the positively charged anode and give a comet tail (Nandhakumar et al., 2011). The coverslip was removed and the second layer consisting of the cell suspension (20,000 cells in 400 µl 1% LMPA and 1 µl red gel) was pipetted onto the slide, covered with a coverslip and allowed to settle at 4°C for 10 minutes.
CASPASE ACTIVITY
- Background
- Protocol
Resuspended control and treated Hek293 cells were embedded in 1% low melting point agarose (LMPA) sandwiched between a base layer containing 2% LMPA and an upper layer containing 1% LMPA, as each slide consisted of 3 layers gel. Slides were then allowed to equilibrate by immersion in electrophoresis buffer (1 mM Na2EDTA and 300 mM NaOH, pH 13) for 20 min prior to electrophoresis (25 V, 35 min at 37 °C). Cells were plated at a density of 20000/well on a white 96-well luminometer plate and incubated overnight (5% CO2, 37˚C) and then treated in duplicate with 300 µl of different concentrations of AFB1 (IC25, IC50, IC75) for 24 hours with untreated cells serving as control.

ANNEXIN V ASSAY
- Background
- Protocol
After incubation, the cells were treated with different concentrations of AFB1 (C, IC25, IC50, IC75) for 24 hours, then treatment media were removed, and the cells were gently washed with 300 µl 0.1M PBS and supplemented with 50 µl 0.1 M PBS, then 25 µl of the detection reagent was loaded into each well and the plate was incubated for 30 minutes at room temperature protected from light.
LDH ASSAY
- Background
- Protocol
Hek293 cells were treated with various concentrations of AFB1 and the treatment supernatants were retained in eppendorf tubes labeled according to the different AFB1 treatments. After incubation, 25 µl of stop solution was added and the absorbances were read at 490/690 using a Bio-Tek µQuant plate reader.
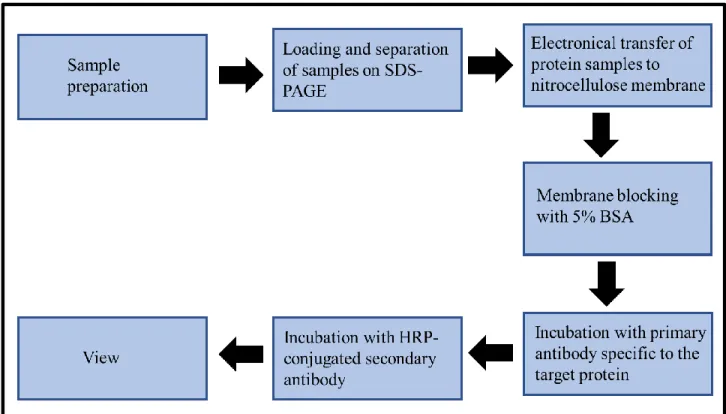
WESTERN BLOTTING
- Background
- Protein isolation
- Protein quantification and sample preparation
- SDS-PAGE and Transfer
- Immunoprobing
The proteins are transferred to a nitrocellulose membrane which is incubated with specific antibodies that bind to the protein of interest (Figure. The unbound antibody is washed away leaving only the bound antibody against the protein of interest (Taylor and Posch, 2014). Hek293 cells were treated with IC25, IC50, IC75 concentrations of AFB1 and the untreated flask served as the control.
QUANTITATIVE PCR (qPCR)
- Background
- Protocol
Then, 100 µl of chloroform was added to thawed samples, mixed vigorously for 15 seconds, and samples were incubated at room temperature for 2-3 minutes. Then, pellets were resuspended in 15 µl of nuclease-free water (NFH2O), and samples were incubated at room temperature for 2–3 min on ice, and isolated RNA was quantified using a nanodrop 2000 (Thermo Fisher Scientific, Johannesburg, S.A.). RNA was determined using a Each treatment was performed in triplicate in a plate covered with plastic and centrifuged (200 rpm, 37°C, 3 min) and then placed in the CFX Touch™ Real Time PCR Detection System (Bio-Rad; Hercules, Calif. USA The reaction was subjected to initial denaturation (95°C, 4 minutes), followed by an annealing phase (60°C, 40 seconds), which can be modified to accommodate different genes, and finally the extension phase (72°C for 30 seconds) .
DNA fragmentation
- Background
- Protocol
600 µl of isopropanol was added to the tubes containing the supernatants and the tubes were inversely mixed for 5 minutes and then centrifuged (13,000 rpm for 5 minutes). After centrifugation, the supernatant was decanted into a new 1.5 ml eppendorf, leaving the pellet behind, and isopropanol was added to the tubes accordingly (60 µl supernatant, 200 µl pellet). The pellet was scored in each tube, the pellets were combined for each treatment and 300 µl of ethanol was added to the final pellet and then vigorously vortexed followed by centrifugation (13,000 rpm for 5 min). The ethanol was carefully removed, noting the clean white pellet, and the tubes were dried on an absorbent towel for 1 hour.
STATISTICAL ANALYSIS
The DNA concentration for each sample was measured using Nanodrop (Nanodrop 2000) and the obtained concentrations were standardized to the lowest concentration (100 ng/µl). Standardized DNA samples were prepared with loading dye (10 µl : 10 µl) then loaded onto the gel, a DNA scale of 1 kilogram base pairs (kb) was used as a marker for the migration of the samples DNA in the gel and the gel was used. electrophoresed (120 V) monitoring the migration of the samples.
RESULTS
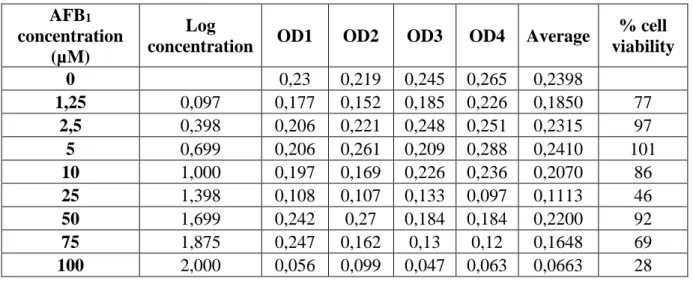
- CELL VIABILITY
- MTT assay
- ATP assay
- OXIDATIVE STRESS
- TBARS assay
- NOS assay
- GSH assay
- Hsp70
- Antioxidant response
- DNA DAMAGE
- SCGE assay
- DNA fragmentation
- OGG1 expression
- CELL DEATH
- Caspase activity
- Apoptosis-related proteins
- Mode of cell death
The concentration of RNA in AFB1-treated Hek293 cells was evaluated using the nitrate assay. The expression of proteins in AFB1-treated Hek293 cells was determined using Western blotting relative to the control. Evaluation of the expression apoptosis-related protein in AFB1-treated Hek293 cells was determined using Western blotting.
DISCUSSION
The antioxidant response is modulated by the upregulation of Nrf-2 (Figure 4.7) in all treated Hek293 cells. The cleavage of Parp (Figure 4.12C) renders the enzyme inactive, further explaining the observed DNA fragmentation (Figure 4.9) and the progression to apoptosis (Peng et al., 2016). 67 Progression of the intrinsic pathway of apoptosis may also have been prevented by the expression of c-IAP (Figure 4.13A), which was upregulated in this study.
CONCLUSION
Metabolic changes of aflatoxin B1 to become an active carcinogen and the control of this toxin. The toxic effects of aflatoxin B1 and aflatoxin M1 on the kidneys by regulating L-proline and downstream apoptosis. Cytotoxic effects of aflatoxin B1 on microvascular endothelial cells of the blood-brain barrier in the human brain.