PLAGIARISM
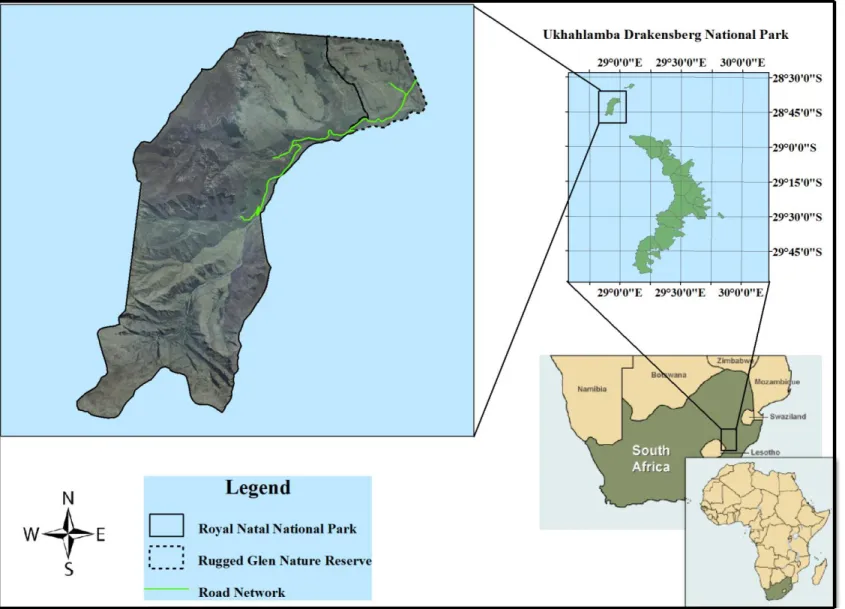
This research focuses on bracken fern attacks in two areas within the uKhahlamba Drakensberg Park World Heritage Area; Royal Natal National Park and Rugged Glen Nature Reserve. This showed that the bracken is expanding in the Royal Natal National Park and Rugged Glen Nature Reserve, as expected.
Introduction
- Background
- Remote Sensing and invasive plant management
- Invasive plant management
- What is change detection
- Research Motivation
- Economic impacts
- Ecological impacts
- Research Problem
- Research Question
- Research Aims and Objectives
- Research Aim
- Research Objectives
- Study Area
- Thesis Organisation
The ecological threat to bracken fern is related to the biodiversity of grasslands in the park and reserve. Additionally, there is currently no management plan to control or eradicate bracken fern in the park and reserve.
Literature review
Change detection
Classification based change detection techniques
Previous research on change detection
- Post-classification comparison
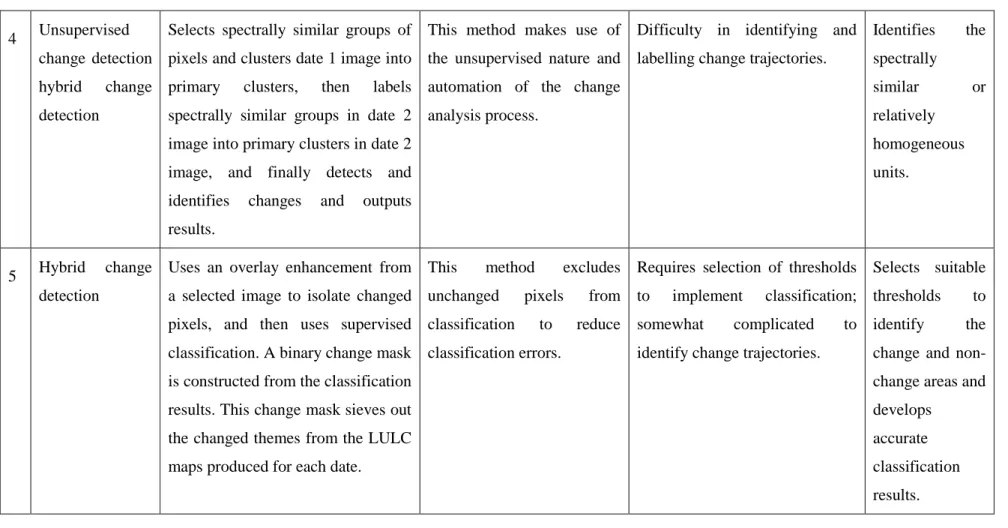
The post-classification change detection technique does not require; Class prior probabilities as needed in expectation maximization (EM) detection technique, identification and labeling of change trajectories as required by unsupervised change detection, or thresholds as required for hybrid change detection technique (Lu et al, 2004). The difficulty of identifying and labeling change trajectories (Lu et al, 2004) and unavailable a priori class probabilities and thresholds preclude the maximization detection (EM) technique, unsupervised change detection and hybrid change detection techniques for application. in this quest.
![Table 2.1: Classification change detection techniques (extracted and modified from Table 1 of Lu et al [2004])](https://thumb-ap.123doks.com/thumbv2/pubpdfnet/10636749.0/22.1188.107.1118.193.808/table-classification-change-detection-techniques-extracted-modified-table.webp)
Previous image classification of invasive plants
First, mixed pixels are likely to be common and should be taken into account in the image classification process. Image classification is an iterative process that repeats itself if the accuracy assessment of the classification image is poor.
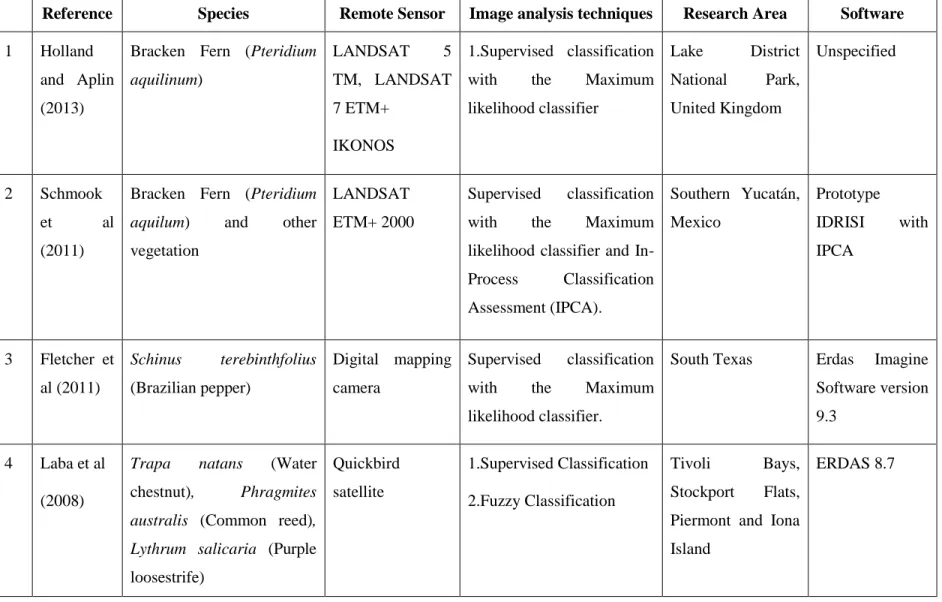
Image pre-processing: radiometric and geometric corrections
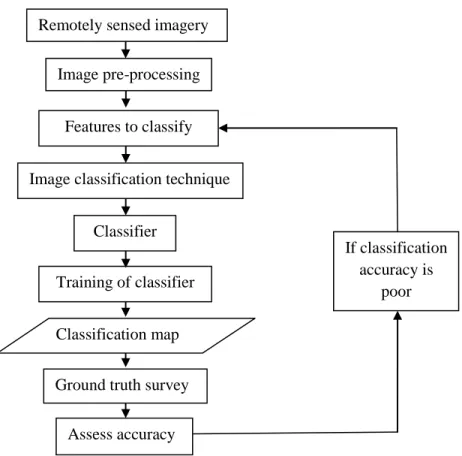
A system of image classification steps based on previous research includes; acquisition of remotely sensed images with spatial, spectral and temporal resolution required for a specific application, applying image pre-processing to correct for radiometric and geometric distortions in the images, identifying which land cover features will be involved in the image classification, selection of ' n image classification technique considering the available imagery and the feature to be classified, select a classifier that represents the classy pixels representing each feature, select the location and amount of training sites to train the classifier, create and error matrix and Kappa coefficient to assess the accuracy of a classified image. Geometric correction is necessary to remove terrain distortions in digital remote sensing images (Mather, 2001; Gil et al, 2011).
Remotely sensed imagery
Radiometric correction is required to remove distortions that cause variability in surface reflectance values in raw digital images (Campbell, 2007). These operations result in the conversion of raw digital remote sensing images into a usable data set (Campbell, 2007; Lu and Weng, 2007).
Image orthorectification
The smoothing that occurs with bilinear interpolation can be avoided by using cubic convolution (Schowengerdt, 2007). Thus, bilinear interpolation is a more favorable technique than cubic convolution for orthorectification of the aerial images used in this research.
Image classification techniques
- Supervised classification
- Fuzzy classification
- Fuzzification and defuzzification
The analyst decides which land cover types are of interest and will appear in the final classified image (Campbell, 2007). The general phases in the supervised classification procedure are the training phase and classification phases (Mather, 2001; Jensen, 2005; Campbell, 2007; Schowengerdt, 2007; Lillesand et al, 2008).
Classification decision rule
Fuzzy classification uses a membership function that indicates which class a certain pixel value most belongs to (Mather, 2001; Jensen, 2005; Chaira and Ray, 2010). The defuzzification process converts fuzzy results into crisp values by using the maximum membership degree of the fuzzy classification (Benz et al, 2003).
Gaussian Maximum Likelihood Classifier
However, if the minimum membership value degree does not meet the threshold value, no classification will take place. This ensures the minimum reliability of the classification (Benz et al, 2003). 1 - Inverse of covariance matrix of the pixels in the sample of class c ln - Natural logarithm function.
Accuracy assessment
- Ground truth verification
- Error matrix
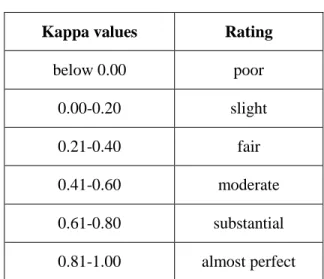
- Kappa coefficient
Producer accuracy refers to the percentage of pixels that are correctly classified relative to the number of reference pixels (Campbell, 2007; Lillesand et al, 2008; Holland and Aplin, 2013). Foody (2002), on the other hand, states that the use of the kappa coefficient may lead to an underestimation of classification accuracy.
Geographical Information Systems
Bracken fern
Taxonomy
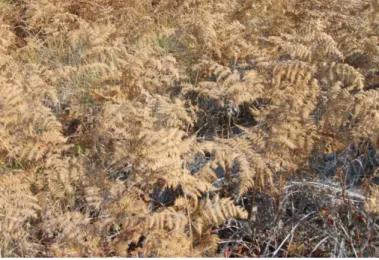
Description
Habitat
Growth pattern
The development of spores into new fern fern plants is facilitated by soils that have consistent moisture and are frost-free (Bond et al, 2007). Soil minerals such as nitrogen, phosphorus, calcium and potassium are important for the establishment of young fern plants (Bond et al, 2007). In nutrient-rich soils, young fern plants can develop very quickly (Bond et al, 2007).
Bracken fern has a rapid growth rate that can be difficult to control (Bond et al, 2007). The depths that fern rhizomes can reach in the soil is the most important factor contributing to their expansion (Schneider, 2004; Schneider, 2006). The persistent underground rhizome growth pattern and dispersal mechanisms of bracken fern make it difficult to eradicate (Schneider, 2004; Schneider, 2006).
Fire regimes
Nitrogen and potassium stimulate its growth in the later stages of its development (Bond et al, 2007). Brittle fern thus experiences steady growth during the spring and summer months and a decline or even a growth arrest in the autumn and winter months (Crane, 1990; Bond et al, 2007).
Toxicity
Chapter 2 summary
Materials and Methods
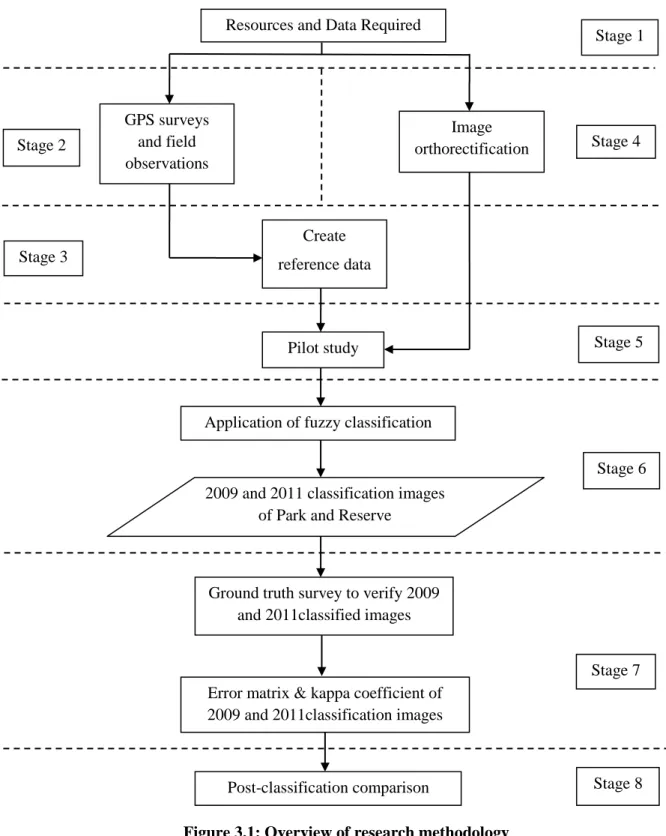
- Overview of research methodology
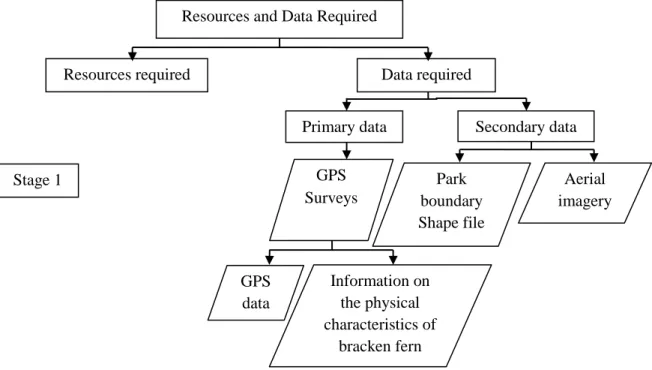
- Stage 1: Resources and Data Required
- Software
- GPS surveys
- Aerial Imagery
- Stage 2: GPS surveys of the Park and Reserve
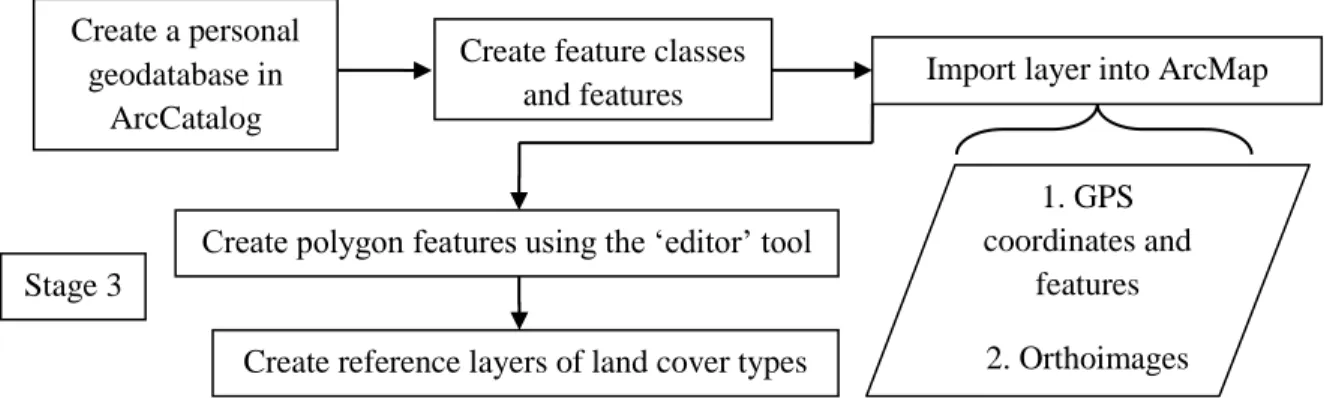
- Stage 3: Create reference data
- Stage 4: Image orthorectification
- Stage 5: Pilot study
- Classification approach 1: Supervised classification
- Classification approach 2: Fuzzy classification
- Accuracy assessment of pilot study
- Stage 6: Fuzzy classification
- Stage 7: Accuracy assessment
- Stage 8: Post-classification comparison
- Chapter 3 summary
Erdas 2011 was used to evaluate the accuracy of the classified images of the pilot study. Determining the stand sizes in the research areas was done visually and a GPS point represented the center of a stand of ferns. Second, experience from GPS surveys would create an understanding of the land cover classes that occurred in the research areas, which would facilitate accurate training for image classification.
7 Vegetation type 4 Areas of mixed vegetation growing on hilltops on the northern side of the Park and Reserve. The frequency distribution histograms for each land cover class were inspected to determine the suitability of the training data. The accuracy of the vaguely classified images of the park and reserve from 2009 and 2011 was evaluated using a ground truth search, an error matrix and Kc.
Results
- Observations of GPS surveys
- Results of image orthorectification
- Result of pilot study
- Result of fuzzy classification
- Results of post-classification analysis
- Chapter 4 summary
This shows that there was a significant difference in the areas classified as bracken in the fuzzy and supervised classified images. The 2009 and 2011 fuzzy classified images depict areas where bracken fern occurs in the Park and Reserve and are shown in Figures 4.7 and 4.8 respectively. Then the change of fern distribution in the Park and Reserve is shown on the change detection map in Figure 4.9.
Visual inspection of the change map seemed to indicate a trend in the distribution of bracken fern infestation. Two sites were selected as reference sites (referred to as site 1 and site 2) and their percentage change of fern growth was calculated. The pilot study found that there was significant misclassification of fragile fern in the supervised classified image compared to the fuzzy classification.
Discussion of results
- Discussion of GPS survey observations
- Discussion of pilot study
- Discussion of fuzzy classification
- Discussion of the post-classification comparison
- Chapter 5 summary
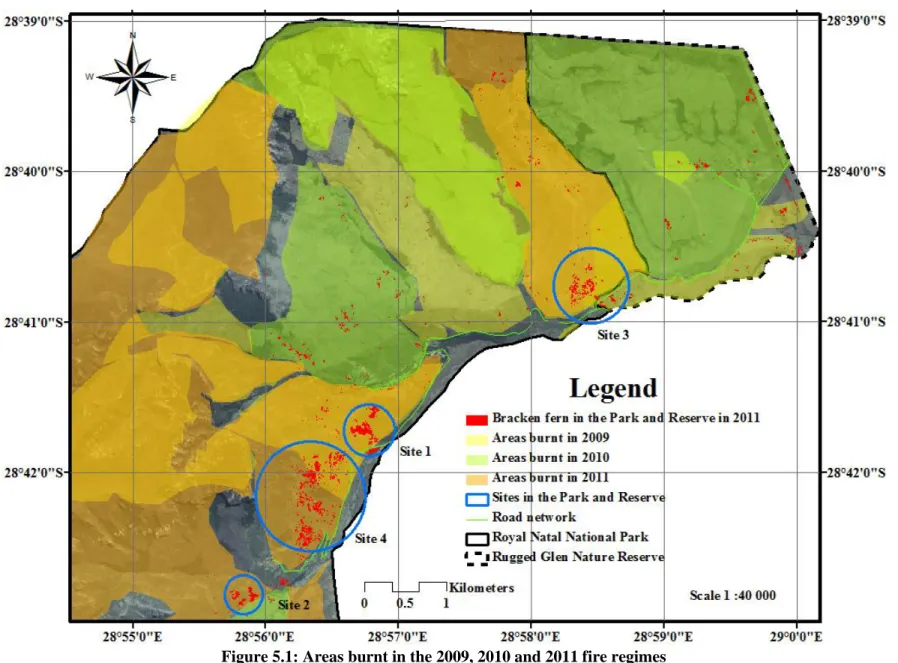
This discussion covers the results of the change detected in fern growth in the Park and Reserve from 2009 to 2011. There was a reduction in fern growth in the western and northern areas of the Park and the northern areas of the Reserve from 2009 to 2011 .However, classification maps indicated that bracken fern does not infest all areas of the Park and Reserve.
These three factors may contribute to the spread of bracken fern in the Park and Reserve. Further expansion of the fern encroachment poses a greater risk to biodiversity in the Park and Reserve. The field observations of fern growth increasing in the Park and Reserve supported the results of the classified images.
Conclusion and Recommendations
Review of objectives
The classified images were used to create classification maps that highlighted areas infested with bracken fern in the park and reserve in 2009 and 2011. The classification maps also made it possible to determine the extent of infestation in the park and reserve in 2009 and 2011. A classification change detection analysis of the classified images determined the changes in the distribution of bracken fern from 2009 to 2011.
There were four locations where there was a noticeable increase in bracken fern infestation from 2009 to 2011. These three factors could be responsible for the increased spread seen in the park and reserve in 2011. These three factors were used to predict areas , which was at possible risk of bracken in the Park and Reserve.
Review of aim
Brittle fern infestation was found to be increasing in both the Park and Reserve from 2009 to 2011 by 24% and 27% per year respectively. Further investigation of the infested areas revealed that the majority of fern growth, 67.5% in the Park and 75% in the Reserve, occurred on slopes ranging from gentle to moderately gentle east-facing slopes, southeast or south and burned by fire regimes. . This leaves the possibility that areas in the Park and Reserve will not burn in fire regimes that have heavy fern infestations.
Limitation to research
Recommendations for further research
Further study of the factors that play a role in increasing the spread of bracken is recommended. Knowing these factors along with the rate of spread can also be used to model its spread in an area such as a Park and Reserve. If a system could be developed that models the spread of the fern, it would serve as a valuable tool for monitoring and controlling its spread.
Concluding Remarks
Biology and non-chemical control of bracken fern (Pteridium aquilinum (L.) Kuhn). http://www.gardenorganic.org.uk/organicweeds > [Accessed 13 April. Soil biology and biochemistry, 35, p. 1998) Decomposition of mixed pixels in remote sensing images to improve area estimation of agricultural fields. Evaluating the accuracy of weed mapping in fallow fields using airborne digital imaging: Panicum effusum in canola stubble. 2008) Introduction to Remote Sensing and Image Interpretation.
Cost-effectiveness of remote sensing for tropical coastal resource assessment management Journal of ambient management, 55, pp Multispectral image analysis using the object-oriented paradigm. An irregular cover: Bracken fern invasion in the changing cropping systems of Southern Yucatan, Mexico. International Archives of Photogrammetry, Remote Sensing and Spatial Information Sciences, xxxvii (Part B7), pp Review Article Digital Change Detection Techniques Using Remote Sensing Data.