However, total return was 24% higher in NVT, but total market return was 8.3% higher in FPVT. The microclimate in FPVT stimulated vegetative growth and improved tomato quality.
INTRODUCTION
Effect of vents on the distributed climate of the greenhouse: a review of experimental and CFD studies. Kubota, C and Kacira, M, International Workshop on Greenhouse Gas Management and Crop Production in Semi-arid Regions, 1-9.
LITERATURE REVIEW
Introduction
Sustainable small-scale greenhouses are among the controlled environment technologies that could help developing countries grow more vegetables even in the off-season to combat malnutrition and food insecurity. In South Africa, there are reports that 35% of the population faces food insecurity (du Toit, 2011) and 26% live below the poverty line (Kollodge, 2011).
Greenhouse Microclimate
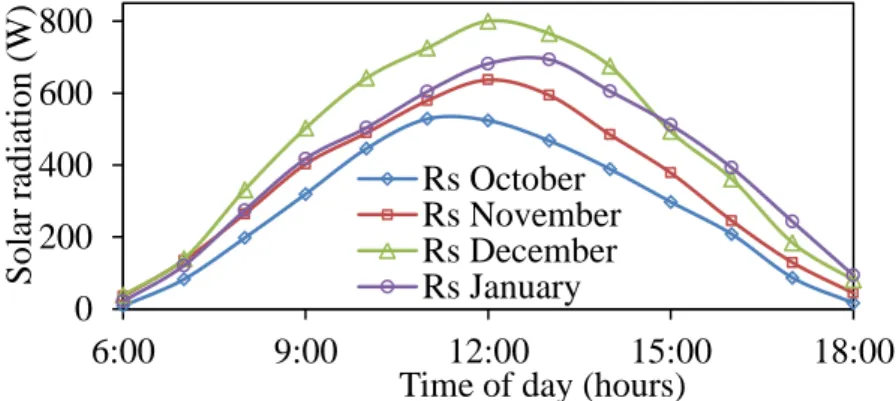
- Solar radiation
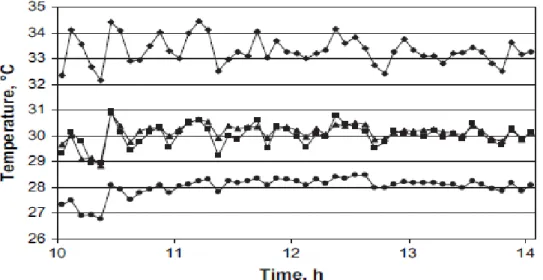
- Temperature
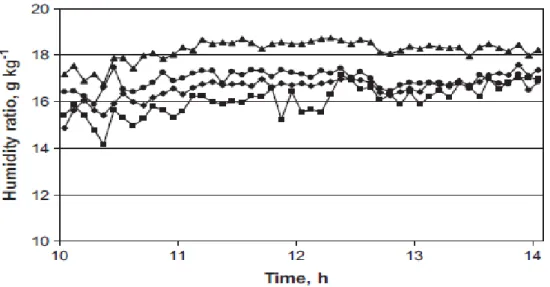
- Relative humidity
- Air velocity
Of these, photosynthetic radiation in the 400–700 nm wavelengths of the visible light spectrum provides the energy required for plant growth and the pressure potential required for transpiration (Baxevanou et al., 2007). The air velocity in the greenhouse is an important factor, as the distribution of temperature and relative humidity follows the pattern of air flow (Bartzanas et al., 2002; Li and Willits, 2008).
Ventilation and Cooling in Greenhouses
- Natural ventilation
- Effect of vent configuration on temperature and relative humidity
- Effect of wind speed and direction on internal air temperature and RH
- Effect of crop height on internal air temperature and RH
- Effect of insect-proof screens on internal air temperature and RH
Greenhouse internal air velocity and ventilation rate have been found to be higher in high wind areas than in low wind areas (Boulard et al., 1997). The ventilation rate varies linearly with increasing wind speed (Kacira et al., 2004; Teitel et al., 2008a).
Fan-Pad Evaporative Cooling and Ventilation
This can be attributed to additional cooling of the greenhouse interior, due to crop transpiration (Max et al., 2009). The presence of a tall crop reduces the spatial variation in the vertical and horizontal planes (Willits, 2003; Lopez et al., 2010), due to the cooling effect of the crop leaves through transpiration (Bailey, 2006).
Comparison of Natural and Fan-Pad Evaporative Cooling and Ventilation
- Comparison between natural and fan-pad evaporative cooling and
- Comparison of natural ventilation and fan-pad ventilation on crop
In addition, fan-grown tomatoes had more defects such as blossom end rot and cracked fruit than naturally ventilated tomatoes (Max et al., 2009). In addition, there was a higher number of cracked fruits in the naturally ventilated greenhouse compared to the fan greenhouse.
Postharvest Quality Attributes of Tomatoes
- Influence of pre-harvest climatic conditions on postharvest quality of
- Influence of postharvest storage conditions
- Genotypic variation effects on postharvest quality attributes
- Storage time effects on the postharvest quality attributes of tomatoes 26
The temperature and RH also affect the cuticular membranes of the tomatoes, which affects the texture of tomatoes (Matas et al., 2005). This is attributed to the temperature dependence of the enzymatic activity on the cell wall of tomatoes (Meli et al., 2010).
Conclusions
Growing temperatures above 32°C and below 12°C inhibit the normal development of the red color of tomatoes (Gruda, 2012). Cold storage temperature and high RH slow down the ripening process and extend the shelf life of tomatoes.
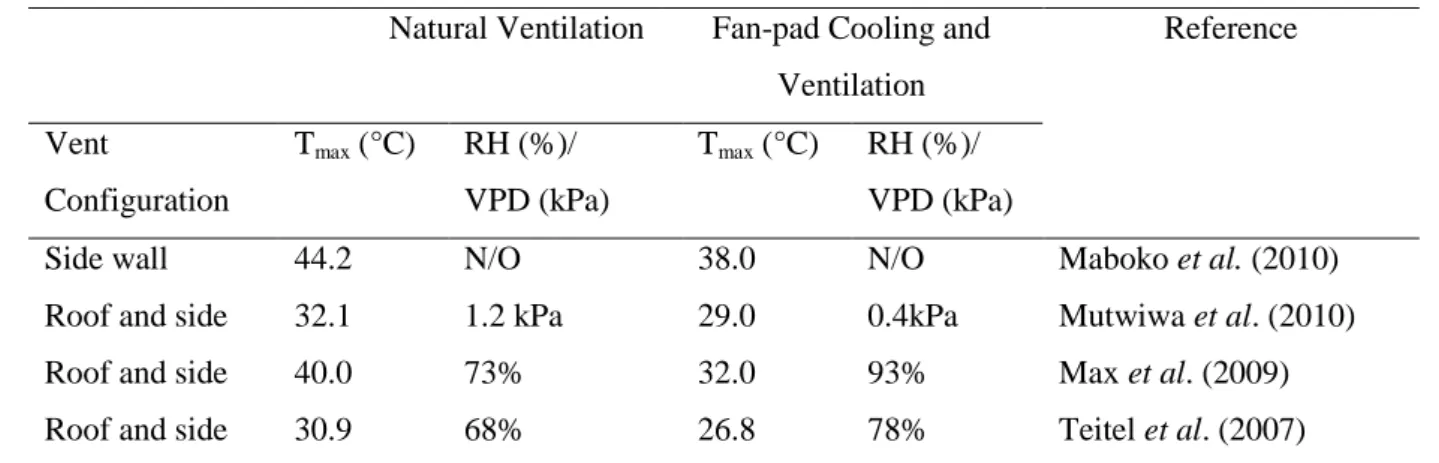
Effect of greenhouse cooling method on the growth and yield of tomato in the subtropics. The two main techniques used in the ventilation of agricultural greenhouses are natural and fan block evaporative cooling.
Introduction
Similarly, temperatures tend to increase with height within the greenhouse (Kittas et al., 2003; Li and Willits, 2008). Temperatures and vapor pressure deficits were found to be low near the vents and higher inland (Boulard et al., 2004).
Materials and Methods
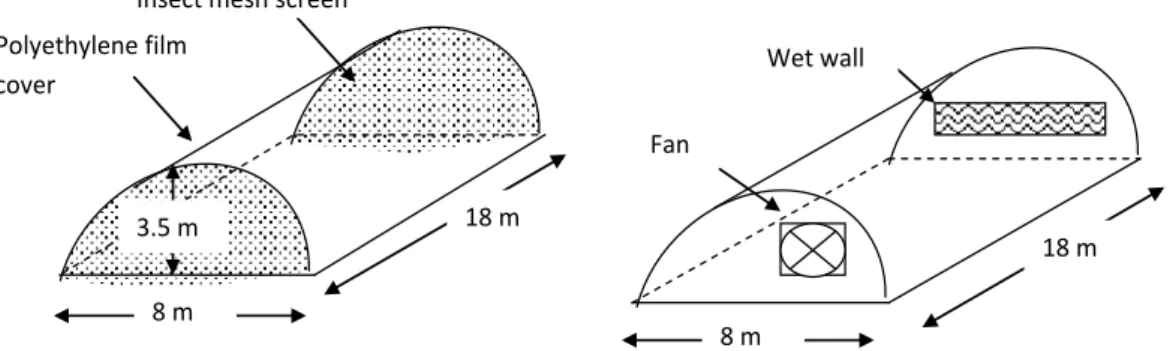
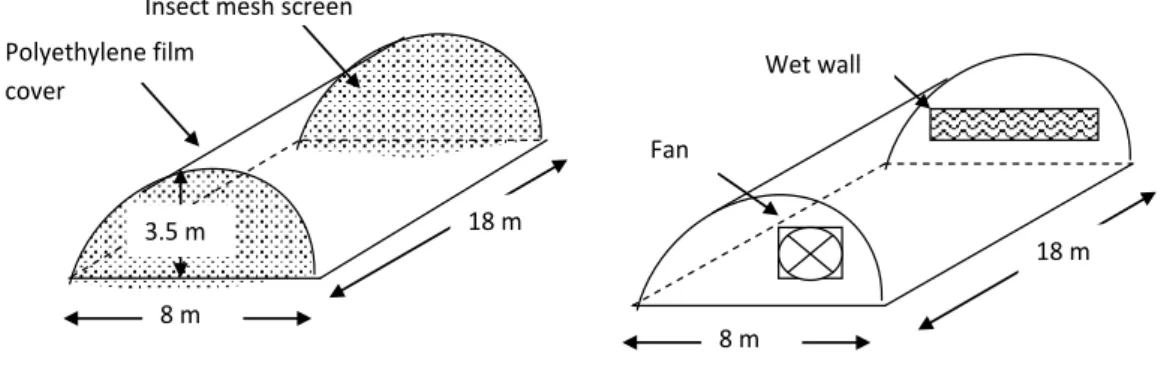
- Greenhouses
- Experimental design
- Crop production
- Irrigation and fertigation
- Data collection
- Analysis
To investigate the influence of the two microclimates mentioned above on the growth, yield and quality of tomatoes. This arrangement was chosen to facilitate the observation of vertical and horizontal stratification and the inhomogeneity of the distribution of internal temperature and relative humidity in the tunnels.
Results
- Daytime temperature and relative humidity
- Night-time temperature and relative humidity
- Stratification of internal microclimate conditions
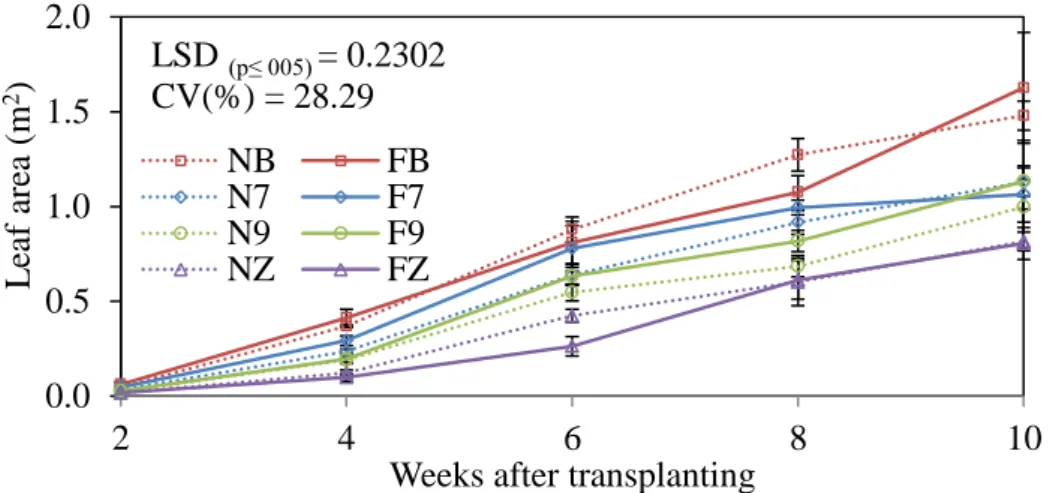
- Plant growth
- Fruit yield and quality
Daytime relative humidity in the FPVT was significantly higher (P<0.01) in the path section than in the center and fan sections. As with the NVT, the humidity at the lower level was significantly higher than at the upper level. Nighttime relative humidity levels were significantly (P < 0.01) higher at the upper than at the lower level in the FPVT.
There were no significant (P>0.05) differences in the total marketable yield of tomatoes harvested with FPVT and NVT.
Discussion
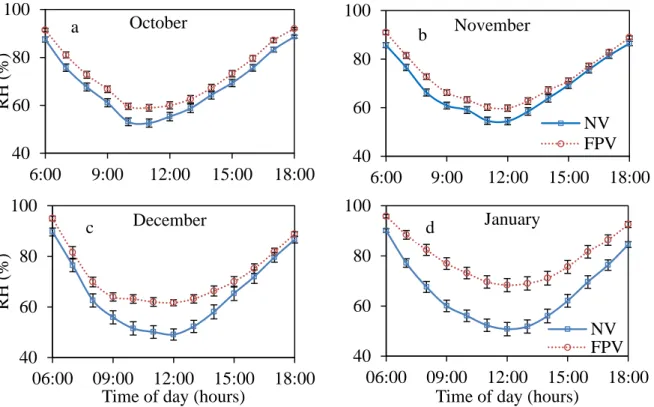
- Daytime temperature and relative humidity
- Night-time temperature and relative humidity
- Microclimate stratification
- Effects on tomato plant growth, fruit yield and quality
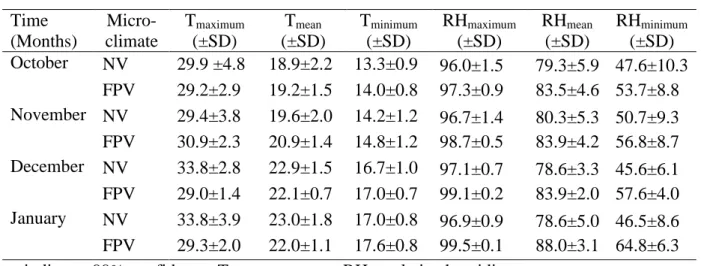
In NVT, the lowest relative humidity (49%) was in December and the next lowest was in January (51%). In NVT, there was less change in relative humidity at the lowest level, compared to FPVT. This is in agreement with Bartzanas et al. 2004), who stated that the relative humidity tends to be lower near the vents than in the interior of the greenhouse.
The canopy was found to be the coldest surface in the greenhouse at night (Piscia et al., 2012).
Conclusion
In the NRA, Star 9009 and Star 9037 were the best performers in terms of total yield, although 25-35% of this yield was non-marketable.
Cantaliffe, DJ, XXVII International Symposium on Advances in Environmental Control, Automation and Cultivation Systems for Sustainable, High Quality Crop Production under Protected Cultivation, 285-297. Chen, S and Li, TT, International Symposium on Environmental Design and Control of Tropical and Subtropical Greenhouses, 1-9. Cantaliffe, DJ, XXVII International Symposium on Advances in Environmental Control, Automation and Cultivation Systems for Sustainable High Quality Crop Production under Protected Cultivation, 33-40.
Kamaruddin, R, Rukuniddin, H og Hamid, NRA, Proceedings of an International Symposium on Drivhuse, Environmental Controls and In-house Mechanization for Crop Production in the Tropics and Sub-tropics, 31-42.
RESPONSE OF POSTHARVEST QUALITY ATTRIBUTES AND CULTIVARS
Introduction
The loss of quality and post-harvest spoilage of tomatoes results in significant losses for producers, retailers and consumers (Bapat et al., 2010). It can also be used as a measure of the ripeness of physiologically mature tomatoes (de Castro et al., 2005). These include modified and controlled atmosphere storage, packaging, low temperature storage conditions and ethylene inhibition (Wills et al., 2007).
Sheltered cultivation is mostly carried out in naturally ventilated tunnels, although the use of fan-cooled rooms is becoming increasingly popular (Maboko et al., 2010).
Materials and Methods
- Quality attributes analysed
- Data analysis
Tomatoes are the second most important vegetable crop in South Africa, contributing around 24% of the country's vegetable production (DAFF, 2013). Most of the tomato production in South Africa is carried out in open fields, although protected cultivation is popular. For each cultivar, half of the fruits (20 fruits) were stored under cold storage conditions and the other half under ambient conditions.
Each fruit was placed in the holding section of the machine and then a 2 mm stainless steel probe attached to a load cell was driven into the fruit at a penetration rate of 10 mm.minute-1 as shown in Figure 4.2.
Results
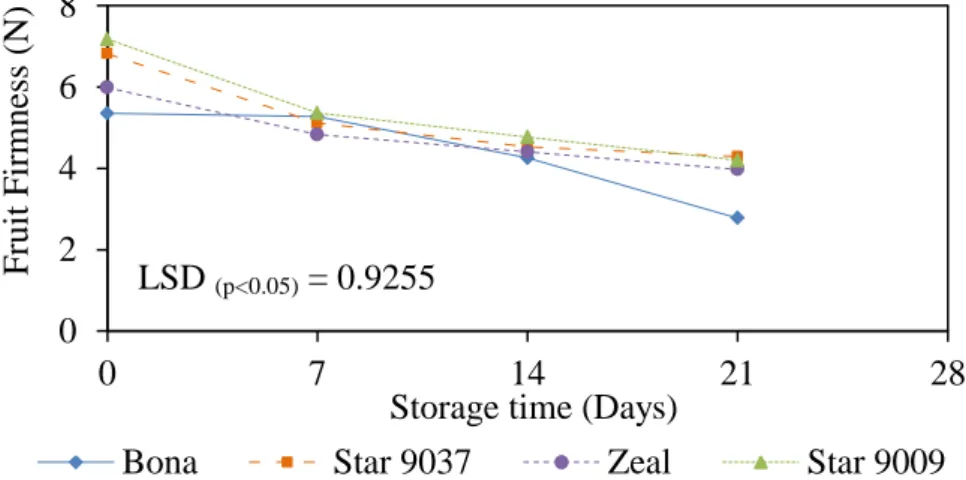
- Firmness
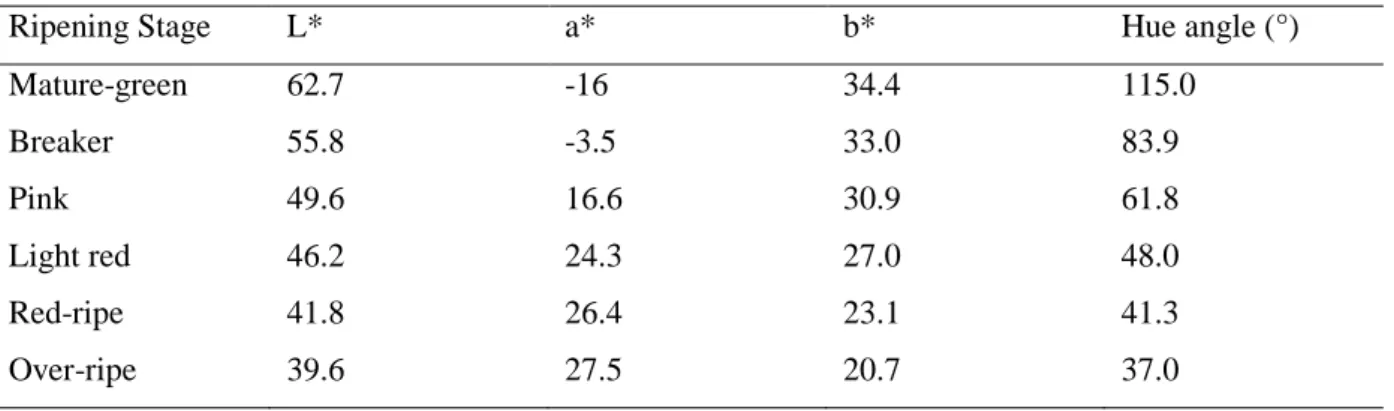
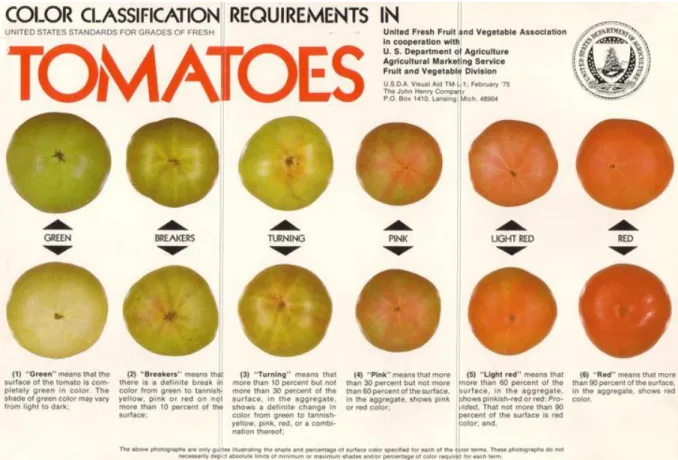
- Change in colour
- Total soluble solids
- pH values
During the last seven days of storage, the TSS content of tomatoes decreased by 59%. Under cold storage conditions, the pH level was 18.8% higher than that of tomatoes stored under ambient air conditions. During the last seven days of storage, the pH value of tomatoes decreased by 50.1%.
In contrast, the pH values of tomatoes grown in FPVT and stored in ambient air conditions decreased significantly by 6.9%.
Discussion
- Firmness
- Change of colour
- Total soluble solids
- pH values
Low relative humidity in the surrounding air causes mass transfer-induced transpiration from the surface of the tomatoes (Tano et al., 2005). This is attributed to the ripening process and moisture loss from the surface of the tomatoes due to transpiration, which is higher at storage temperatures in ambient air (Žnidarčič et al., 2010). This discrepancy can be attributed to the effect of the lower average and minimum temperatures observed in the NVT.
Under cold storage, the TSS of tomatoes was 17.7% lower than under ambient storage (Table 4.4), in agreement with Gharezi et al.
Conclusion
Bona tomatoes were found to be slightly more acidic when grown in FPVT than in NVT (Table 4.4). The effect of microclimate on the organic acids in tomato fruit is complex (Caliman et al., 2010). Sakiyama and Stevens (1976) suggested that organic acids are synthesized in the fruit, while Bertin et al. 2000) suggested that some may be translocated from leaves and roots.
Furthermore, cultivar Bona grown in the NVT had the highest TSS content, while the TSS contents for Star 9037, Star 9009, and Zeal grown in the FPVT were low.
The study has also provided an understanding of how integrated agrotechnologies affect the quality of fresh produce after harvest. Seasonal development of the quality of fresh greenhouse tomatoes under Mediterranean conditions, as affected by vapor pressure deficit and plant fruit stress. The effect of high day and low night temperature on pollen production, pollen germination and postharvest quality of tomatoes.
Effect of harvest and storage conditions on the postharvest quality of tomato (Lycopersicon esculentum Mill) cv.
WINTER GREENHOUSE MICROCLIMATE AND ITS EFFECT ON
- Introduction
- Materials and Methods
- Experimental design
- Crop production
- Data collection
- Analysis
- Results
- Microclimate
- Plant growth
- Yield and quality
- Discussion
- Microclimate
- Crop growth
- Yield and quality
- Conclusion
- References
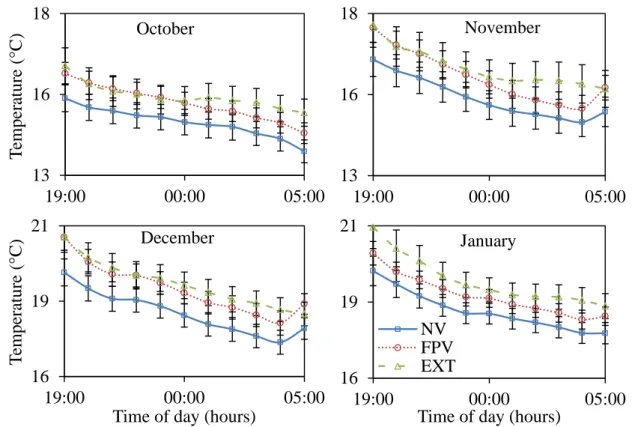
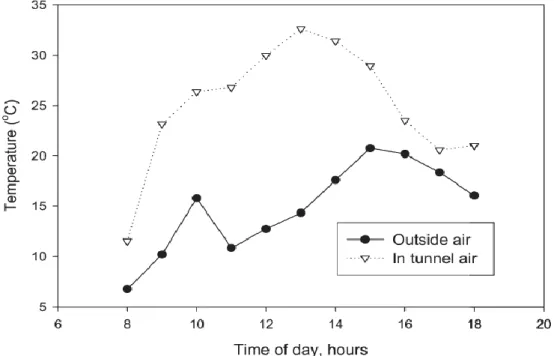
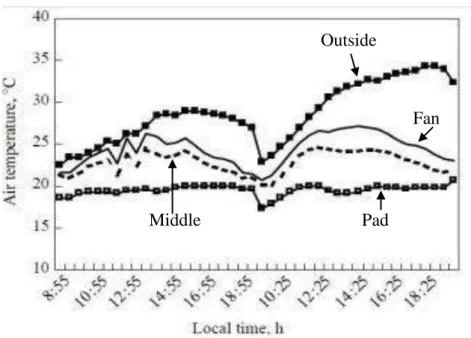
The average air temperature in the NVT was up to 6°C higher than in the FPVT. The NVT humidity was up to 27% lower than the FPVT humidity in the middle of the day. Relative humidity was highest in the FPVT, followed by the NVT and lowest outside.
High relative humidity in FPVT may have been the cause of 26.9% more leaves affected by leaf tip burn.
CONCLUSION AND RECOMMENDATIONS
Conclusion
The total unmarketable returns in the FPVT were half of the unmarketable returns in the NVT. The FPVT microclimate reduced the quality of the lettuce, where the incidence of leaf tip burn was 26.9% higher than in the NVT. Tomatoes grown under the NVT microclimate had a firmer texture (by 7.4%) and had a TSS content that was 10.3% higher than those grown in the FPVT.
In winter, Ballerina, which had the higher yields under the FPVT microclimate, would be best suited for cultivation in the FPVT, although leaf tip burn could lower the quality of the products.
Recommendations
Although the microclimate in the FPVT was better than in the NVT, there was little benefit from the optimal conditions in terms of higher total yields. Under Pietermaritzburg conditions, Star 9009 and Star 9037 would be the best cultivars for summer cultivation in the NVT as they had the highest total and marketable yields under the NVT environment. In the FPVT, cultivar Bona, which had the highest total and salable yields in this tunnel, would be the best cultivar for this tunnel in summer.
Nadine would be most suitable for cultivation in the NVT, as growth and yield were not affected by microclimatic conditions.
Further research with other greenhouse crops such as peppers and cucumbers to determine their performance under both microclimates. Further research in other agro-climatic regions of South Africa to expand the information base on greenhouse microclimate and its effect on crops in South Africa. Wind-driven ventilation of a mono-span greenhouse with a rose crop and continuous shielded side vents and its effect on flow patterns and microclimate.
APPENDICES
Appendix 3.1 ANOVA Tables for Plant Growth Parameters