Where the work of others has been used, this has been duly acknowledged and cited in the text. In the context of South Africa, the Eastern Cape Province represents one of the most depressed and poorest regions with widespread poverty.
Gender and living conditions of the poor in the Eastern Cape
CONCLUSION AND REMARKS
I TRODUCTION
Organization of the study
This is followed by the section on the purpose and goals of the study, where three interwoven goals are identified. The focus of the analysis is on those in the lowest expenditure category (the poor).
REVIEW OF THE LITERATURE
Chr9nic and transient notions of poverty
Social relations both in the household1 and in institutions outside the household are therefore crucial in explaining status differences between the sexes. Social relationships within the household are key to understanding the disadvantaged position of women compared to men.
Eternalizing gender inequality
According to Moore, the simple assumption that poverty is always associated with female-headed households is dangerous because it rests on the prior assumption that its members will be worse off because they represent incomplete families. She argues that some female-headed households are actually better off than male-headed households. They reviewed 61 studies on the link between female leadership and poverty and found that in 38 cases, female-headed households were overrepresented among the poor, but not in others; or were overrepresented among the poor on some indicators but not on others.
The situation of households headed by a woman and without an economically active man (either present or employed elsewhere) is also dire. Distributional issues must also be considered: since female-headed households may have a more equal distribution of resources, women and children in such households may be better off than in male-headed households, even if total household income is relatively low . . Fourth, family breakdown, population movements between urban and rural areas within countries, international migration, war and internal displacement are factors contributing to the increase in female-headed households; and female-headed households are very often among the poorest due to gender-based barriers, as explained earlier.
They argue that women are generally not overrepresented in consumption-poor households, nor are female-headed households more likely to be poor in general. Such differences may occur within households between men and women or between households, with female-headed households being at a disadvantage.
Trends in gender disparity in South Africa
- The incidence of poverty in South Africa
- Trends in experiential aspects of poverty
In all cases, a greater proportion of female than male household members are likely to be involved in water collection. Educational attainment: Between 1995 and 2001 there was a decline in the percentage of men and women aged 25 and over with no formal education from 36%. Employment status: Within each population group, a smaller proportion of women than men in the 15 to 65 age group were employed.
Despite the relatively large increase between 1995 and 2001 in the percentage of women employed, a greater percentage of men than women were still employed in 2001. Between 1995 and 2001 there was an increase in the percentage of women employed in primary industries was employed, domestic work and other unskilled occupations. Access to water: The percentage of households with access to clean piped water has grown nationally.
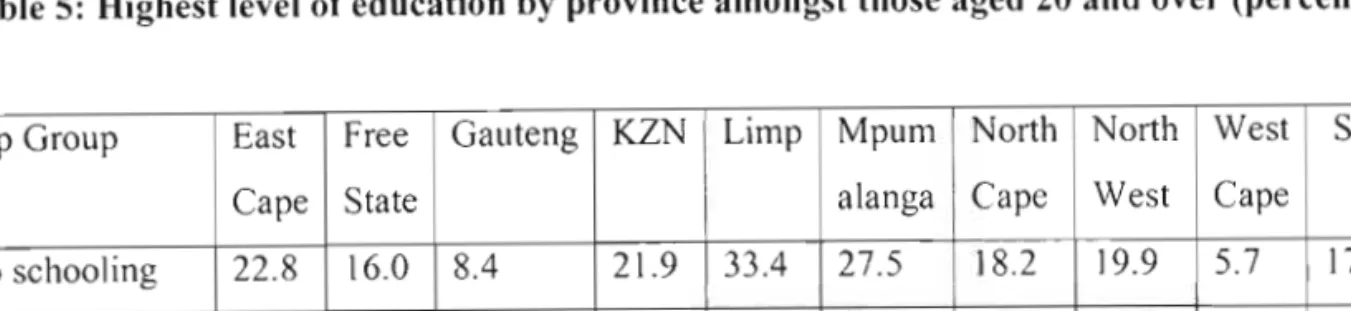
Highest level of education: The percentage of women (20+) with no education has decreased, but is still higher than that of men in the same category. In the next chapter, the socio-economic background of the studied region is presented.
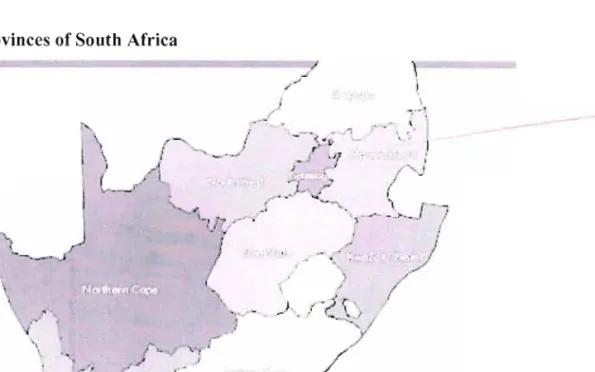
SOCIO-ECONOMIC BACKGROUND OF THE EASTERN CAPE PROVINCE OF SOUTH AFRICA
Education and quality of the labour force
It is therefore important to look at the household's access to infrastructure and services in the Eastem Cape province to ascertain the living conditions and living conditions among the households. The Eastern Cape had the lowest percentage of formal household types (47.3%) and the highest proportion of traditional housing types (38.1%) in the country. In the Eastern Cape, the average household size was 4.1 compared to the national average of 3.8.
In the Eastern Cape, 62.0% of households had access to piped water either at home or locally or from a municipal tap compared to 98.0% for the Western Cape and 84.0% for the national average. Electricity has become the main source of energy used by various households in the country. Overall, in South Africa, 42.4% of households had access to a home telephone (landline or mobile).
However, in the Eastern Cape, three out of every ten households did not have access to toilet facilities, the worst affected in the country. Further more than half of households (55.5%) in South Africa had a refuse collection service once a week or more often, but in the Eastern Cape only 36.4% of households had access to these services Census in Brief, 2001 .

THE RESEARCH METHODOLOGY
The survey instrument
But the size of the exercise can limit a census to collecting a few demographic and socio-economic variables. Moreover, there is often time between the progress of the counts and the moment when the results are known. Censuses are therefore not suitable as a monitoring tool, but provide a framework from which smaller samples can be drawn for various household surveys.
One of the most powerful features of household surveys is that they can use probability samples. These allow accurate estimates of the proportion of the total population that has the characteristic being measured. Nevertheless, unless the sample size is large, estimates for small areas or small subsets of the population cannot be generated without significant margins of error.
Instead of interviews with individuals, group contexts are used with a visual exchange of information, which ensures that weaker or marginalized members of the community are empowered to communicate.” The views and perceptions thus obtained help researchers gain a deeper understanding of the poverty situation. in a particular community.
Multiple techniques and triangulation
Which measurement approach?
Taking into account the objectives of the research, the survey approach is the most convenient, reliable and consistent measurement tool to generate information and monitor these indicators. Demographic data was largely used to strengthen the ideological position to protect the economic advantage of the white population (Mfono, 2001). After careful evaluation of the above sources, the General Household Survey (GHS) 2002 conducted by Statistics South Africa is chosen as the main data set to be used for the analysis.
Similarly, the twice-yearly labor force survey covers only some limited areas of households, as it is a specialized survey aimed at measuring labor market dynamics. The 2002 version was chosen because it includes some additions to the usual coverage of the previous safety and security standards it replaced, in addition to being a more recent document. As the studies focus on poor households, the primary analysis concerns the delineation between 'poor' and 'non-poor' households in the province based on the gender of the household head.
However, it is important to show the dynamics in the experience of poverty in the province. The main limitation of using the expenditure measure (instead of income) is that the expenditure measure is likely to create gender bias - underestimating the expenditure of male-headed households compared to female-headed households; since women are responsible for consumption, they report more.
ANALYSIS AND INTERPRETATIONS
Categories of Analysis
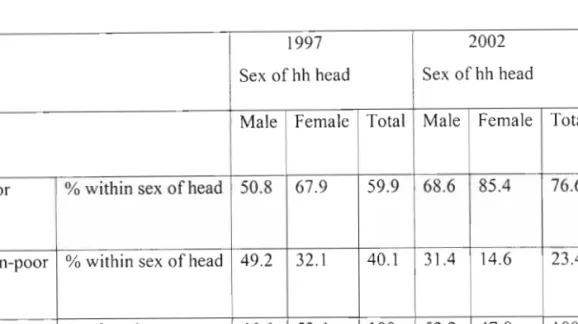
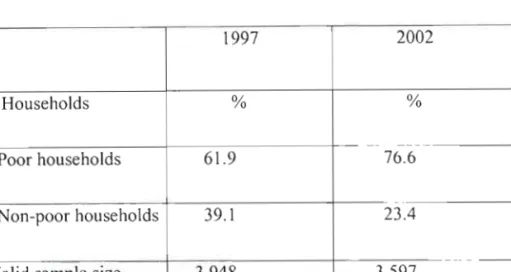
Distribution of poor and non-poor households in Eastern Cape
- Employment and occupation
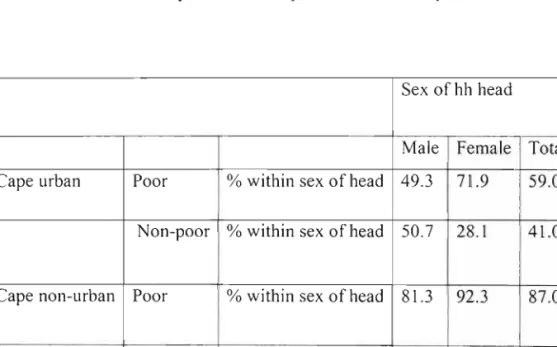
Note: The analysis shows a large increase in the number of employees during the period. In rural areas of the province, an extremely large 92.3% of all FHHs compared to 81.7% of MHHs were poor. Well-being is associated with decent homes of the formal type, with flush toilets, regular cleaning and a telephone in the home.
According to Table 15, formal brick buildings (42%), traditional dwellings (36%) and informal dwellings/huts (9%) constitute the major housing types in the Eastern Cape in 2002. A further breakdown shows that female-headed households were over-represented in the traditional housing type category, with 41% of all FHHs being traditional types, compared to 30% for MHHs in 2002. This is an improvement on the 1997 situation. , when 62.0% of all households had no worker in the household while about 36.5% had one or two workers in the household.
Not having a worker in the family means a lack of income from employment and therefore a higher risk of entering or remaining in poverty. In summary, the life circumstances of most people in the Eastern Cape are characterized by low and unskilled levels of education and very low levels of employment.
Conclusion
However, living conditions in the Province are characterized by low and unskilled levels of education as well as low levels of employment in low-wage jobs; these are essential characteristics of poverty and seem to affect women more than men. In summary, the analysis has established that poverty in the Eastern Cape Province is gendered, with women more likely to be affected despite efforts over the years to curb gender inequality and the experience of poverty.
Conclusion
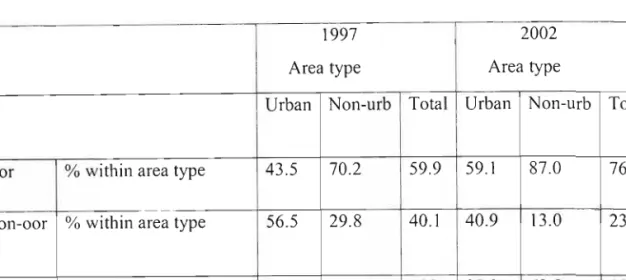
In the province, poor households were overrepresented in non-metropolitan areas, with female-headed households making up the majority. Women are therefore at greater risk of experiencing hardship and poverty than men in the Eastern Cape. The study also found that the lack of access to these services is particularly high in non-urban areas, and in female-headed households compared to male-headed households.
The study established that living conditions among households in the Eastern Cape are characterized by low levels of education and employment. For both years, female-headed households were overrepresented in the no worker household category. Furthermore, the study also showed that, in the specific case of the Eastern Cape Province, it is the African population group in the non-urban areas of the province that would be likely to be affected by poverty and poverty processes.
Empirically, the study showed that among poor households in the Eastern Cape Province, households headed by women were overrepresented compared to households headed by men. The population group and area of location of households appeared in the study as strongly correlated with the experience of poverty.
Chi-Square test on variables
Frequencies on poor households using different poverty thresholds for the 1997 OHS data set
Total household expenditure less than R586 p.m
Total household expenditure less than R650 p.m
Total household expenditure less than R700 p.m