Directory UMM :Data Elmu:jurnal:T:Tree Physiology:Vol15.1995:
Bebas
8
0
0
Teks penuh
Gambar
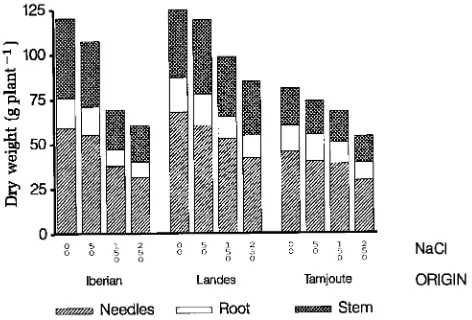
![Table 3. Genotype and salinity effects on dry matter production. The table gives the results of the analysis of variance (Fmmolthe treatment or total dry matter per plant, [NaCl] is the salinity (mmol), values estimated for the salinity effect](https://thumb-ap.123doks.com/thumbv2/123dok/1014887.923641/4.612.56.279.361.631/genotype-salinity-production-fmmolthe-treatment-salinity-estimated-salinity.webp)
![Table 6. Estimates of model parameters and comparison of means forsalinity and genotype effects on the predawn osmotic water potentialsalinity [NaCl]where denotes the genotype, mean osmotic potential among genotypes at NaCl = 0 (mm dayof cellular sap](https://thumb-ap.123doks.com/thumbv2/123dok/1014887.923641/5.612.68.238.282.561/estimates-parameters-comparison-forsalinity-potentialsalinity-genotype-potential-genotypes.webp)
+2
![Figure 5. Relationship between flowing solution salinity ([NaCl]),turgor (and foliar concentration of sodium ([Na]line, Iberian = dashed-dotted line, and Tamjoute = dashed line](https://thumb-ap.123doks.com/thumbv2/123dok/1014887.923641/6.612.57.265.76.376/figure-relationship-flowing-solution-salinity-concentration-iberian-tamjoute.webp)
Dokumen terkait