Our study is the first attempt to examine the informational content of risk-neutral estimates in the crude oil market. We also examine the predictability of the extracted risk-neutral information in forecasting future crude oil returns. According to the new framework implied volatility parity without arbitrage, both variance and covariance rates determine the shape of the implied volatility smile.
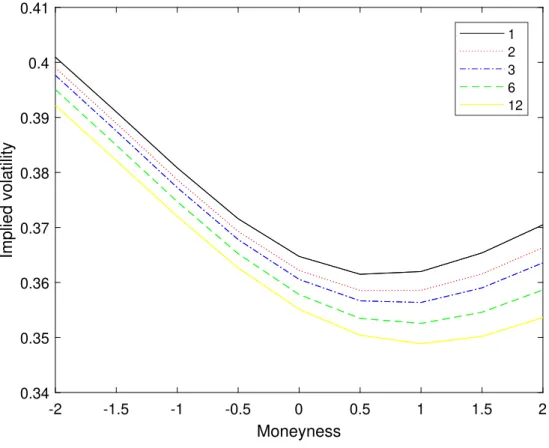
Under commonality assumptions, the variance and covariance numbers expected by the market can be derived from the observed shape of the implied volatility smile. We document the term structure of the implied volatility smile of USO options, which shows a negative skew pattern with a positive curvature. Based on the new framework's non-arbitrage implied volatility parity, we extract the variance and covariance estimates from the implied volatility smile.
2015) find a negative relationship between the slope of the implied volatility smile and future stock returns. Jia et al. (2020) use information from the dynamics of the term structure of implied volatility smile parameters to predict future excess oil returns.
The no-arbitrage implied volatility parity based on a new framework
Construct floating series of implied volatility
USO implied volatility smile
Risk-neutral estimates
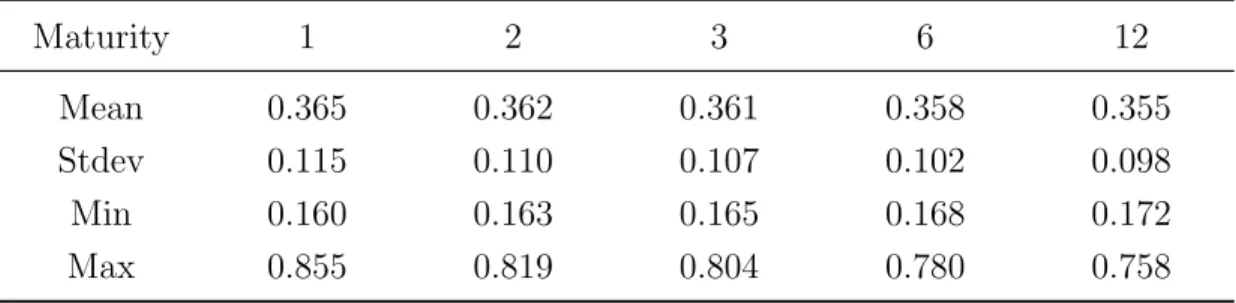
According to equation (2), positive skewness will produce a positive degree of variance ωt, while negative implied volatility is expected to produce a negative degree of covariance γt. From panel A, we can see that the mean covariance rates are negative across all maturities, indicating that the implied volatility smiles on the USO are negatively skewed. As maturity increases, the degree of variance decreases, suggesting that the implied volatility smile has more curvature at shorter maturities than at longer maturities.
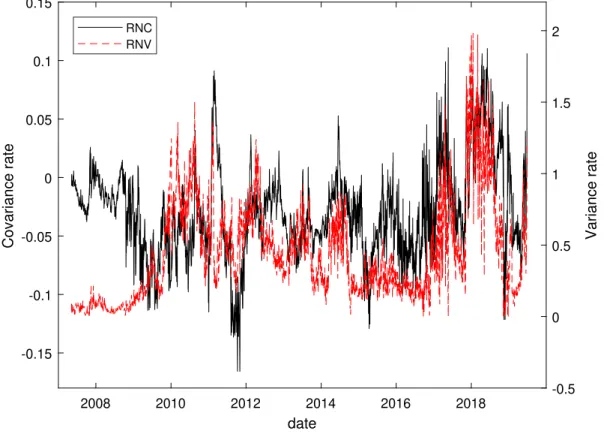
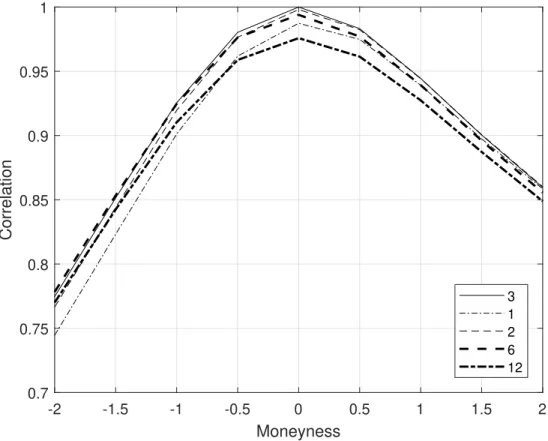
The standard deviation for the percentage of variance is significantly larger than that for the percentage of covariance, indicating that the percentage of variance varies much more than the percentage of covariance. We see that the covariance rate peaks downwards. 10We provide evidence of the local and global commonality in the co-movements within the ranges of floating implied volatility changes. The results are shown in Figures B1 and B2 in Appendix B. Figure B1 shows that the log implied volatility changes for the at-the-money contract are highly correlated with those for other contracts within one standard deviation of at-the-money.
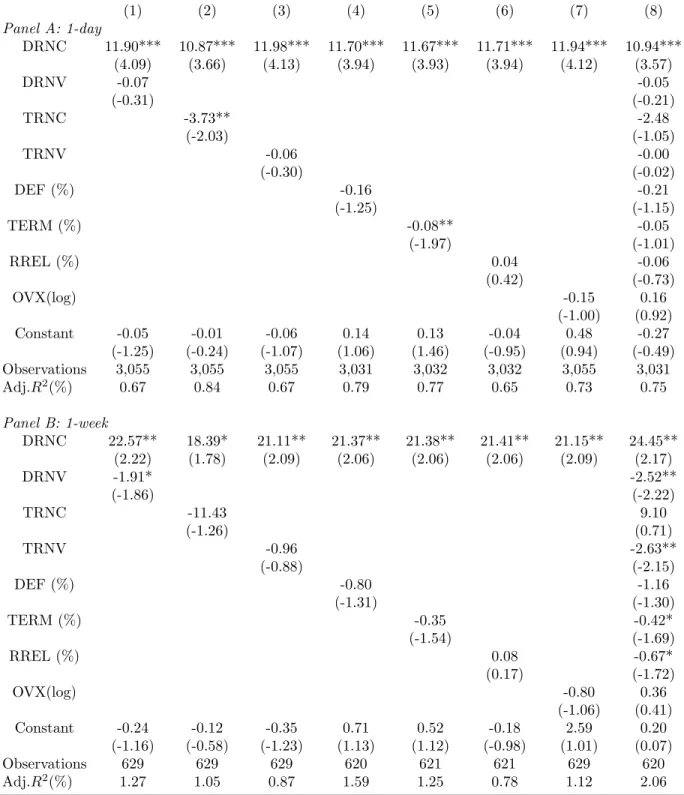
As suggested by Vasquez (2017), the implied volatility term structure conveys information about future option returns. As predictors, we also consider T RN V and T RN C, the term structure of the variance and the degree of covariance.
USO return predictability
However, our DRN C, innovation in the risk-neutral covariance measure, can significantly predict USO's excess returns in the in-sample tests. We use Clark and West's (2007) corrected mean squared prediction error statistic to test whether the out-of-sample R2 statistic is significantly greater than zero. 7) To test whether R2OS >0, we make this statistic a constant and provide one-sided p-values for the R2OS statistic. Regarding the above sample tests, DRN C is the best predictor that can predict daily, weekly and monthly USO excess returns among the four predictors.
Overall, DRN C performs better than the other predictors based on the out-of-sample tests, which is consistent with the in-sample results. DRN C also shows significant 1-month out-of-sample R2 of 1.87, which is much higher than out-of-sample R2 at other forecast horizons. The monthly predictive score is higher than the finding of Jia et al. (2020) that innovation in slope parameters has no out-of-sample predictive performance.
Compared to DRN C, the other three predictors show poor out-of-sample predictive performance on most prediction horizons. We provide robust evidence, both from in- and out-sample testing, that DRN C is a strong predictor of future excessive returns on the USO. First, after controlling for the other risk-neutral predictors and macroeconomic variables, DRN C is expected to significantly predict the excessive returns of the USO over various horizons.
It seems that all forecasters except DRN C have no useful information about the USO's future excess return. 12For the predictability of monthly multivariate returns, the coefficients of DRN C (55.77 and 54.08) are slightly larger than the corresponding (39.16) in Table 8 when combining a range of control variables. 2010) and Ferreira and Santa-Clara (2011), to evaluate the economic significance of out-of-sample predictability, we construct trading strategies based on return predictions, and calculate the CE return for a medium variance investor trying to allocate between USO ETF and Risk Free Assets. The CE profit is the difference between the CE of the strategy based on forecasters and the CE of the strategy based on the historical average of market returns.
Overall, DRN C is the only predictor that has positive portfolio return and portfolio volatility over different horizons. For example, at monthly rebalancing frequency it produces the positive SR profit (0.44) and CE profit (1.98%) relative to investment based on the historical average.15 None of the other predictors can generate positive SR profits and CE profits, indicating that these predictors cannot show any economic significance of out-of-sample predictability at monthly frequency. We conclude that DRN C predicts daily, weekly, and monthly USO out-of-sample excess returns with economic significance.
Alternative market returns
We document the term structure and dynamics of risk-neutral valuations that lead to a negatively skewed USO implied volatility smile form with positive curvature. The current gains and losses of an option investment can be attributed to variation in calendar time, the underlying price of the security, and implied volatility. Under constant price movements and implied volatility and zero funding costs, no dynamic arbitrage requires that the option price be set to balance the theta loss of the option with the expected gains and losses from the vega, gamma, volga, and vanna option exposures at any point in time.
Assuming continuous price and implied volatility movements, and performing instantaneous P&L attribution on a European option investment based on the BMS price equation, a no-arbitrage price relationship can be achieved based on equations (A.4) and (A. 5). where µtandωt2 denotes the risk-neutral conditional mean and variance of the implied volatility percentage change, σ2t is the conditional variance of the underlying security return, γt is the conditional covariance between the implied volatility percentage change and underlying security return. The expected rate of implied volatility change scales proportionally with the at-the-money contract. Under the assumption, the no-arbitrage implied volatility parity can be obtained by subtracting Equation (A.7) from (A.6).
Atilgan, Yigit, Turan G Bali and K Ozgur Demirtas, 2015, Implied Volatility Spreads and Expected Market Returns, Journal of Business & Economic Statistics 33, 87–101. Chalamandaris, Georgios and Andrianos E Tsekrekos, 2011, How important is the term structure in the modeling of implied volatility surfaces. Goncalves, Silvia and Massimo Guidolin, 2006, Predictable dynamics in the S&P 500 index options implied volatility surface, Journal of Business.
Han, Bing and Gang Li, 2020, The Information Content of Implied Aggregate Volatility Spreads, Management Science (forthcoming). Jia, Xiaolan, Xinfeng Ruan and Jin E Zhang, 2020, The implied volatility smile of commodity options, Journal of Futures Markets (forthcoming). Kearney, Fearghal, Han Lin Shang, and Lisa Sheenan, 2019, Surface Predictability of Implied Volatility: The Case of Commodity Markets, Journal of Banking and Finance.
Soini, Vesa and Sindre Lorentzen, 2019, Option Pricing and Implied Volatility in the Crude Oil Market, Energy Economics. This table reports summary statistics for the covariance and variance rate term structures derived from the no-arbitrage implied volatility equation based on Carr and Wu's (2020) new option pricing framework in the crude oil market. The table presents the estimate of the β coefficient, the Newey and West (1987) t-statistics, the adjusted within-sample R2 statistic, and the out-of-sample R2 statistic (R2OS).
The table shows the estimate of the coefficient β, Newey and West's (1987) t-statistics, in-sample adjusted R2 stats, and out-of-sample R2 stats (R2OS). The risk-neutral variance and covariance rates are derived from implied volatility parity without arbitrage, based on the framework of Carr and Wu (2020). The figure presents the cross-correlation estimates of the percentage range of implied volatility changes between the three-month at-the-money option (the reference point) and all other contracts with different maturities and moneyness.
The log percent implied volatility change is defined as Et+1 i = in(It+1i /Iti), where Iti is the implied volatility on date t for each option contract.